. 2021 May 6;17(5):e1009557.
doi: 10.1371/journal.ppat.1009557. eCollection 2021 May.

Pseudomonas aeruginosa-induced nociceptor activation increases susceptibility to infection

Affiliations

Pseudomonas aeruginosa-induced nociceptor activation increases susceptibility to infection

Tiffany Lin et al. PLoS Pathog. .

Retraction in

Abstract

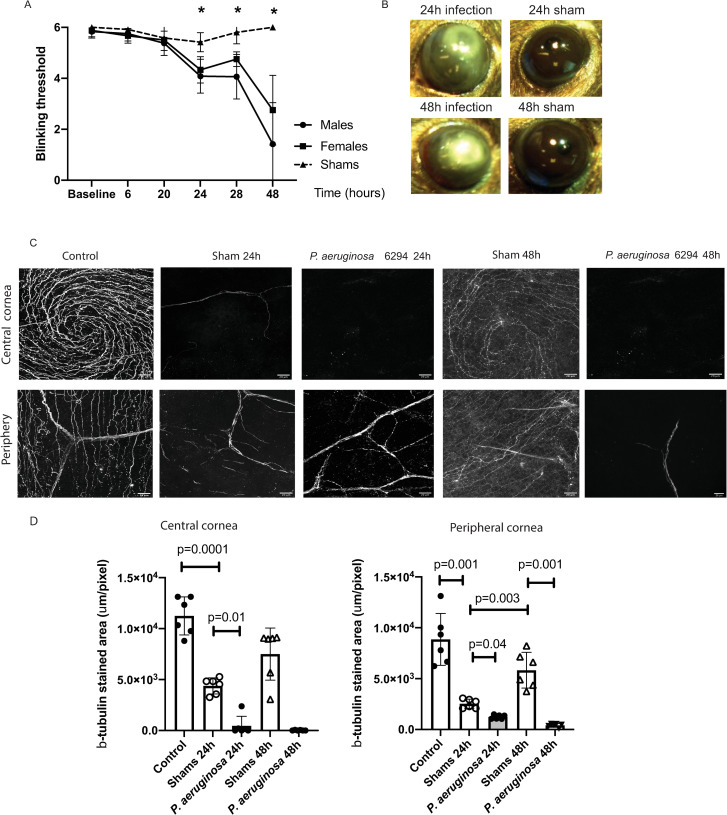
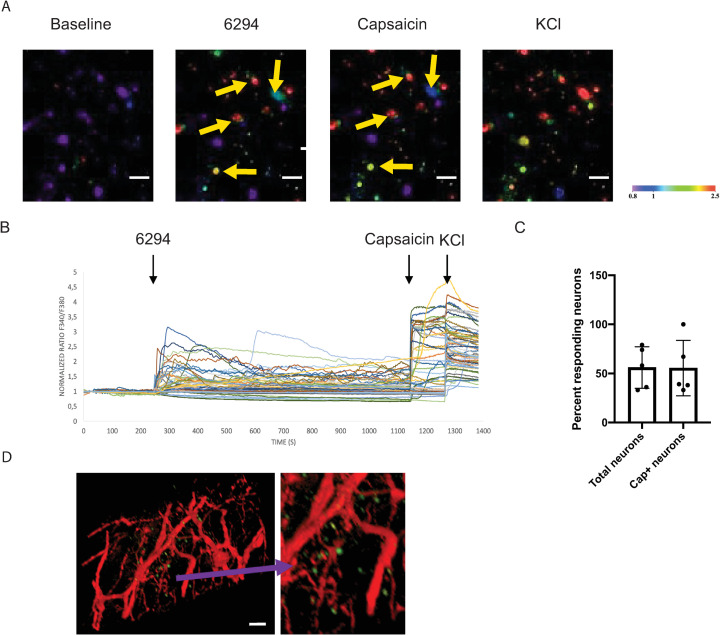
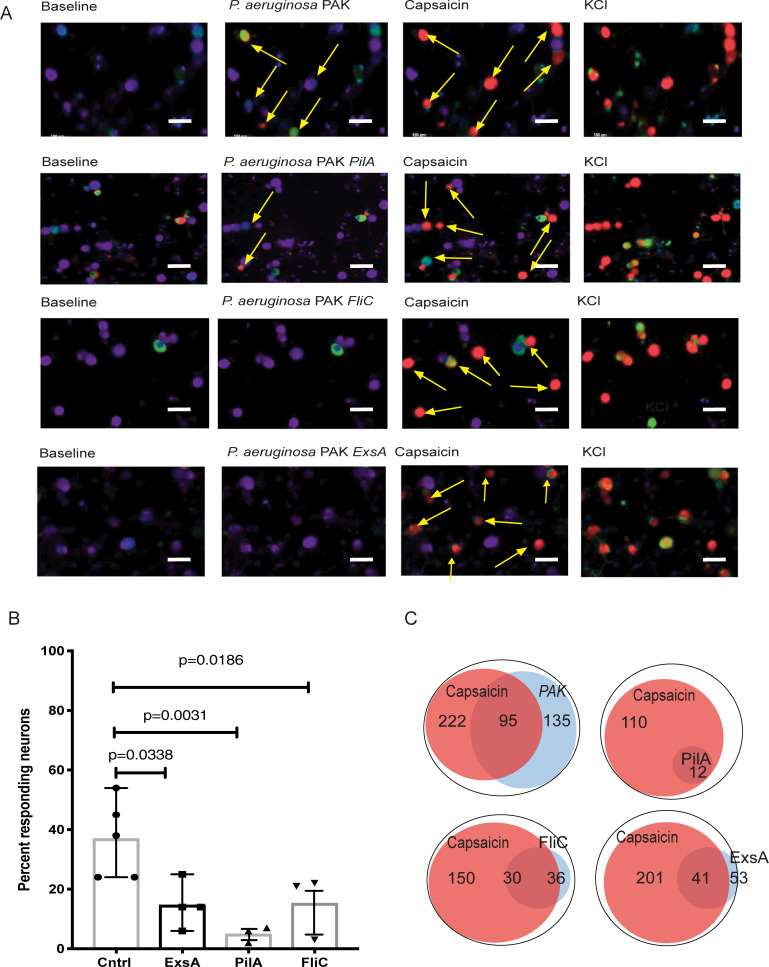
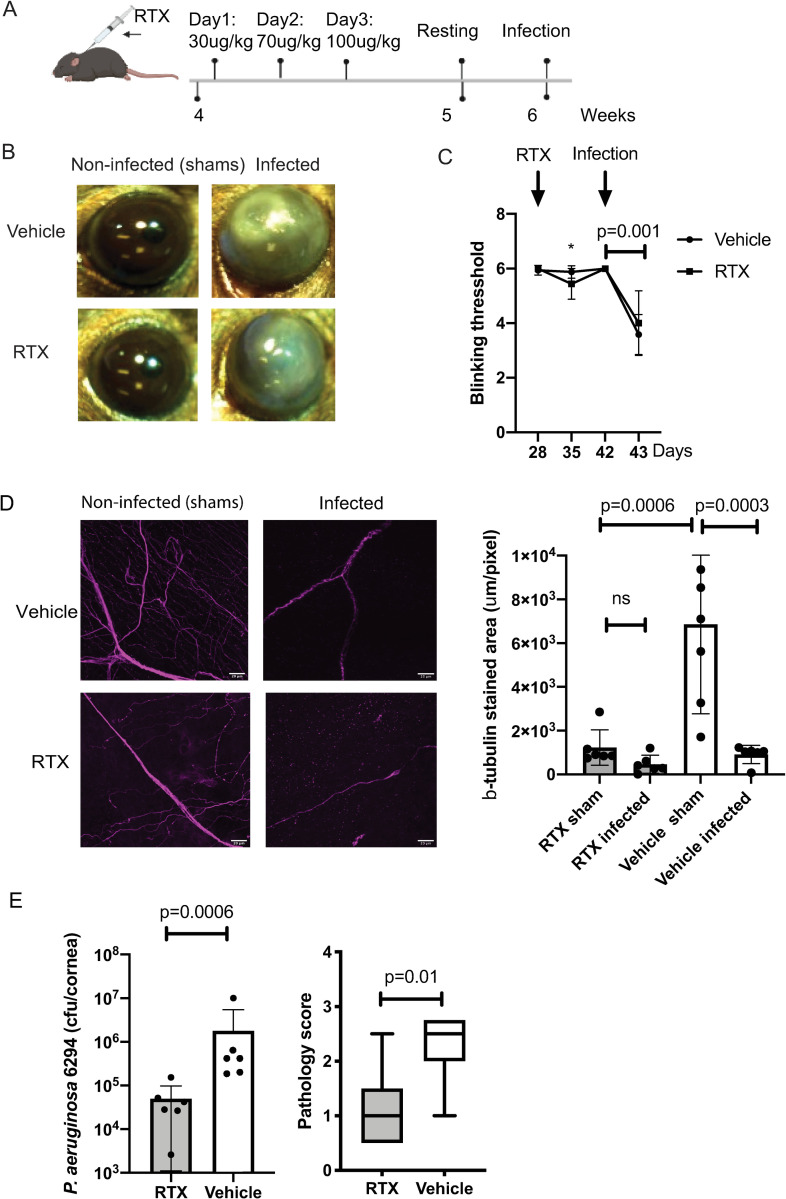
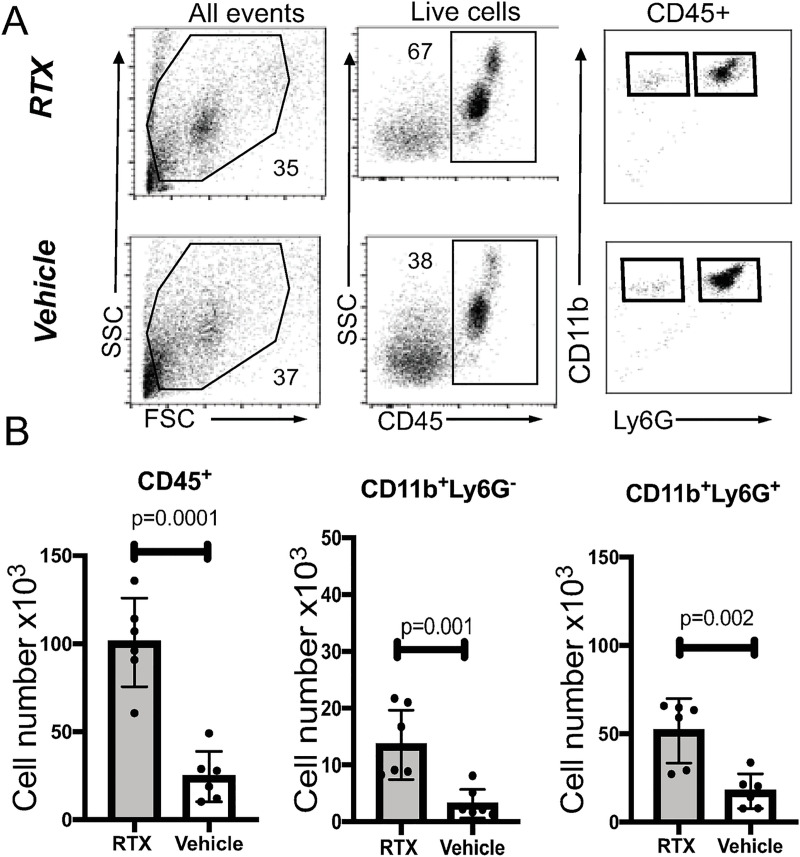
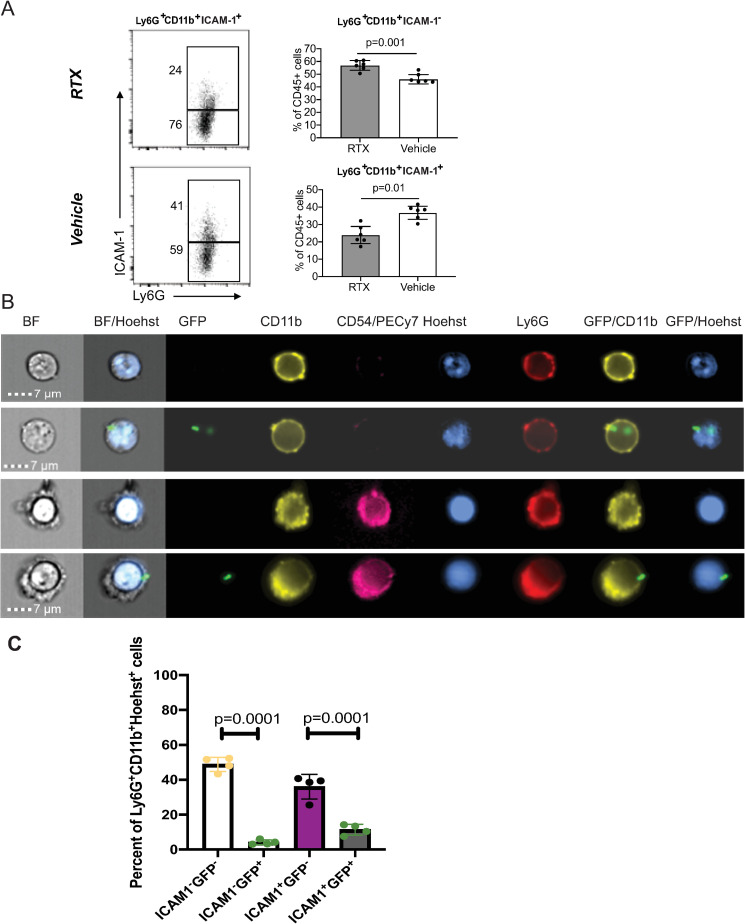
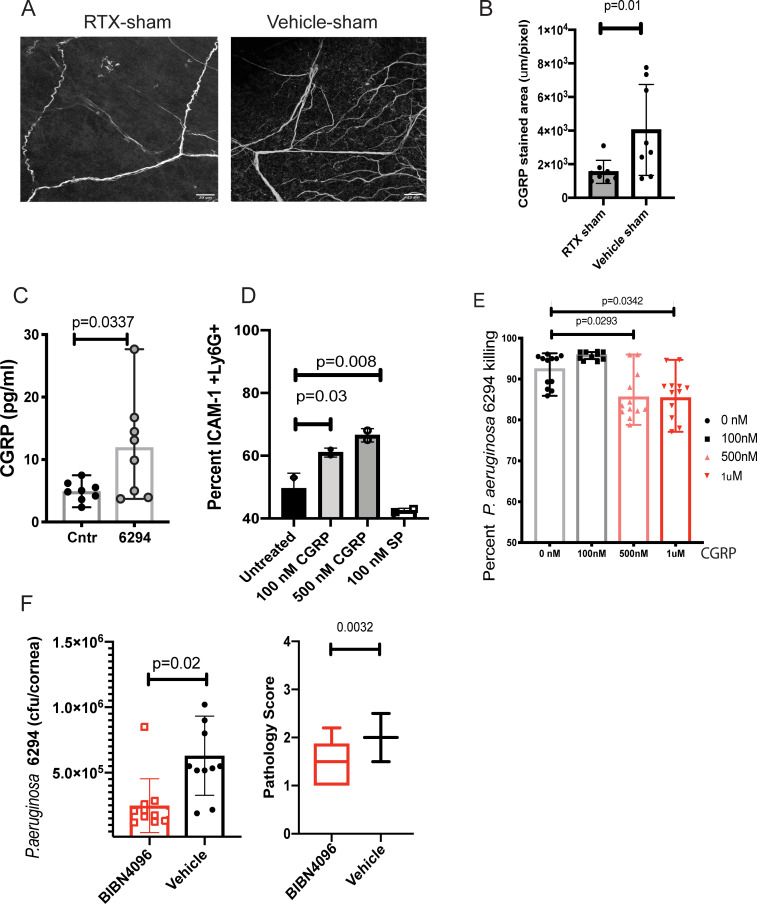
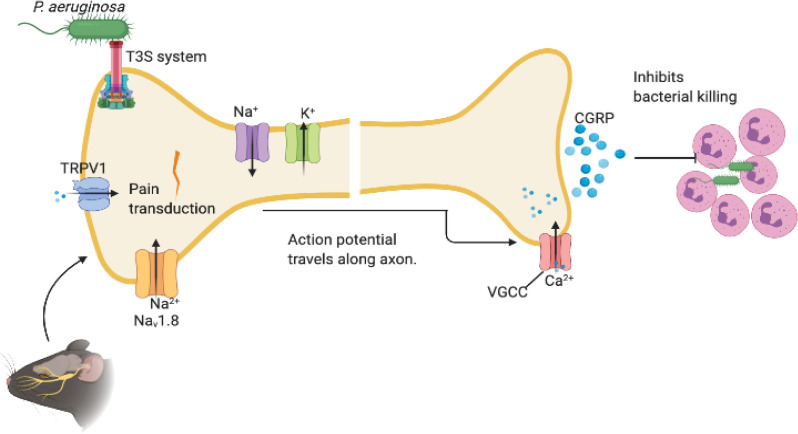
We report a rapid reduction in blink reflexes during in vivo ocular Pseudomonas aeruginosa infection, which is commonly attributed and indicative of functional neuronal damage. Sensory neurons derived in vitro from trigeminal ganglia (TG) were able to directly respond to P. aeruginosa but reacted significantly less to strains of P. aeruginosa that lacked virulence factors such as pili, flagella, or a type III secretion system. These observations led us to explore the impact of neurons on the host's susceptibility to P. aeruginosa keratitis. Mice were treated with Resiniferatoxin (RTX), a potent activator of Transient Receptor Potential Vanilloid 1 (TRPV1) channels, which significantly ablated corneal sensory neurons, exhibited delayed disease progression that was exemplified with decreased bacterial corneal burdens and altered neutrophil trafficking. Sensitization to disease was due to the increased frequencies of CGRP-induced ICAM-1+ neutrophils in the infected corneas and reduced neutrophil bactericidal activities. These data showed that sensory neurons regulate corneal neutrophil responses in a tissue-specific matter affecting disease progression during P. aeruginosa keratitis. Hence, therapeutic modalities that control nociception could beneficially impact anti-infective therapy.


Conflict of interest statement

No authors have competing interests.

Figures

Fig 1
Fig 1. Bacterial infection induces neuropathy.
A. Corneal sensitivity was tested using Cochet-Bonnet esthesiometer. Infected male (N = 6) and female (N = 6) cohorts of C57BL6/N mice were compared to shams (N = 6). Changes in the blink reflexes were monitored over time (hours). The asterisks denote significant differences in blink reflexes (Two-way ANOVA, 24h, p = 0.0001; 28h, p = 0.0006; 48h, p = 0.0001). B. Eyes from C57BL6/N mice were either scratched (shams) (N = 6) or scratched and infected with 5x10⁵ CFU/eye P. aeruginosa 6294 (N = 6). Representative images of eye appearance at 24h and 48h post-infectious challenge are shown. The images were acquired using Motic SMZ140-143 stereomicroscope. C. Corneal tissues were harvested at 24h and 48h after challenge and corneal tissues were stained for β-tubulin. Z-stacks of corneal whole-mounts covering a depth of 40 μm were acquired with 1 μm step. The z- stacks were collapsed to 2D. The images are representative 2D projections. The top series of images are depicting central area of corneas while the bottom panels depict β-tubulin staining in peripheral corneas; scale bar, 20 μm. the appearance of six individual corneal whole mounts were compared per condition. D. Image quantification using Fiji. The 40 μm z-stacks were collapsed to 2D and areas of β-tubulin staining were calculated per slide. Data are presented with bar plots where each symbol represents the value of an individual animal. One-way ANOVA, overall p = 0.001. P values for the individual comparisons are shown on the plot. Asterisks indicate significant differences. Data demonstrate that infection changes corneal pain sensation and reduces densities of the neuronal network in central and peripheral corneas.
Fig 2
Fig 2. P. aeruginosa 6294 activates trigeminal neurons.
Trigeminal ganglia were harvested from C57BL67/N mice; cultured neuronal cells (see text) were exposed to live P. aeruginosa 6294 (MOI 10), capsaicin, and potassium chloride (KCl). Calcium influx into the neuronal cells was imaged in real-time using Fura-2 AM dye. Capsaicin activated TRPV1 firing; KCl activated all neurons. A. Representative confocal images of neuronal cells responding to stimuli acquired at 40x magnification; scale bar, 50μm. Neurons were imaged for 30 minutes. The appearance of green or red neuronal cells (arrows) indicates increase of intracellular Ca2+ levels proportionally to the degree of activation in real-time (color bar: fluorescence intensity, arb. units). B. Representative time course of calcium traces in activated neurons in one of two independent experiments. Time course is followed measuring normalized fluorescence intensity 340/360 ratio. Black arrows indicate the time point of application of 6294, capsaicin, and KCl. C. Bar graph depicts the total number of responding neurons per field of view at 10x magnification. The first bar indicates percent of neurons responding to bacteria; values are mean +/-SD. The second bar depicts the number of neurons responding to P. aeruginosa that also respond to capsaicin stimulation. Cumulatively, data show that similar numbers of TG neurons respond to capsaicin and P. aeruginosa. D. Representative whole-mount ocular image shows the proximity of bacteria and neuronal fibers. Mice expressing a red fluorescent protein under the NaV 1.8 promoter (Nav 1.8cre/TdTomato, red) were infected with 5x10⁵ CFU/eye GFP-expressing P. aeruginosa 6294 (Green). The scale bar is 20μm. Cumulatively, these data demonstrate that P. aeruginosa induces Ca2+ influxes in neurons, reflective of activation.
Fig 3
Fig 3. P. aeruginosa virulence factors pili, flagella, and T3SS trigger neuronal activation.
A. Representative confocal images of neuronal activation by PAK (first row), PAK ΔpilA (second row), PAK ΔfliC (third row), and PAK ΔexsA (forth raw) strains of P. aeruginosa. Images were acquired at 10x magnification. Scale bar, 100 μm. Trigeminal ganglia were harvested from C57BL6/N mice and neuronal cultures were grown in vitro. Cultures were activated by exposure to live P. aeruginosa PAK or mutant strains, capsaicin, and potassium chloride (KCl). Neuronal cell activation was imaged for 30 min. Appearances of green or red neuronal cells (arrows) are indicative of activation. Capsaicin activates TRPV1-carrying neurons. KCl activates all live neurons. The arrows point to neuronal cells responding to stimulation. Note the appearance of green cells upon P. aeruginosa PAK stimulation (second image, first raw); the color changes to red upon capsaicin stimulation, illustrating the response of capsaicin-sensitive TRPV-1+ nociceptors. The transition from green to red indicates increase in the strength of Ca2+ fluxes activation (see also caption under Fig 2). Expectedly, capsaicin application after P. aeruginosa stimulation elevates Ca2+ fluxes. B. Percent of neurons responding to different strains of P. aeruginosa. Responding cells were characterized as neurons that displayed a signal 25% higher than the baseline. Significantly fewer neurons responded to exsA, pilA, and fliC mutants when compared to neurons responding to PAK WT (Overall one-way ANOVA p<0.05, p-values indicate comparisons to PAK WT exposure (Cntrl) using Dunnett’s pairwise comparison test). C. Venn diagrams of numbers of P. aeruginosa–induced responding neurons and capsaicin-responding neurons per analysis. The overlap between capsaicin-responding neurons and P. aeruginosa-responding neurons indicates that TRPV1+ neurons can be activated after P. aeruginosa stimulation. Data show that virulence factors governing bacterial motility or T3SS promote neuronal activation.
Fig 4
Fig 4. RTX treatment reduces bacterial burden in the infected eyes.
A. Schematic representation of the experimental approach. Subcutaneous inoculation of RTX was given to four-week-old mice. The mice were treated for 3 consecutive days, with incrementing dosages; day one: 30 μg/kg; day two: 70 μg/kg; day three: 100 μg/kg. Mice were rested and infected at 6 weeks of age with 5x10⁵ CFU/ml of P. aeruginosa 6294. Ocular tissues were harvested for analysis. B. Representative images of sham (left) and infected (right) eyes at 24h post-challenge. Data are representative from three independent experiments with N = 6 mice per treatment per experiment. C. Corneal sensitivity was captured by measuring the blinking thresholds of mice longitudinally, commencing with RTX treatment and ending with infection. The RTX treatment caused a mild, but significant decrease of blinking reflexes (asterisk, p = 0.003, Two-way ANOVA) that was observed only a week post-treatment, followed by complete recovery. The blinking threshold significantly declined in infected mice under both treatments. Data are representative from three independent experiments with N = 6 mice per treatment per experiment. D. Representative images of stained for β-tubulin shams and infected corneal whole mounts from RTX- and vehicle-treated mice, scale bar = 20 μm. The z-stack covers 40 μm from corneal epithelium to stroma with 1 μm interval and is shown as 2D projection. The images were analyzed using custom script in Fiji to quantify stained areas per image. Six whole-mounts per group per treatment were analyzed and values plotted (right panel; p-values by One-way ANOVA; ns, not significant). The quantification of β-tubulin-stained areas shows decrease of β-tubulin in cornea periphery upon RTX treatment and with infection. E. Mouse scratch-injured corneas were infected with 5x10⁵ CFU/ml of P. aeruginosa 6294 and corneal and conjunctival tissues were harvested at 24h post-challenge. Bacterial burdens were determined by plate counts (Student’s t-test, p = 0.0001). Corneal pathology was depicted by box and whiskers plots showing 25% and 75% ranges (Mann-Whitney comparison, p = 0.01). Data are representative from three independent experiments, each containing cohorts with N = 6 mice per treatment per experiment. Cumulatively, data show that the reduction in neuronal fibers abundance consequent to RTX treatment did not cause sustained alterations in blink reflexes. Significant changes in pain sensation were observed only consequent to infection irrespective of RTX treatment. RTX treatment resulted in decreased P. aeruginosa burden in the infected corneas.
Fig 5
Fig 5. Neutrophil recruitment is increased in RTX-treated corneas.
A. Flow cytometry analysis of cellular infiltrates in infected corneas from RTX-treated and vehicle-treated mice. Panels describe the gating strategy to identify myeloid subpopulations. PMNs were defined on FSC vs SSC gate, as CD45+, live cells that express CD11b and Ly6G. B. Quantification of the absolute cell counts reflecting populations of total CD45+ infiltrates (first panel), Ly6G+CD11b- (second panel) and Ly6G+CD11b+ (third panel, neutrophils). Bar graphs show mean values; symbols represent individual mouse. Data are from N = 6 infected corneas (1 per mouse) per condition representative of two independent experiments. P-values by Student’s t-test. Cumulatively, data show increased cellularity in the infected RTX-treated mice.
Fig 6
Fig 6. RTX treatment reduces the frequencies of CD11b+ Ly6G+ICAM-1+ myeloid cells in the infected corneas.
A. Histogram plots show gating and frequencies of CD11b+ Ly6G+ICAM-1- and CD11b+Ly6G+ ICAM-1+ cells. Data represent 6 infected corneas (1 per mouse) per condition per cohort. The experiment was repeated twice. Bar graphs show mean values; symbols represent individual mouse. P-values by Student’s t-test. B. Representative ImageStream images of CD11b+ Ly6G+ICAM-1+ and CD11b+ Ly6G+ ICAM-1- cells. Mice were infected with 5×10⁵ CFU of GFP-expressing P. aeruginosa 6294 (Green) per cornea; tissue was harvested at 24h post-challenge for analysis. Cellular suspensions were prepared with collagenase digestion and stained for CD45, CD11b, Ly6G, ICAM-1, and DNA (Hoechst) to identify myeloid infiltrates. CD11b+ Ly6G+ cells show banded or multi-lobed nuclear morphology typical of neutrophils. C. Quantification of CD11b+ Ly6G+ICAM-1+ and CD11b+ Ly6G+ ICAM-1- myeloid cells containing intracellular P. aeruginosa-GFP (p-values by one-way ANOVA). Cumulatively, data show that nociceptor presence alters myeloid phenotypes in the infected corneas, enriching for CD11b+ ICAM-1+ Ly6G+ myeloid cells in vehicle-treated mice when compared to RTX-treated mice.
Fig 7
Fig 7. CGRP inhibits bactericidal activities of neutrophils.
A. RTX treatment reduces CGRP levels in sham-treated corneas. Representative images of CGRP staining of corneal whole-mounts from RTX and vehicle-treated shams. Z-stacks were collected from cornea periphery using Zeiss LSM710 confocal microscope with a 40x objective, scale bar = 20 μm. The z-stacks were collapsed to 2D and images were analyzed using Fiji software to quantify stained areas per image. The Z-stacks comprised sub-basal nerve plexus and stromal nerves spanning a depth of 40μm. Eight whole mounts per group per treatment were analyzed (Student’s t-test, p = 0.01). Each value represents an individual animal. B. The quantification of CGRP stained areas shows a decrease of CGRP staining in the sub-basal neuronal fibers of cornea periphery of RTX sham-treated mice when compared to sham vehicles. C. P. aeruginosa 6294 infections significantly induced CGRP release in trigeminal ganglia (TG)-derived neuronal cultures. CGRP concentrations were measured in the supernatants by ELISA. Bars represent means of individual mice values (symbols; Student’s t-test, p = 0.03). Saline treatment was used as control. Data are representative of two experiments. D. Exposure to CGRP, but not Substance P, upregulates membrane ICAM-1 in BM-derived neutrophils exposed to P. aeruginosa. PMNs were pretreated with 100 nM, 500 nM CGRP, or 100nM Substance P for 6h, then exposed to P. aeruginosa 6294 at MOI 0.01 for 30 min. Cells were washed, Fc blocked, and stained for ICAM-1+, CD11b+, Ly6G+, and 7AAD. Viable, Ly6G positive cells were compared for ICAM-1 levels. Percent ICAM-1+ cells were plotted. Data represent mean values. The experiment was repeated twice. E. CGRP inhibits bactericidal function of neutrophils. Data from three independent experiments are combined; each symbol represents cells derived from an individual mouse. One-way ANOVA, Dunnett’s multiple comparison test, p = 0.02 and p = 0.03. F. CGRP antagonist decreases bacterial burden in the infected corneas and conjunctival tissues. C57BL/6 mice were infected with P. aeruginosa 6294 at 5x10⁵ CFU/eye. BIBN4096 (30 mg/kg) or vehicle were injected intraperitoneally one hour after the infectious challenge. Corneal and conjunctival tissues were harvested at 24h. Symbols represent individual mice. 10 mice per cohort were analyzed. Vehicle-treated mice had significantly higher bacterial presence when compared to BIBN4096-treated mice, illustrating CGRP-driven inhibition of immunity to P. aeruginosa (Student’s t-test, p = 0.02) (first plot). BIBN4096 treatment moderately reduced corneal pathology in the infected mice (Mann-Whitney, p = 0.003). Cumulatively, data show that P. aeruginosa induces CGRP release by neuronal cells in vitro and that blockade of CGRP in vivo partially resembles the phenotype of the infected RTX-treated mice displaying lower bacterial presence during early hours of infection. The phenotype is likely due to reduced opsonophagocytic killing in the presence of CGRP and correlates with upregulation of ICAM-1 in neutrophils.
Fig 8
Fig 8. Schematic model depicting the impact of neuronal regulation on P. aeruginosa induced keratitis.
P. aeruginosa utilizes flagella, pili, and type III secretion systems to initiate neuronal activation. As a result, the threshold of activation of Transient Receptor Potential Cation Channel, subfamily V, member 1 (TRPV1) is reduced increasing the excitability of the peripheral terminal membrane. When a threshold of depolarization is reached, voltage-gated sodium channels (e.g., NaV1.8) are activated and an action potential is produced and is propagated along the axon. An influx of calcium through voltage-gated calcium channels (VGCC) triggers the release of neuropeptides including calcitonin-gene-related protein (CGRP), which controls myeloid responses in the corneas. CGRP inhibits myeloid infiltration to the tissues and alters myeloid phenotypes in response to infection. The ICAM-1+ Ly6G+ CD11b+ neutrophils have decreased ability to kill bacteria.

References

    1. Hong J, Le Q, Deng SX, Cao W, Xu J. Pseudomonas aeruginosa keratitis misdiagnosed as fungal keratitis by in vivo confocal microscopy: a case report. BMC Res Notes. 2014;7:907. Epub 2014/12/17. 10.1186/1756-0500-7-907 - DOI - PMC - PubMed
    1. Weed MC RG, Kitzmann AS, Goins KM, Wagoner MD. V. Vision Loss After Contact Lens-Related Pseudomonas Keratitis. EyeRoundsorg. 2013.
    1. Gjerde H, Mishra A. Contact lens-related Pseudomonas aeruginosa keratitis in a 49-year-old woman. CMAJ. 2018;190(2):E54. Epub 2018/01/18. 10.1503/cmaj.171165 - DOI - PMC - PubMed
    1. Makwana P, Abulafia A, Ondhia C, Barrett GD. Severe bilateral Pseudomonas keratitis exacerbated by prolonged contact lens wear. Med J Aust. 2014;201(2):112–3. Epub 2014/07/22. 10.5694/mja13.00223 . - DOI - PubMed
    1. Cruzat A, Qazi Y, Hamrah P. In Vivo Confocal Microscopy of Corneal Nerves in Health and Disease. Ocul Surf. 2017;15(1):15–47. Epub 2016/10/25. 10.1016/j.jtos.2016.09.004 - DOI - PMC - PubMed

Publication types