. 2021 Sep 1:785:147284.
doi: 10.1016/j.scitotenv.2021.147284. Epub 2021 Apr 27.

Estrogenicity of chemical mixtures revealed by a panel of bioassays

Affiliations

Estrogenicity of chemical mixtures revealed by a panel of bioassays

Livia Gómez et al. Sci Total Environ. .

Abstract

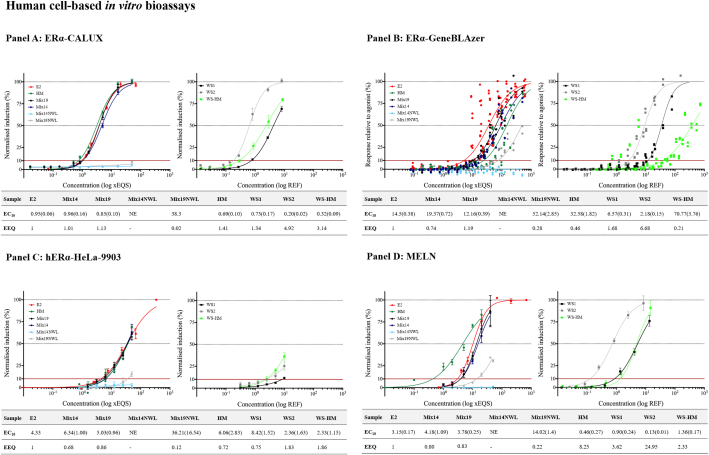
Estrogenic compounds are widely released to surface waters and may cause adverse effects to sensitive aquatic species. Three hormones, estrone, 17β-estradiol and 17α-ethinylestradiol, are of particular concern as they are bioactive at very low concentrations. Current analytical methods are not all sensitive enough for monitoring these substances in water and do not cover mixture effects. Bioassays could complement chemical analysis since they detect the overall effect of complex mixtures. Here, four chemical mixtures and two hormone mixtures were prepared and tested as reference materials together with two environmental water samples by eight laboratories employing nine in vitro and in vivo bioassays covering different steps involved in the estrogenic response. The reference materials included priority substances under the European Water Framework Directive, hormones and other emerging pollutants. Each substance in the mixture was present at its proposed safety limit concentration (EQS) in the European legislation. The in vitro bioassays detected the estrogenic effect of chemical mixtures even when 17β-estradiol was not present but differences in responsiveness were observed. LiBERA was the most responsive, followed by LYES. The additive effect of the hormones was captured by ERα-CALUX, MELN, LYES and LiBERA. Particularly, all in vitro bioassays detected the estrogenic effects in environmental water samples (EEQ values in the range of 0.75-304 × EQS), although the concentrations of hormones were below the limit of quantification in analytical measurements. The present study confirms the applicability of reference materials for estrogenic effects' detection through bioassays and indicates possible methodological drawbacks of some of them that may lead to false negative/positive outcomes. The observed difference in responsiveness among bioassays - based on mixture composition - is probably due to biological differences between them, suggesting that panels of bioassays with different characteristics should be applied according to specific environmental pollution conditions.

Keywords: Bioassay; Chemical mixture; Endocrine disrupting compound (EDC); Environmental quality standard (EQS); Estrogenicity; Hormone mixture.


Conflict of interest statement

Declaration of competing interest The authors declare that they have no known competing financial interests or personal relationships that could have appeared to influence the work reported in this paper.

Figures

Unlabelled Image
Graphical abstract
Fig. 1
Fig. 1
Location of the sampling sites. Sampling site 1: city centre, ARPA-Lazio station located in Via di Ripetta, Rome (coordinates: 41.912351, 12.471794; date: 24/10/2018; time: 02.02 p.m.; temperature: 17 °C; pH: 7.62; conductivity: 1223.5 μS/cm; oxygen saturation: 89.4%). Sampling site 2: Fiumicino, located in Via Ugo Baistrocchi, Fiumicino-Rome (coordinates: 41.770877, 12.24790; date: 24/10/2018; time: 11.20 a.m.; temperature: 16.4 °C; pH: 7.51; conductivity: 4907 μS/cm; oxygen saturation: 55%).
Fig. 2
Fig. 2
Results of testing the RM (Mix14, Mix19, Mix14 NWL, Mix19 NWL and HM), reference compound E2 and WS (WS1, WS2 and WS HM) on the human cell-based estrogenicity bioassays. Each panel shows the results of one bioassay, ERα-CALUX (panel A), ERα-GeneBLAzer (panel B), hERα-HeLa-9903 (panel C), and MELN (panel D). The left graph in each panel shows the dose-response curves obtained with the RM, HM and E2, while the right graph shows the dose-response curves of the WS. The concentrations are expressed as EQS-folds for the RM and E2, and REF for the WS. In each panel, the table below the graphs indicates EC10 values in × EQS or REF interpolated from the dose-response curves and the estrogenic potency compared to E2, expressed as EEQ (x EQS. E2-Eq). It was not possible to generate a complete dose-response curve for the WS1 in the case of hERα-HeLA9903 but the obtained values were fitted to a four-parameter non-linear regression curve from which the EC10 values were extrapolated. NE, no effect. The EC10 values are presented as mean with the standard deviation (SD) in brackets.
Fig. 3
Fig. 3
Results of testing the RM (Mix14, Mix19, Mix14 NWL, Mix19 NWL and HM), reference compound E2 and WS (WS1, WS2 and WS HM) on the yeast-based and the non-cell based estrogenicity bioassays. Each panel shows the results of one bioassay, LYES (panel A), LiBERA (panel B). The left graph in each panel shows the dose-response curves obtained with the RM, HM and E2, while the right graph shows the dose-response curves of the WS. The concentrations are expressed as EQS-folds for the RM and E2, and REF for the WS. In each panel, the table below the graphs indicates EC10 values for LYES and IC10 values for LiBERA in × EQS or REF interpolated from the dose-response curves, and the estrogenic potency compared to E2, expressed as EEQ (x EQS. E2-Eq). In the case of LiBERA, it was not possible to obtain a complete dose-response curve for the WS at the tested concentrations, the IC10 values were interpolated from the fitted sigmoidal one site competition four-parameter logistic curve. ND, not determined; NE, no effect. The EC10 values are presented as mean with the standard deviation (SD) in brackets.
Fig. 4
Fig. 4
Separation of the mixture4 components by HPLC plates and analysis by p-YES. Volumes as indicated above were applied on the HPTLC plate. Panels A and B show the analysis of Mix19 and WS, panel C shows the dose-response relationship of HM, and panel D the characterization of WS-HM. 25 μL of a procedure blank in methanol were applied. Different volumes of Mix19 and HM were applied as indicated. The samples and standards were separated.
Fig. 5
Fig. 5
Vitellogenin (Vtg) expression in fathead minnow (Pimephales promelas) at early life stages after exposure to different EQS-fold concentrations of Mix14, Mix19 and HM. Results are expressed as fish cumulative survival (A) and fold change in vtg expression (B) respect to unexposed fish.

References

    1. 2008/105/EC. European Directive 2008/105/EC---Environmental quality standards in the field of water policy. Official Journal of the European Union, L384/84.
    1. 2013/39/EU. European Directive 2013/39/EU---European Directive amending Directives 2000/60/EC and 2008/105/EC as regards priority substances in the field of water policy. Official Journal of the European Union, L226/1.
    1. Adeel M., Song X., Wang Y., Francis D., Yang Y. Environmental impact of estrogens on human, animal and plant life: a critical review. Environ. Int. 2017;99:107–119. doi: 10.1016/j.envint.2016.12.010. - DOI - PubMed
    1. Balaguer P., François F., Comunale F., Fenet H., Boussioux A.M., Pons M. Reporter cell lines to study the estrogenic effects of xenoestrogens. Sci. Total Environ. 1999;233:47–56. doi: 10.1016/S0048-9697(99)00178-3. - DOI - PubMed
    1. Balaguer P., Boussioux A.-M., Demirpence E., Nicolas J.-C. Reporter cell lines are useful tools for monitoring biological activity of nuclear receptor ligands. Luminescence. 2001;16:153–158. doi: 10.1016/j.aquatox.2015.03.021. - DOI - PubMed

LinkOut - more resources