. 2021 May 6;22(1):233.
doi: 10.1186/s12859-021-04147-y.

Systematic interrogation of mutation groupings reveals divergent downstream expression programs within key cancer genes

Affiliations

Systematic interrogation of mutation groupings reveals divergent downstream expression programs within key cancer genes

Michal R Grzadkowski et al. BMC Bioinformatics. .

Abstract

Background: Genes implicated in tumorigenesis often exhibit diverse sets of genomic variants in the tumor cohorts within which they are frequently mutated. For many genes, neither the transcriptomic effects of these variants nor their relationship to one another in cancer processes have been well-characterized. We sought to identify the downstream expression effects of these mutations and to determine whether this heterogeneity at the genomic level is reflected in a corresponding heterogeneity at the transcriptomic level.

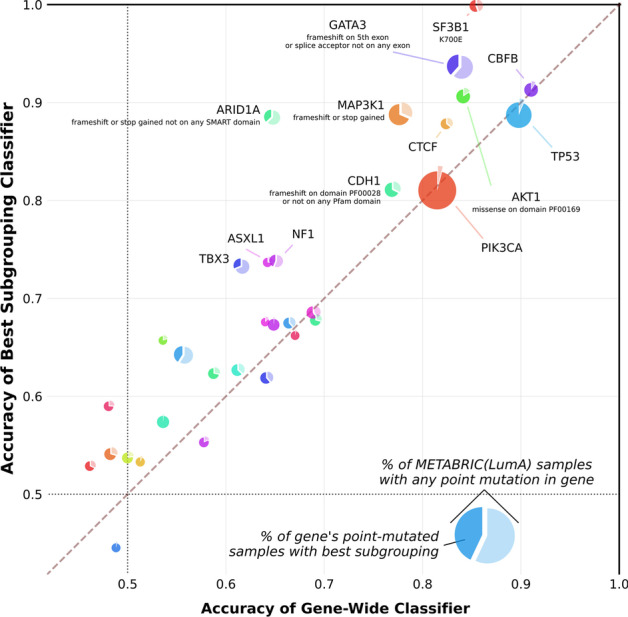
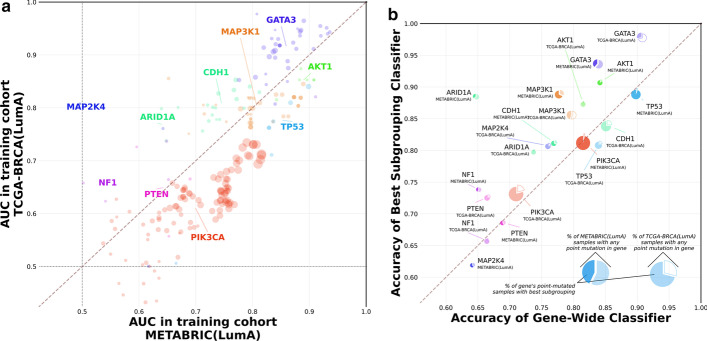
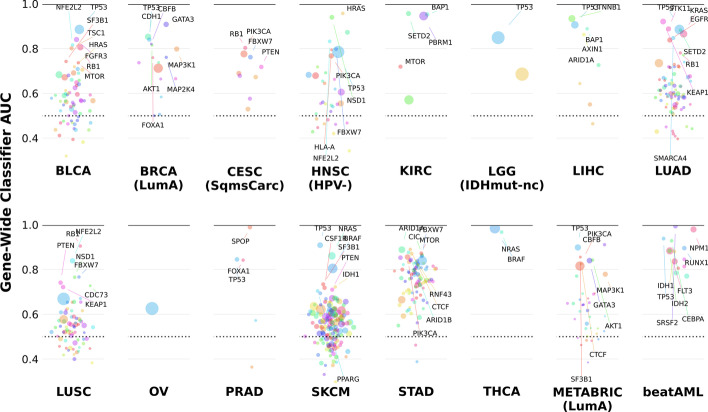
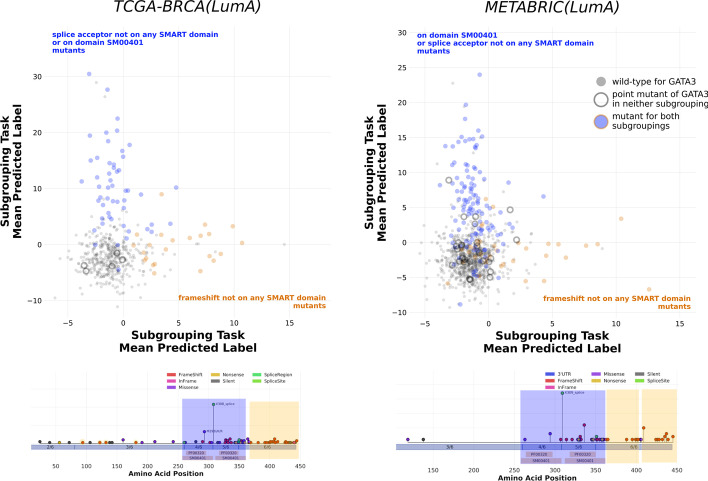
Results: By applying a novel hierarchical framework for organizing the mutations present in a cohort along with machine learning pipelines trained on samples' expression profiles we systematically interrogated the signatures associated with combinations of mutations recurrent in cancer. This allowed us to catalogue the mutations with discernible downstream expression effects across a number of tumor cohorts as well as to uncover and characterize over a hundred cases where subsets of a gene's mutations are clearly divergent in their function from the remaining mutations of the gene. These findings successfully replicated across a number of disease contexts and were found to have clear implications for the delineation of cancer processes and for clinical decisions.

Conclusions: The results of cataloguing the downstream effects of mutation subgroupings across cancer cohorts underline the importance of incorporating the diversity present within oncogenes in models designed to capture the downstream effects of their mutations.

Keywords: Cancer; Drug response; Genomic variants; Machine learning; Transcriptomics.


Conflict of interest statement

The authors declare that they have no competing interests.

Figures

Fig. 1
Fig. 1
Divergent transcriptomic programs are a recurring feature of frequently mutated genes in breast cancer. 772 subgroupings within the point mutations of 38 genes having known links to cancer processes in METABRIC-(LumA) were enumerated by grouping together variants with shared properties. A logistic ridge regression classifier was trained to predict the presence of any point mutation in each of these genes as well as the presence of each enumerated subgrouping. Comparing the classification performance (AUC) for each gene-wide task (x-axis) to the best performance across all tested subgroupings of the gene (y-axis) reveals subgroupings within genes such as GATA3 and MAP3K1 with downstream effects that are consistently separable from the remaining mutations of the gene. The pie charts’ areas are proportional to the number of samples in the cohort that carry any point mutation of the corresponding gene; the darker slice inside each pie is scaled according to the proportion of these samples carrying a mutation in the best subgrouping. A gene label is included wherever the AUC of the best task exceeded 0.7; a description of the best subgrouping is also included wherever its task performance was cv-significantly higher than that of its gene-wide counterpart. Six genes in which no subgroupings were found have been omitted from this plot. The corresponding plots for the other cohorts used for training in this study can be found at Additional file 12: Figure S11
Fig. 2
Fig. 2
Subgrouping performance is consistent across breast cancer cohorts. Cancer gene subgrouping enumeration and classification was repeated using the luminal A sub-cohort of TCGA-BRCA. The colors for genes’ plotted points and pie charts correspond to those in Fig. 1. a Prediction AUCs for gene-wide classification tasks and subgrouping tasks enumerated in both METABRIC-(LumA) (x-axis) and TCGA-BRCA(LumA) (y-axis). Larger point size indicates a higher joint proportion of mutated samples (calculated as the geometric mean of the two cohort proportions). b Comparison of relative subgrouping performance (AUC) between cancer genes profiled in TCGA-BRCA(LumA) (filled-in pie charts) versus those profiled in METABRIC(LumA) (hollow pie charts)
Fig. 3
Fig. 3
Many cancer genes’ point mutations have identifiable expression signatures. Our experiment attempted to predict the point mutations of a total of 200 cancer genes across 15 TCGA tumor cohorts as well as METABRIC and Beat AML using transcriptomic profiles. Shown are the AUCs for all 612 of these gene-wide tasks, with particularly well-performing classifiers highlighted. Point size corresponds to number of point-mutated samples in the given cohort
Fig. 4
Fig. 4
GATA3 downstream effects can be decomposed into two orthogonal axes. Amongst the divergent subgroupings enumerated for GATA3 in our breast cancer cohorts, we found a pair of non-overlapping subgroupings that produced mutation scores with no correlation with one another in both METABRIC(LumA) and TCGA-BRCA(LumA). Each cohort sample is represented by a point, with samples shaded according to whether they carried a mutation in one of the subgroupings, neither, or in both as indicated by the figure labels and legend
Fig. 5
Fig. 5
Using subgroupings improves concordance with clinically relevant phenotypes. We applied our trained classifiers to the CCLE cohort and computed the Spearman correlations between the scores returned by the classifiers and drug response for 265 compounds with AUC50s measured in at least 100 cell lines which also had expression calls available. For NFE2L2 in TCGA-LUSC and GATA3 in METABRIC(LumA) we compared these correlations for the gene-wide classifier and the classifier of the best found subgrouping. Points correspond to individual drugs, with the area of each point proportional to the number of cell lines for which AUC50s were available for the given drug. Correlations were multiplied by -1, and thus higher correlations correspond to stronger association with increased sensitivity of the cell lines to the compound in question. Labels have been added for drugs with Spearman rank-order test p values of less than 0.001 for the subgrouping correlation but greater than 0.001 for the gene-wide correlation

References

    1. Hanahan D, Weinberg RA. The hallmarks of cancer. Cell. 2000;100(1):57–70. doi: 10.1016/S0092-8674(00)81683-9. - DOI - PubMed
    1. Polyak K. Heterogeneity in breast cancer. J Clin Invest. 2011;121(10):3786–8. doi: 10.1172/JCI60534. - DOI - PMC - PubMed
    1. Collisson EA, Sadanandam A, Olson P, Gibb WJ, Truitt M, Gu S, et al. Subtypes of pancreatic ductal adenocarcinoma and their differing responses to therapy. Nat Med. 2011;17(4):500–3. doi: 10.1038/nm.2344. - DOI - PMC - PubMed
    1. Sadanandam A, Lyssiotis CA, Homicsko K, Collisson EA, Gibb WJ, Wullschleger S, et al. A colorectal cancer classification system that associates cellular phenotype and responses to therapy. Nat Med. 2013;19(5):619–25. doi: 10.1038/nm.3175. - DOI - PMC - PubMed
    1. Schram AM, Hyman DM. Quantifying the benefits of genome-driven oncology. Cancer Discov. 2017;7(6):552–4. doi: 10.1158/2159-8290.CD-17-0380. - DOI - PMC - PubMed