

Emulating causal dose-response relations between air pollutants and mortality in the Medicare population
- PMID: 33957920
- PMCID: PMC8103595
- DOI: 10.1186/s12940-021-00742-x
Emulating causal dose-response relations between air pollutants and mortality in the Medicare population
Abstract
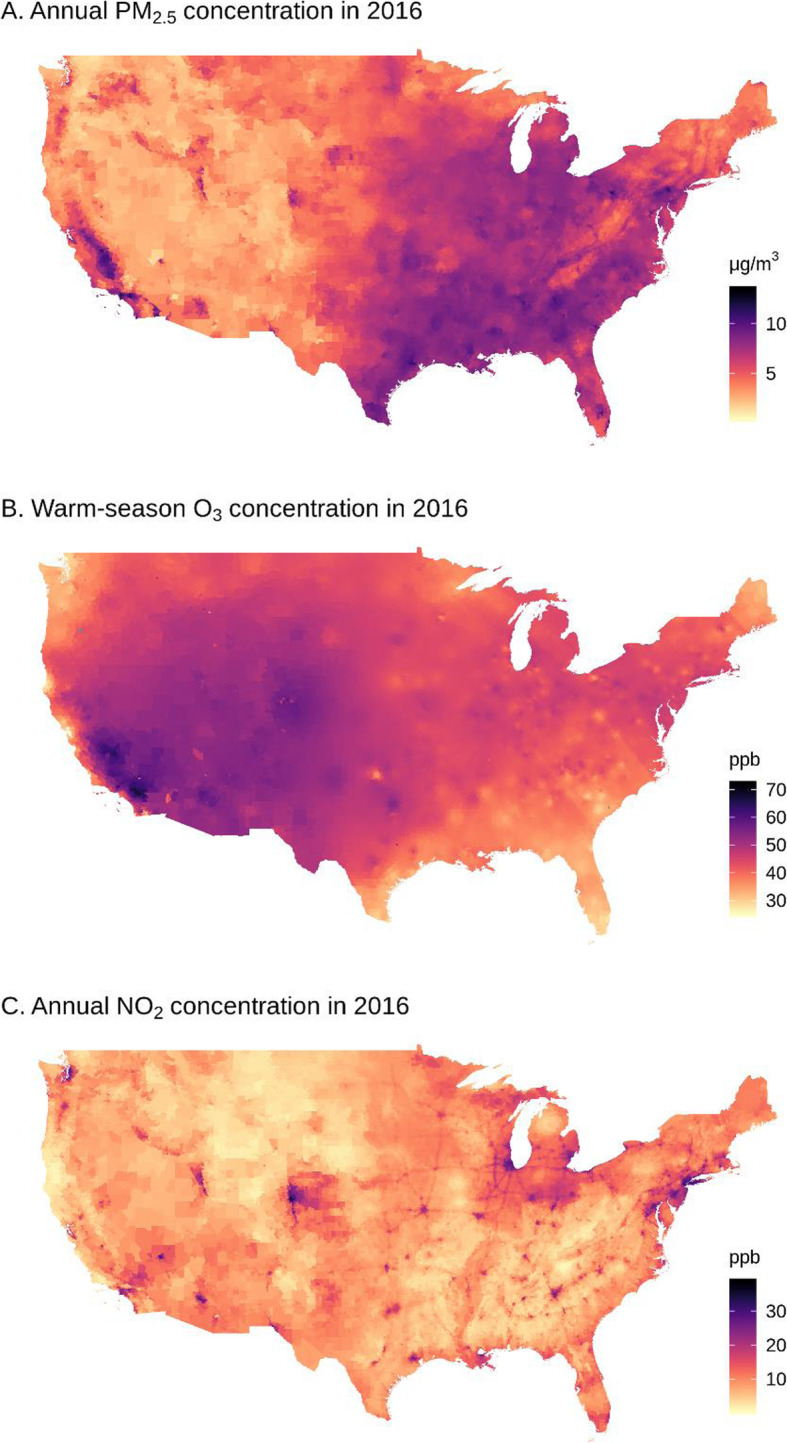
Background: Fine particulate matter (PM2.5), ozone (O3), and nitrogen dioxide (NO2) are major air pollutants that pose considerable threats to human health. However, what has been mostly missing in air pollution epidemiology is causal dose-response (D-R) relations between those exposures and mortality. Such causal D-R relations can provide profound implications in predicting health impact at a target level of air pollution concentration.
Methods: Using national Medicare cohort during 2000-2016, we simultaneously emulated causal D-R relations between chronic exposures to fine particulate matter (PM2.5), ozone (O3), and nitrogen dioxide (NO2) and all-cause mortality. To relax the contentious assumptions of inverse probability weighting for continuous exposures, including distributional form of the exposure and heteroscedasticity, we proposed a decile binning approach which divided each exposure into ten equal-sized groups by deciles, treated the lowest decile group as reference, and estimated the effects for the other groups. Binning continuous exposures also makes the inverse probability weights robust against outliers.
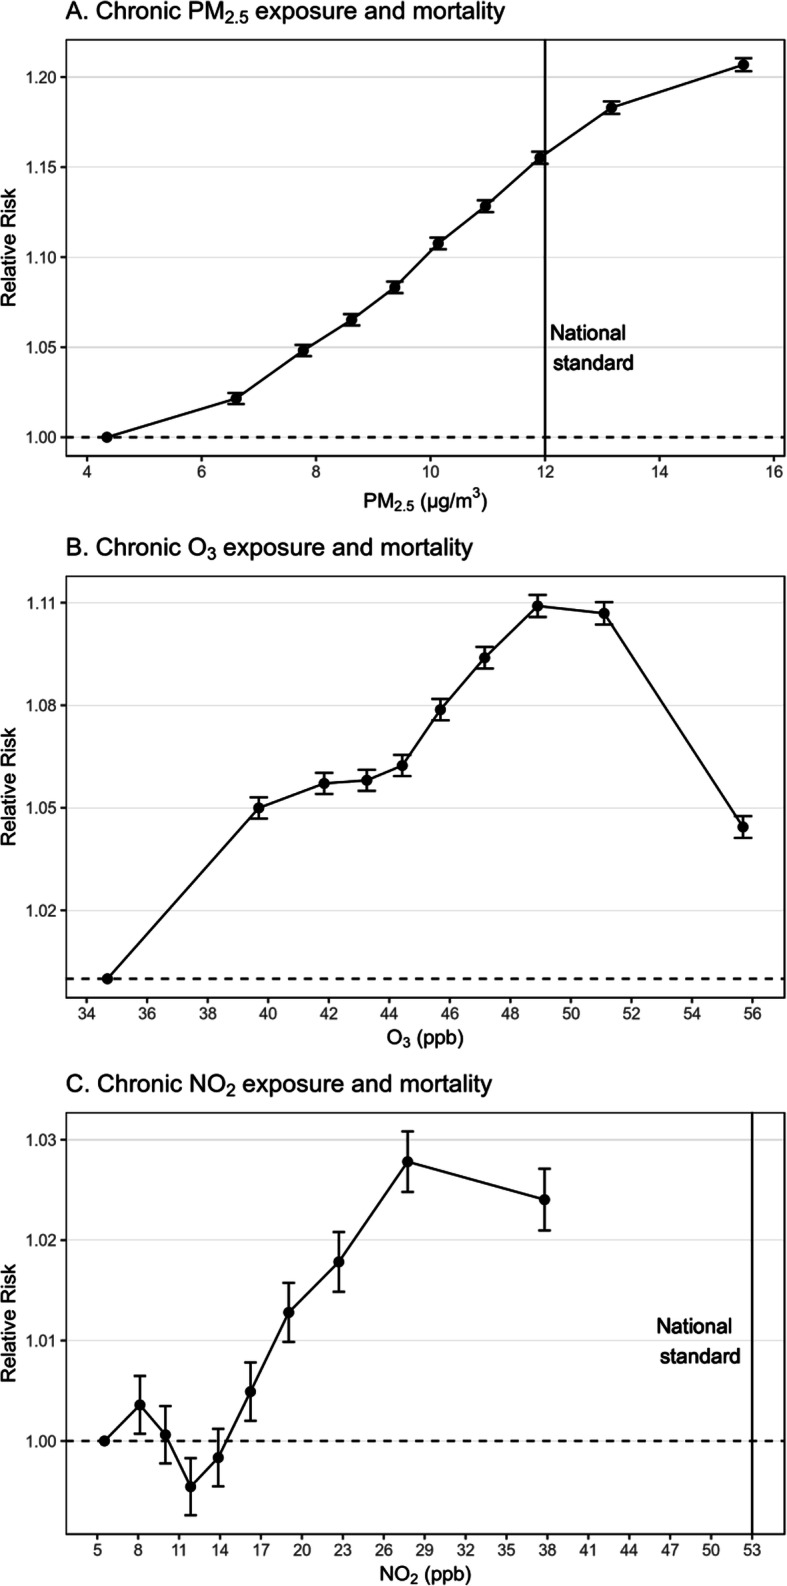
Results: Assuming the causal framework was valid, we found that higher levels of PM2.5, O3, and NO2 were causally associated with greater risk of mortality and that PM2.5 posed the greatest risk. For PM2.5, the relative risk (RR) of mortality monotonically increased from the 2nd (RR, 1.022; 95% confidence interval [CI], 1.018-1.025) to the 10th decile group (RR, 1.207; 95% CI, 1.203-1.210); for O3, the RR increased from the 2nd (RR, 1.050; 95% CI, 1.047-1.053) to the 9th decile group (RR, 1.107; 95% CI, 1.104-1.110); for NO2, the DR curve wiggled at low levels and started rising from the 6th (RR, 1.005; 95% CI, 1.002-1.018) till the highest decile group (RR, 1.024; 95% CI, 1.021-1.027).
Conclusions: This study provided more robust evidence of the causal relations between air pollution exposures and mortality. The emulated causal D-R relations provided significant implications for reviewing the national air quality standards, as they inferred the number of potential early deaths prevented if air pollutants were reduced to specific levels; for example, lowering each air pollutant concentration from the 70th to 60th percentiles would prevent 65,935 early deaths per year.
Keywords: Air pollution; Causal modeling; Chronic exposures; Does-response relations; Mortality.
Conflict of interest statement
Dr. Joel Schwartz serves as an expert witness for the United States Department of Justice in a case involving a Clean Air Act violation.
Figures
References
-
- Schraufnagel DE, Balmes JR, Cowl CT, De Matteis S, Jung SH, Mortimer K, et al. Air pollution and noncommunicable diseases: a review by the forum of international respiratory Societies’ environmental committee, part 2: air pollution and organ systems. Chest. 2019;155(2):417–426. doi: 10.1016/j.chest.2018.10.041. - DOI - PMC - PubMed
-
- Brook RD, Rajagopalan S, Pope CA, 3rd, Brook JR, Bhatnagar A, Diez-Roux AV, et al. Particulate matter air pollution and cardiovascular disease: an update to the scientific statement from the American Heart Association. Circulation. 2010;121(21):2331–2378. doi: 10.1161/CIR.0b013e3181dbece1. - DOI - PubMed
Publication types
MeSH terms
Substances
Associated data
Grants and funding
LinkOut - more resources
Full Text Sources
Other Literature Sources
Medical
