. 2021 May 6;19(1):95.
doi: 10.1186/s12915-021-01030-3.

TORC1 regulates the transcriptional response to glucose and developmental cycle via the Tap42-Sit4-Rrd1/2 pathway in Saccharomyces cerevisiae

Affiliations

TORC1 regulates the transcriptional response to glucose and developmental cycle via the Tap42-Sit4-Rrd1/2 pathway in Saccharomyces cerevisiae

Mohammad Alfatah et al. BMC Biol. .

Abstract

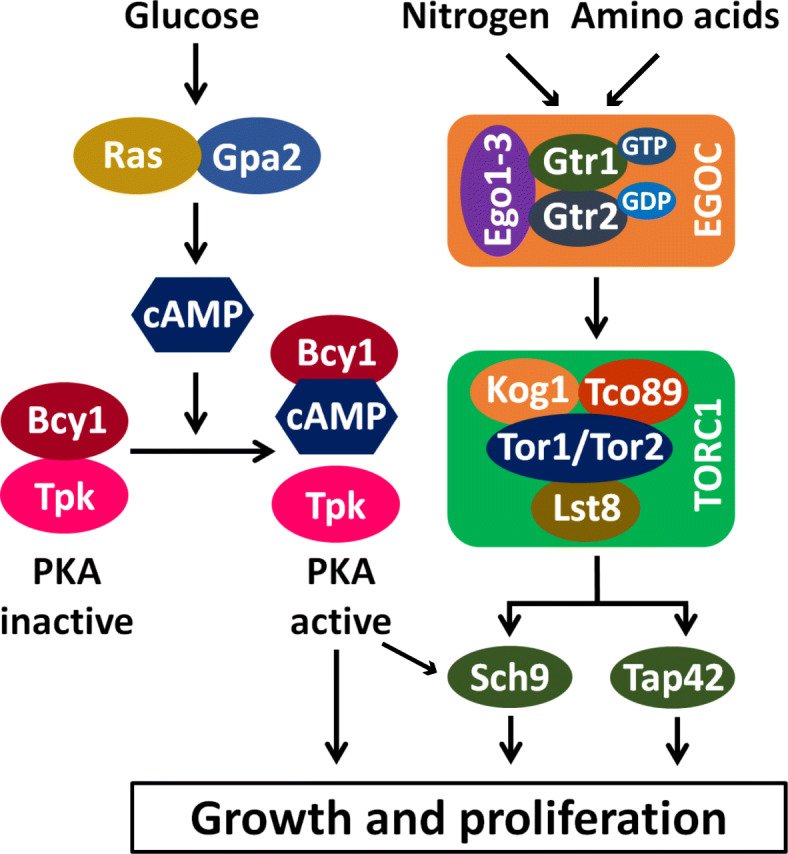
Background: Target of Rapamycin Complex 1 (TORC1) is a highly conserved eukaryotic protein complex that couples the presence of growth factors and nutrients in the environment with cellular proliferation. TORC1 is primarily implicated in linking amino acid levels with cellular growth in yeast and mammals. Although glucose deprivation has been shown to cause TORC1 inactivation in yeast, the precise role of TORC1 in glucose signaling and the underlying mechanisms remain unclear.

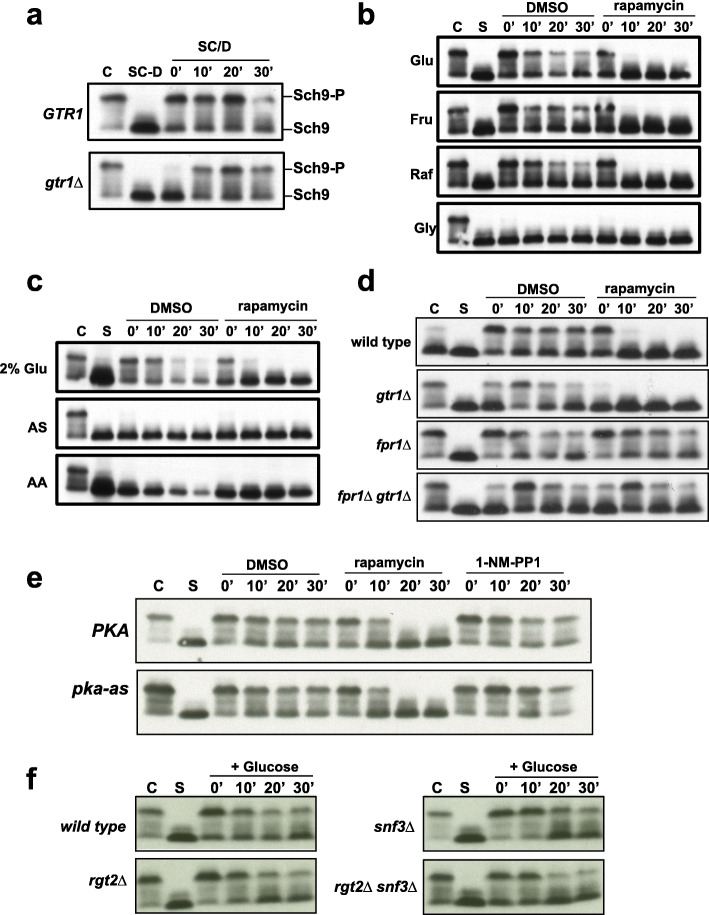
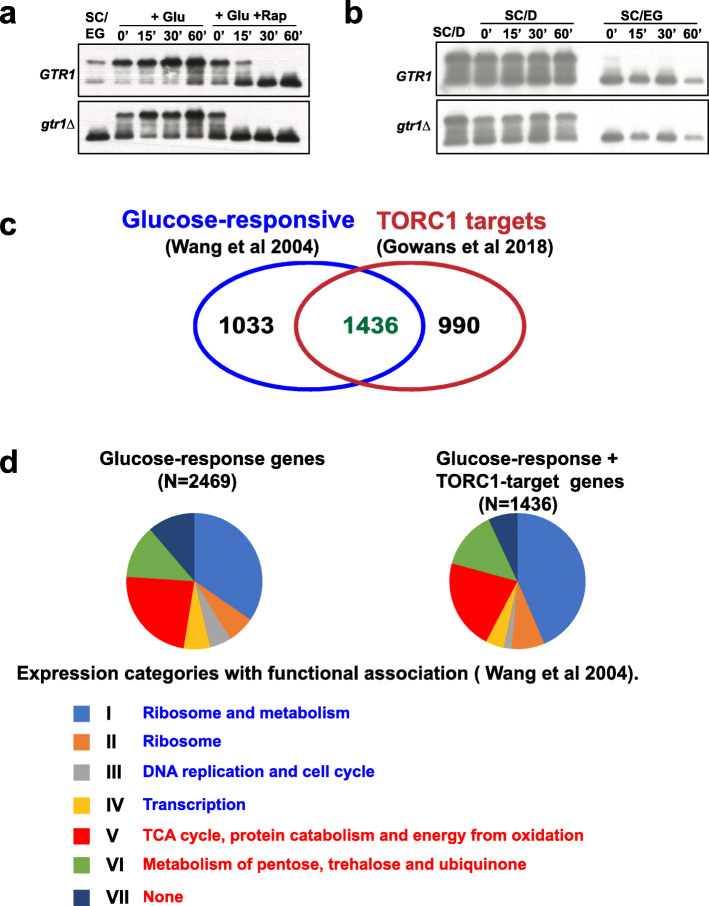
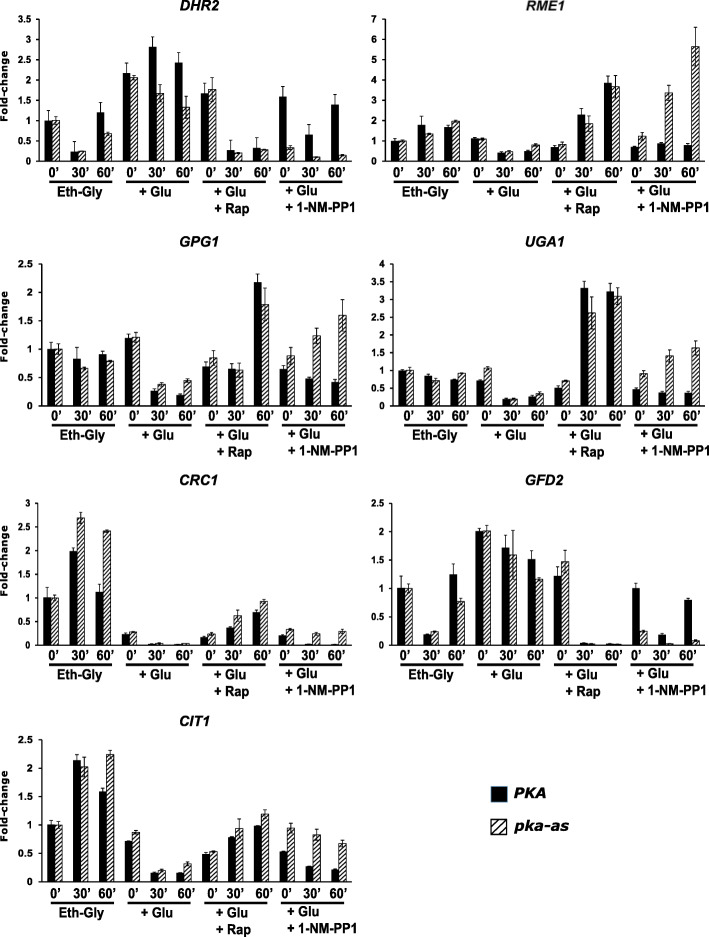
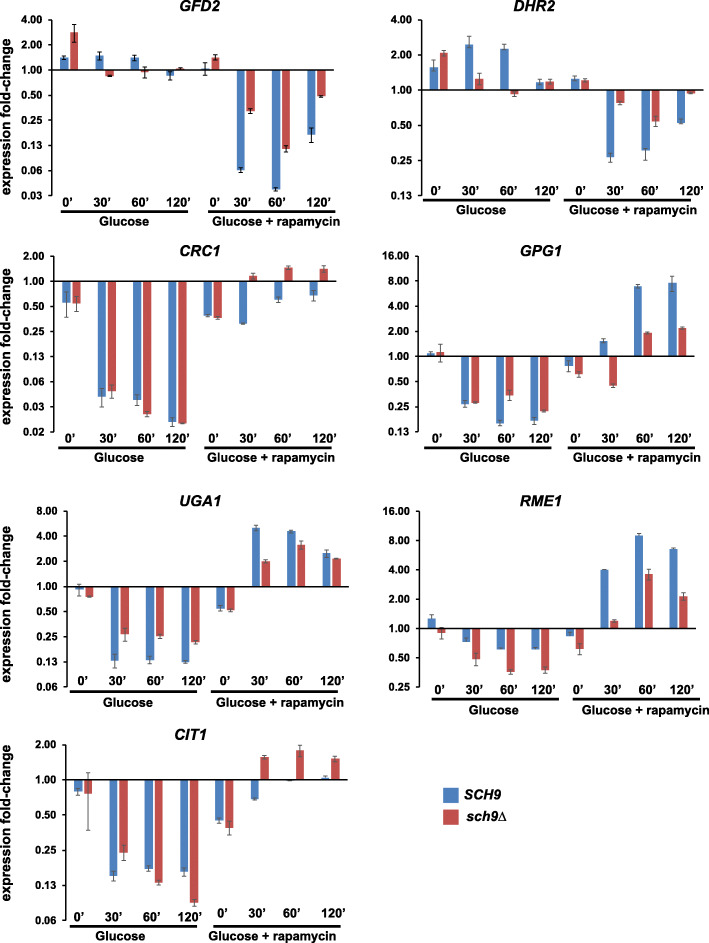
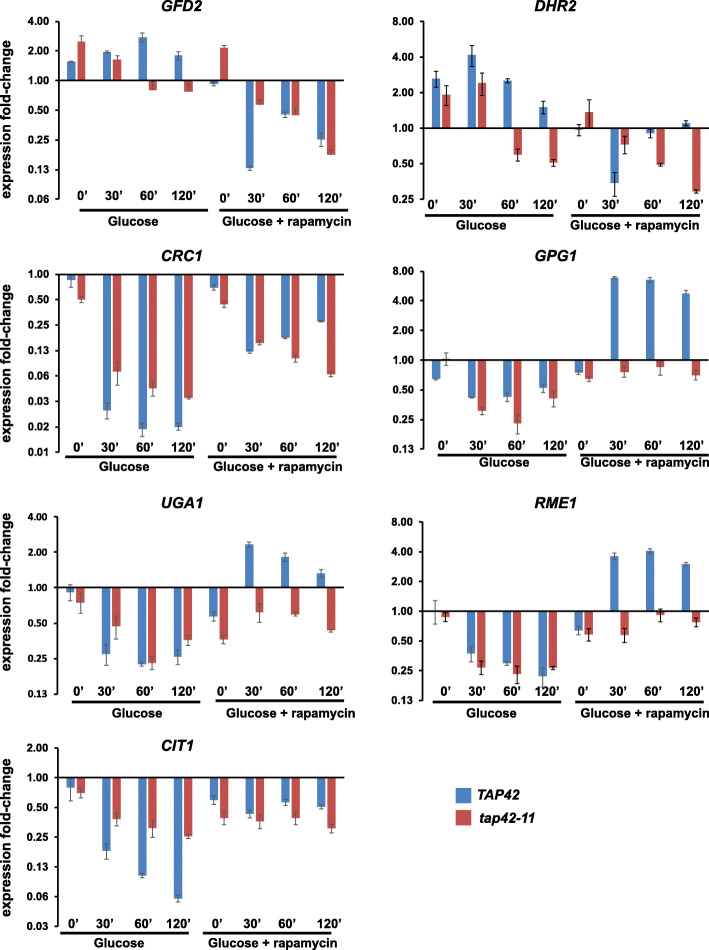
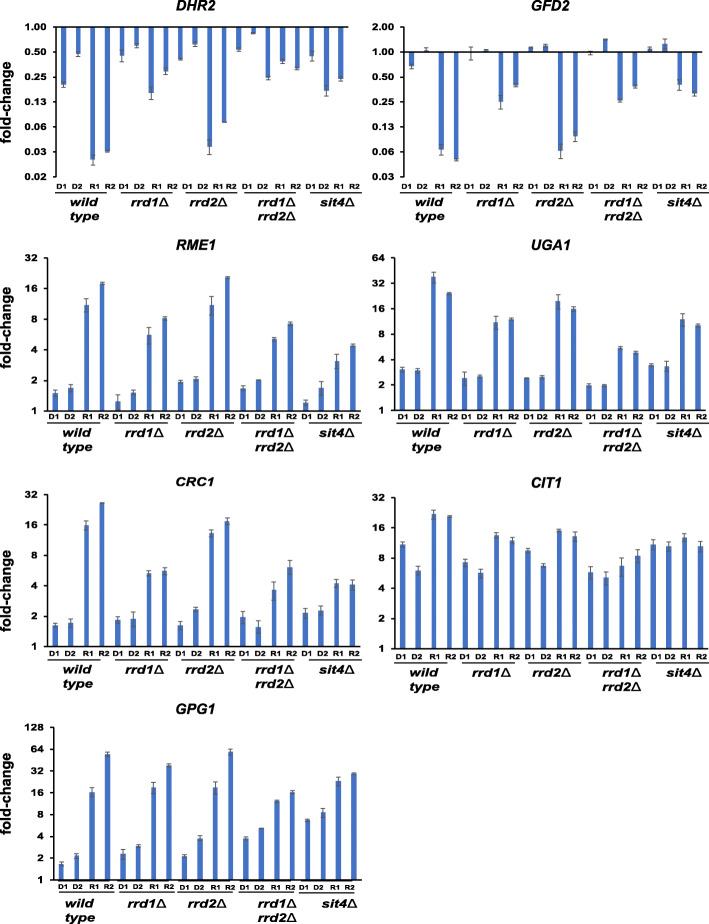
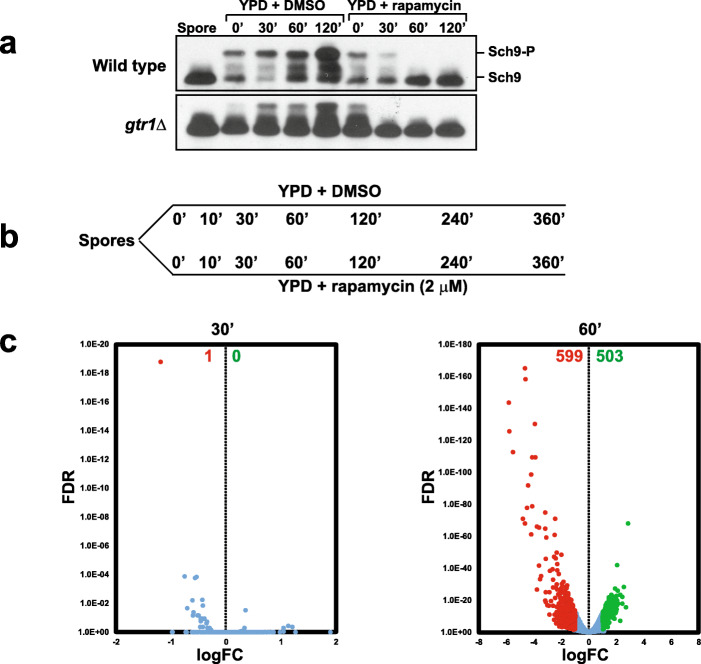
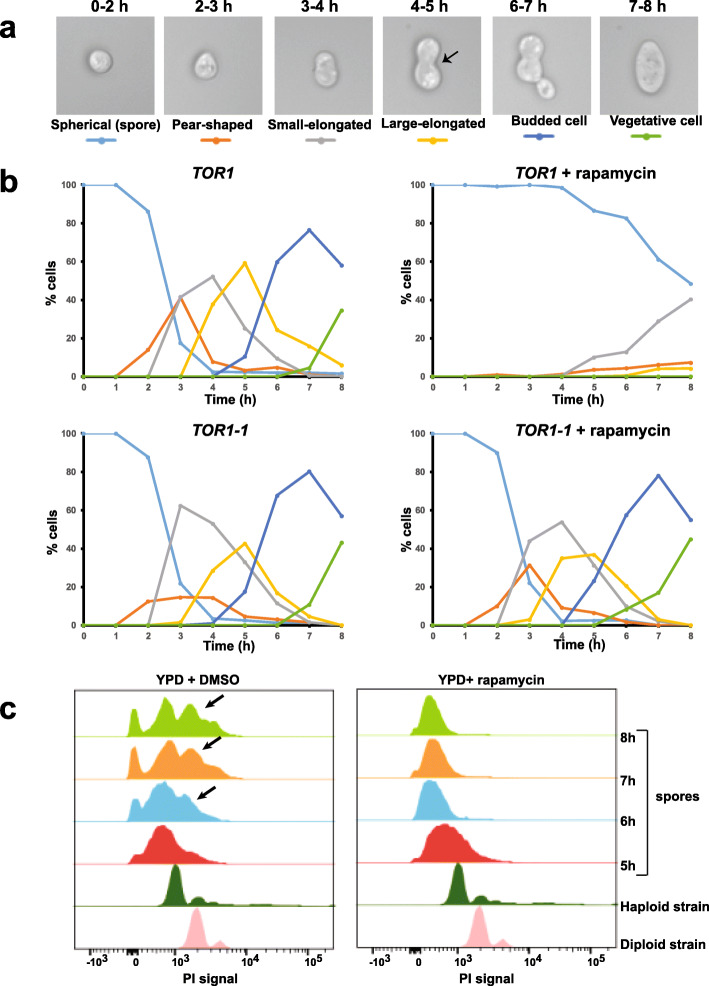
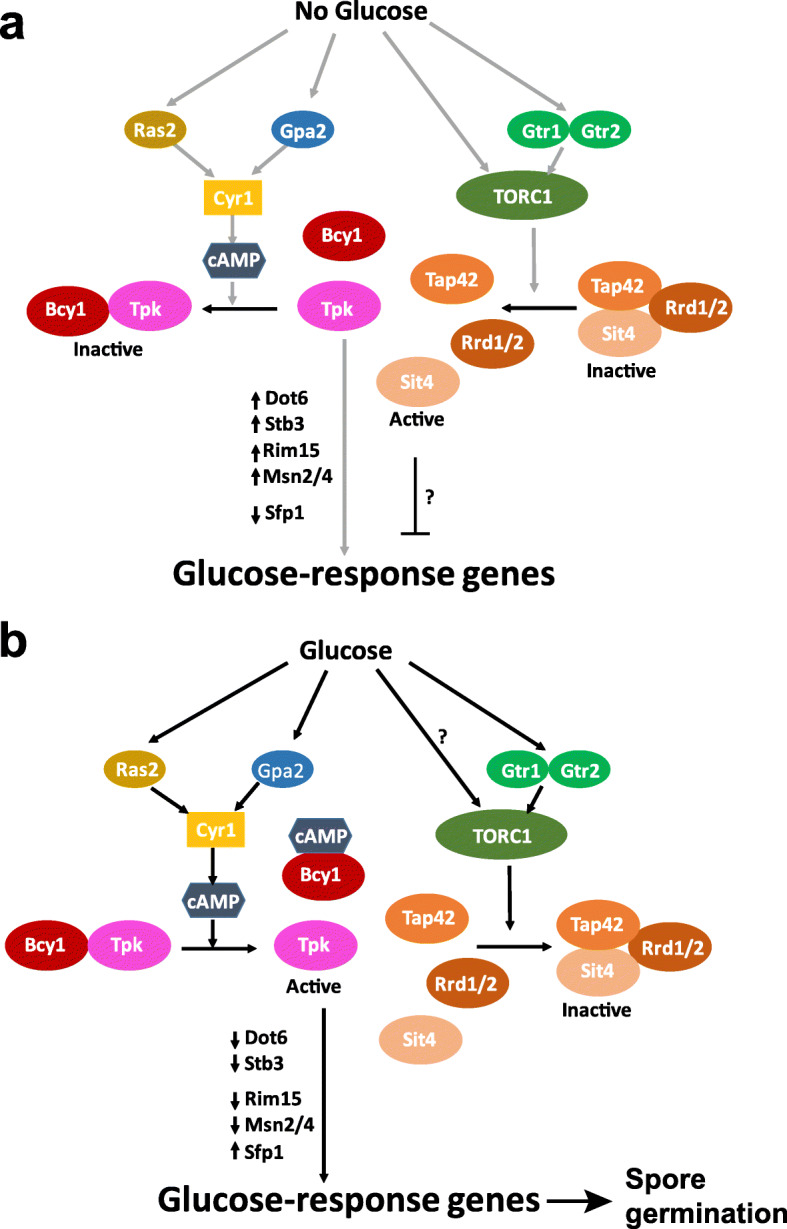
Results: We demonstrate that the presence of glucose in the growth medium is both necessary and sufficient for TORC1 activation. TORC1 activity increases upon addition of glucose to yeast cells growing in a non-fermentable carbon source. Conversely, shifting yeast cells from glucose to a non-fermentable carbon source reduces TORC1 activity. Analysis of transcriptomic data revealed that glucose and TORC1 co-regulate about 27% (1668/6004) of yeast genes. We demonstrate that TORC1 orchestrates the expression of glucose-responsive genes mainly via the Tap42-Sit4-Rrd1/2 pathway. To confirm TORC1's function in glucose signaling, we tested its role in spore germination, a glucose-dependent developmental state transition in yeast. TORC1 regulates the glucose-responsive genes during spore germination and inhibition of TORC1 blocks spore germination.

Conclusions: Our studies indicate that a regulatory loop that involves activation of TORC1 by glucose and regulation of glucose-responsive genes by TORC1, mediates nutritional control of growth and development in yeast.

Keywords: Spore germination; TORC1; Tap42/Sit4/Rrd1-2 module; Transcriptional response to glucose.


Conflict of interest statement

The authors declare that they have no competing interests.

Figures

Fig. 1
Fig. 1
PKA and TORC1 connect the presence of glucose and amino acids/nitrogen levels respectively with cell proliferation in yeast. See the introduction for details
Fig. 2
Fig. 2
Presence of glucose in the medium is necessary and sufficient for TORC1 activation. a Log-phase wild type and gtr1Δ cells (C) grown in synthetic medium with 2% glucose (SC/D) were transferred into synthetic medium lacking glucose (SC-D) and incubated for 1 h. Glucose-starved cells (SC-D) were then transferred back into SC medium (SC/D). Aliquots of the yeast cultures were taken after 0’, 10’, 20’, and 30’ and used for preparing protein extracts. Phosphorylation of Sch9 was monitored by Western blotting. b Wild type cells in logarithmic phase (C) were subjected to complete nutrient starvation by incubating them in 0.3 M sorbitol for 1 h. Starved cells (S) were then transferred to a solution containing either 110 mM glucose or 110 mM fructose, or 110 mM raffinose or 110 mM glycerol in the presence and absence of rapamycin (2 μM). Aliquots of the cultures were taken after 0’, 10’, 20’, and 30’ and used for preparing protein extracts. Phosphorylation of Sch9 was monitored by Western blotting. c Wild type cells in logarithmic phase (C) were subjected to complete nutrient starvation by incubating them in 0.3 M sorbitol for 1 h. Starved cells (S) were then transferred to a solution containing either 110 mM glucose or ammonium sulfate or amino acid mixture in the presence and absence of rapamycin (2 μM). Aliquots of the cultures were taken after 0’, 10’, 20’, and 30’ and used for preparing protein extracts. Phosphorylation of Sch9 was monitored by Western blotting. d Wild type, gtr1Δ, fpr1Δ, and fpr1Δ gtr1Δ cells in log phase were subjected to complete nutrient starvation by incubating them in 0.3 M sorbitol for 1 h. They were then transferred to a 2% glucose solution in the presence and absence of rapamycin (2 μM). Aliquots of the cultures were taken after 0’, 10’, 20’, and 30’ and used for preparing protein extracts. Phosphorylation of Sch9 was monitored by Western blotting. e Wild type and pka-as cells subjected to complete nutrient starvation were transferred to 2% glucose solution in the presence of either DMSO or rapamycin (2 μM) or 1-NM-PP1 (1.5 μM). Aliquots of the cultures were taken after 0’, 10’, 20’, and 30’ and used for preparing protein extracts. Phosphorylation of Sch9 was monitored by Western blotting. f Wild type, rgt2Δ, snf3 Δ, and rgt2Δ snf3Δ cells subjected to complete starvation were transferred to 2% glucose solution. Aliquots of the cultures were taken after 0’, 10’, 20’, and 30’ and used for preparing protein extracts. Phosphorylation of Sch9 was monitored by Western blotting
Fig. 3
Fig. 3
TORC1 activity increases during glucose response. a Wild type and gtr1Δ cells were grown to logarithmic phase in SC/EG medium, and then glucose (2% final concentration) was added to the cultures in the presence of either DMSO or rapamycin (200 nM). Aliquots of the cultures were taken after 0’, 15’, 30’, and 60’ and used for preparing protein extracts. Phosphorylation of Sch9 was monitored by Western blotting. b Wild type and gtr1Δ cells were grown to logarithmic phase in SC/D medium. Cultures were then divided into two parts. For one part, cells were pelleted and washed thrice with SC/EG medium, resuspended in SC/EG medium, and incubated at 30 °C. The second part was transferred back to SC/D and was also incubated at 30 °C. Aliquots of the cultures were taken after 0’, 15’, 30’, and 60’ and used for preparing protein extracts. Phosphorylation of Sch9 was monitored by Western blotting. c Venn diagram showing the overlap of glucose-responsive genes [4] with TORC1 target genes [9]. d Pie chart shows the distribution of the glucose-responsive genes and TORC1-glucose co-regulated (TGC) genes among the various gene clusters defined by response to glucose and Ras activation [4]. Functional enrichment among the various clusters induced and repressed by glucose are indicated, in blue and red fonts respectively
Fig. 4
Fig. 4
TORC1 and PKA co-regulate the transcriptional response to glucose. Wild type (PKA) and pka-as cells were grown to logarithmic phase were grown to logarithmic phase in SC/EG medium and then glucose (2% final concentration) was added in the presence of either rapamycin (200 nM) or 1-NM-PP1 (1.5 μM) or DMSO. Aliquots of the cultures were taken after 0, 30’, and 60’. RNA was extracted from the cultures, and the expression of the indicated 7 TGC genes were analyzed by real-time qRT-PCR. Data are presented as means ± standard deviation (n = 2 technical replicates). Data from two additional biological replicates of this experiment are presented in Fig. S3
Fig. 5
Fig. 5
TORC1 regulates the expression of glucose-responsive genes independently of Sch9. Wild type and sch9Δ cells were grown to logarithmic phase in SC/EG medium and then glucose (2% final concentration) was added to the cultures in the presence of either rapamycin (200 nM) or DMSO. Aliquots of the cultures were taken after 0’, 30’, 60’, and 120’. RNA was extracted from the cultures and the expression of the indicated 7 TGC genes (GFD2, GPG1, UGA1, RME1, CIT1, CRC1, and DHR2) were analyzed by real-time qRT-PCR. Data are presented as means ± standard deviation (n = 2 technical replicates). Data from two additional biological replicates of this experiment are presented in Fig. S7
Fig. 6
Fig. 6
Regulation of glucose-responsive genes by TORC1 is dependent on Tap42. Wild type or tap42-11 cells were grown to logarithmic phase at 25 °C (permissive temperature) in SC/EG medium and then shifted to 37 °C for 30’ to inactivate tap42-11. Glucose (2% final concentration) was added to the cultures in the presence of either rapamycin (200 nM) or DMSO. Aliquots of the cultures were taken after 0’, 30’, 60’, and 120’. RNA was extracted from the cultures and the expression of the 7 TGC genes (GFD2, GPG1, UGA1, RME1, CIT1, CRC1, and DHR2) were analyzed by real-time qRT-PCR. Data are presented as means ± standard deviation (n = 2 technical replicates). Data from two additional biological replicates of this experiment are presented in Fig. S9
Fig. 7
Fig. 7
TORC1 regulates the glucose-responsive genes via Sit4 and Rrd1/Rrd2 proteins. Wild type, sit4Δ, rrd1Δ, rrd2Δ, and rrd1Δ rrd2Δ cells were grown to logarithmic phase in YPD medium and then treated with either rapamycin (200 nM) or DMSO. Aliquots of the cultures were taken after 0’, 30’, and 60’. RNA was extracted from the cultures, and the expression of the indicated 7 TGC genes was analyzed by real-time qRT-PCR. D1/R1 and D2/R2 indicate DMSO-treated/rapamycin-treated cells after 30’ and 60’ respectively, and the expression fold-change values were normalized with respect to DMSO-treated cells at t = 0’. Data are presented as means ± standard deviation (n = 2 technical replicates). Data from two additional biological replicates of this experiment are presented in Fig. S10
Fig. 8
Fig. 8
TORC1 regulates transcriptomic changes during spore germination. a Wild type spores and gtr1Δ spores were transferred into YPD medium in the presence of either DMSO or rapamycin (2 μM). Activity of TORC1 was assayed by monitoring Sch9 phosphorylation using an anti-HA antibody. b Experimental outline to analyze the role of TORC1 in spore germination by RNA-Seq. Spores were transferred to YPD medium containing either DMSO or rapamycin (2 μM). Aliquots of yeast cells were taken at the indicated time points (0’ 10’, 30’, 60’, 120’, 240’, and 360’) from the two cultures and used for preparing RNA for RNA-Seq analysis. c Transcriptomes of spores treated with rapamycin (2 μM) after 30’ and 60’ were compared with the transcriptomes of corresponding DMSO-treated spores. logFC (fold-change) was plotted against false discovery rate (FDR). Differentially expressed genes (at least 2-fold difference in comparison to DMSO-treated spores) were identified. Genes positively regulated and negatively regulated by TORC1 are indicated by green and red dots respectively and their numbers are indicated at the top of the plot
Fig. 9
Fig. 9
TORC1 activity is required for spore germination. a Images showing the morphological changes occurring during spore germination along with their corresponding timing of appearance above. A distinct constriction seen in the germinating spores after 4–5 h following transfer to YPD medium is indicated by the black arrowhead. b Wild type and TOR1-1 spores were transferred into YPD medium in the presence of either DMSO or rapamycin (2 μM). Progress of spore germination was assayed by scoring fraction of cells with different morphologies at the indicated time points for 8 h following transfer into YPD medium. c Wild type spores were transferred into nutrient medium in the presence of either DMSO or rapamycin (2 μM). DNA content of germinating spores following 5 h, 6 h, 7 h, and 8 h following transfer to YPD medium was assayed by flow cytometry. Propidium iodide signals of a haploid and diploid strain are indicated for reference
Fig. 10
Fig. 10
Model for regulation of the transcriptional response to glucose by TORC1 and PKA. Based on the literature and our data, we depict how PKA and TORC1 regulate the glucose response. a In the absence of glucose, the PKA and TORC1 pathways are inactive. Bcy1 binds to Tpk1-3 and keeps the protein kinase A inactive. This results in activation of transcriptional repressors Dot6 and Stb3, the protein kinase Rim15 and stress-responsive transcription factors Msn2/Msn4. Sfp1, transcription factor for ribosome biogenesis and protein synthesis genes, is kept inactive. In the absence of TORC1 activity, the PP2A-like protein phosphatase Sit4/Rrd1/2 module dissociates from Tap42 and dephosphorylates unidentified proteins to inhibit the transcriptional response to glucose. b In the presence of glucose, the PKA and TORC1 pathways are activated. Ras2 and Gpa2 activate the adenylate cyclase Cyr1 to produce cAMP which binds to Bcy1 and releases Tpk1-3 from Bcy1’s inhibitory effect. PKA inactivates Dot6, Stb3, Rim15, and Msn2/Msn4 and activates Sfp1. TORC1 is activated by glucose through Gtr1/Gtr2-dependent and Gtr1/Gtr2-independent mechanisms. In the presence of active TORC1, Tap42 binds to Sit4/Rrd1/2 module and keeps it inactive thereby preventing its inhibitory effect on the transcriptional response to glucose. Activation of the transcriptional response to glucose is essential for spore germination

References

    1. Joseph-Strauss D, Zenvirth D, Simchen G, Barkai N. Spore germination in Saccharomyces cerevisiae: global gene expression patterns and cell cycle landmarks. Genome Biol. 2007;8(11):R241. doi: 10.1186/gb-2007-8-11-r241. - DOI - PMC - PubMed
    1. Broach JR. Nutritional control of growth and development in yeast. Genetics. 2012;192(1):73–105. doi: 10.1534/genetics.111.135731. - DOI - PMC - PubMed
    1. Loewith R, Hall MN. Target of rapamycin (TOR) in nutrient signaling and growth control. Genetics. 2011;189(4):1177–1201. doi: 10.1534/genetics.111.133363. - DOI - PMC - PubMed
    1. Wang Y, Pierce M, Schneper L, Guldal CG, Zhang X, Tavazoie S, Broach JR. Ras and Gpa2 mediate one branch of a redundant glucose signaling pathway in yeast. Plos Biol. 2004;2(5):E128. doi: 10.1371/journal.pbio.0020128. - DOI - PMC - PubMed
    1. Zaman S, Lippman SI, Schneper L, Slonim N, Broach JR. Glucose regulates transcription in yeast through a network of signaling pathways. Mol Syst Biol. 2009;5(1):245. doi: 10.1038/msb.2009.2. - DOI - PMC - PubMed

Publication types

MeSH terms

Substances