. 2021 May 6;22(1):138.
doi: 10.1186/s13059-021-02348-5.

Genetic and environmental modulation of transposition shapes the evolutionary potential of Arabidopsis thaliana

Affiliations

Genetic and environmental modulation of transposition shapes the evolutionary potential of Arabidopsis thaliana

Pierre Baduel et al. Genome Biol. .

Abstract

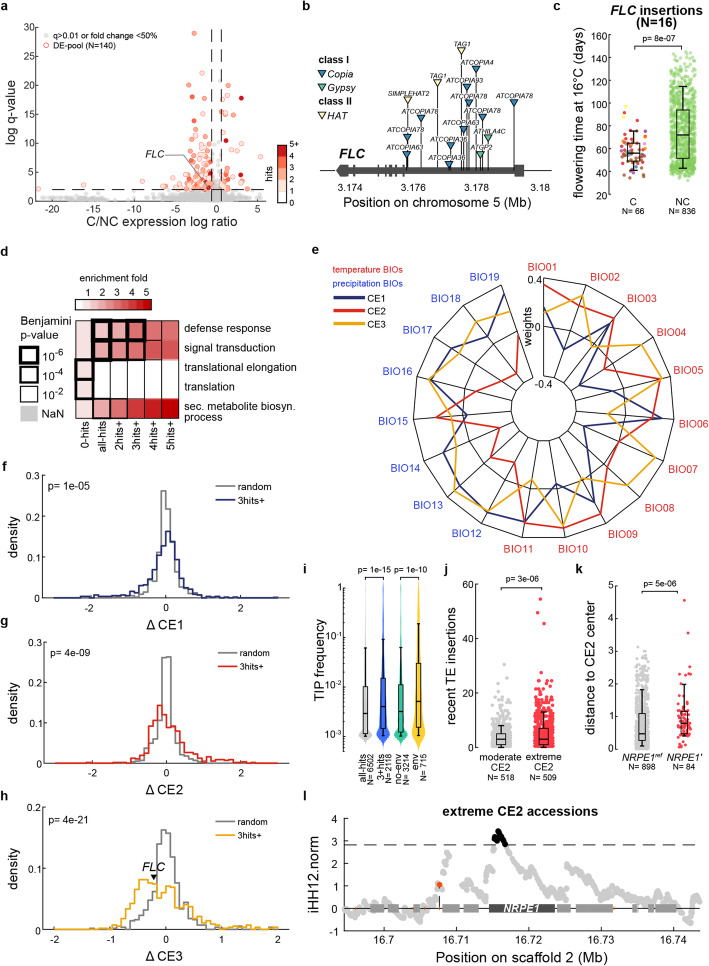
Background: How species can adapt to abrupt environmental changes, particularly in the absence of standing genetic variation, is poorly understood and a pressing question in the face of ongoing climate change. Here we leverage publicly available multi-omic and bio-climatic data for more than 1000 wild Arabidopsis thaliana accessions to determine the rate of transposable element (TE) mobilization and its potential to create adaptive variation in natural settings.

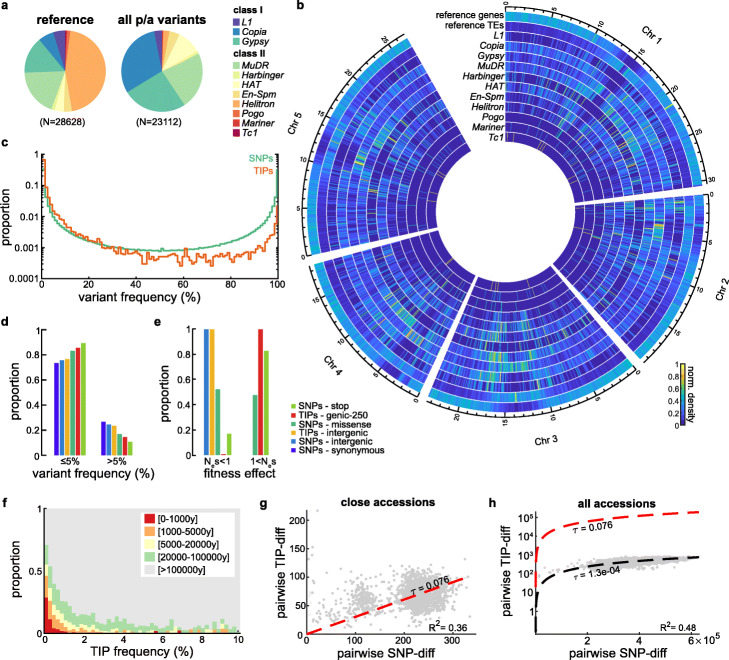
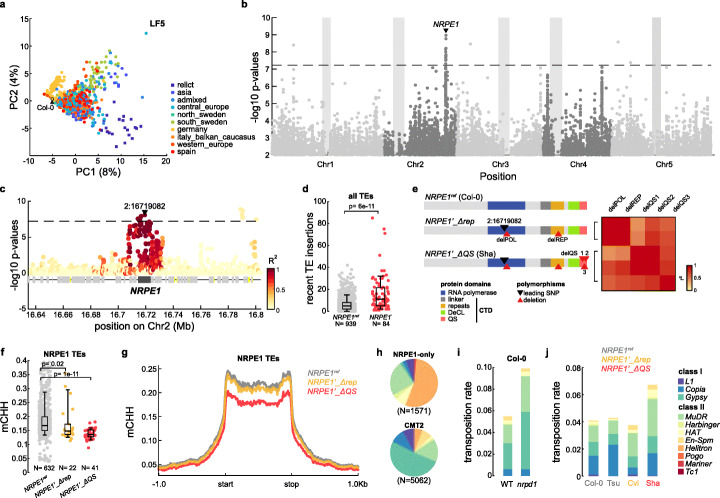
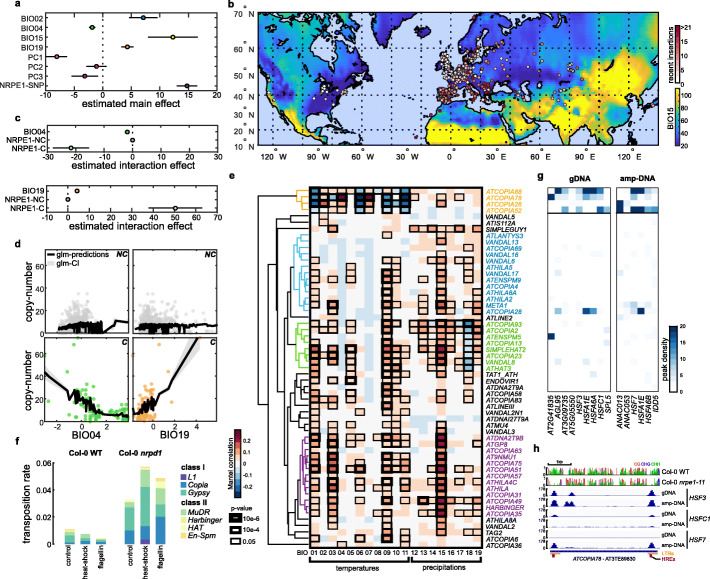
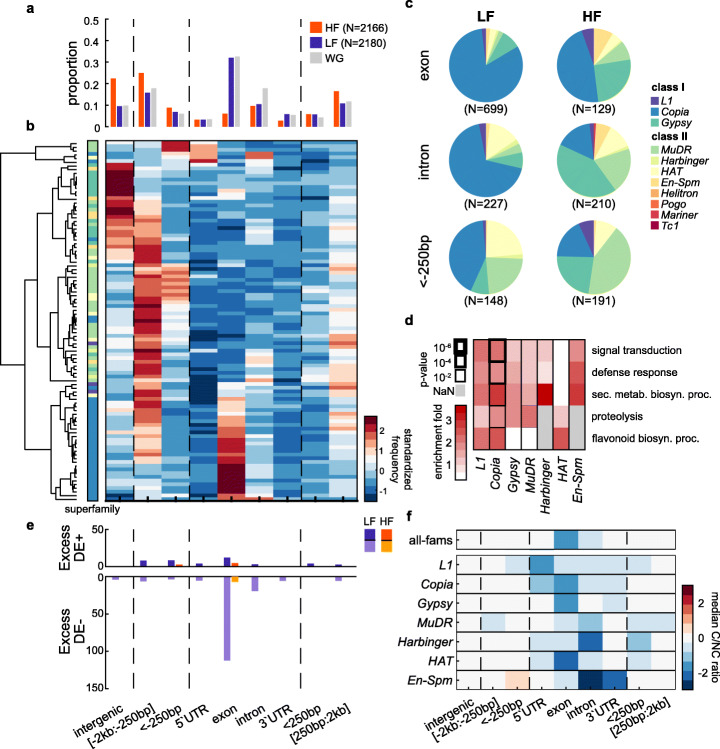
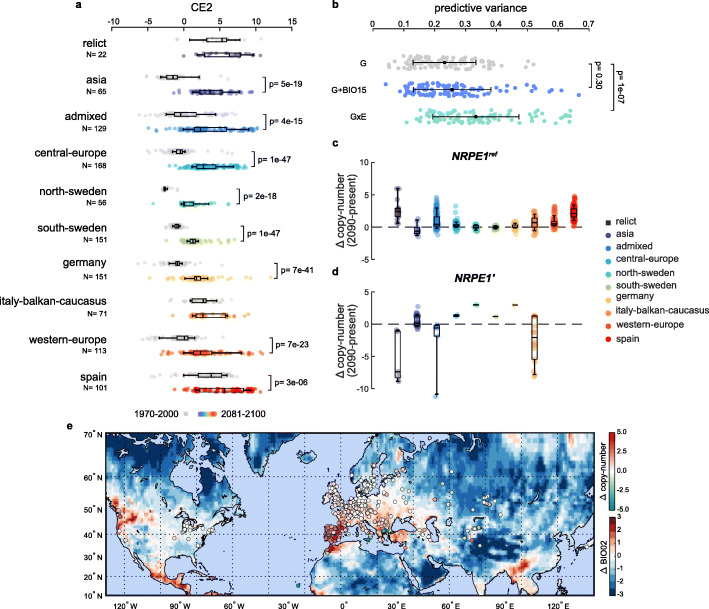
Results: We demonstrate that TE insertions arise at almost the same rate as base substitutions. Mobilization activity of individual TE families varies greatly between accessions, in association with genetic and environmental factors as well as through complex gene-environment interactions. Although the distribution of TE insertions across the genome is ultimately shaped by purifying selection, reflecting their typically strong deleterious effects when located near or within genes, numerous recent TE-containing alleles show signatures of positive selection. Moreover, high rates of transposition appear positively selected at the edge of the species' ecological niche. Based on these findings, we predict through mathematical modeling higher transposition activity in Mediterranean regions within the next decades in response to global warming, which in turn should accelerate the creation of large-effect alleles.

Conclusions: Our study reveals that TE mobilization is a major generator of genetic variation in A. thaliana that is finely modulated by genetic and environmental factors. These findings and modeling indicate that TEs may be essential genomic players in the demise or rescue of native populations in times of climate crises.

Keywords: Adaptation; Climate change; Epigenomics; Genome evolution; Population genetics; Transposable elements.


Conflict of interest statement

The authors declare that they have no competing interests.

Figures

Fig. 1
Fig. 1
Recent TE mobilization at the species level. a Relative proportion of the 11 major TE superfamilies identified in the reference genome (TAIR10) and their respective contribution to TE insertion polymorphisms (TIPs). b Density of TIPs across the genome for each superfamily compared to the distribution of genes or TEs annotated in the reference genome. c Folded frequency spectrum of TIPs and biallelic SNPs. d Proportion of each variant category at frequencies below 5% and above 5%. e Distribution of fitness effects of each variant category as effectively neutral (Nes < 1) and deleterious (1 < Nes). f Frequency distribution of non-private TIPs by local haplotype age. g Pairwise differences in TIPs and SNPs between accessions diverging by < 500 SNPs. Regression line and confidence intervals are indicated in red and gray, respectively. h Pairwise differences in TIPs and SNPs between all accessions. Regression lines between all and closely related accessions are shown in black and red, respectively
Fig. 2
Fig. 2
Genetic basis of variable transposition. a PCA of mobilome composition based on very recent TIPs (MAF lower than 5%). Different genetic groups are indicated in colors. b Manhattan plot of GWAS for very recent genome-wide TE mobilization. Dashed line represents the Bonferroni-corrected threshold for significance. c Detailed Manhattan plot within 80 kb around NRPE1 locus. Colors indicate the extent of linkage disequilibrium (R2) with the leading SNP (black triangle). d Boxplot of numbers of very recent TE insertions in carriers of the reference NRPE1ref and derived NRPE1’ alleles. The p value of a Wilcoxon test between distributions is indicated. e Alleles and polymorphisms at NRPE1 locus and the linkage between their closest tagging SNPs. f, g Boxplot and metaplot of CHH methylation on NRPE1-dependent TEs within carriers of the derived NRPE1’_ΔQS allele, carriers of the derived NRPE1’_Δrep allele, and a set of 100 randomly sampled carriers of the reference NRPE1ref allele. The p values of Wilcoxon tests between distributions are indicated. h Composition by superfamily of NRPE1- or CMT2-targeted TE sequences. i Transposition rates in 1000 offspring of WT and nrpd1 parents of the Col-0 accession grown under standard conditions. j Transposition rates in 1000 offspring of the Cvi-0, Sha, Tsu-0, and Col-0 accessions derived from parents grown under standard conditions
Fig. 3
Fig. 3
Environmental modulation of TE mobilization. a Marginal effect at the mean of each of the variables considered in the GLM of very recent transposition: the first three principal components of the kinship matrix (PC1-2-3), the NRPE1 locus, and the BIO02, BIO04, BIO15, and BIO19 variables. b Number of very recent TE insertions detected across the world and levels of precipitation seasonality (BIO15). c Estimated interaction effect of BIO04 and NRPE1 (upper) and BIO19 and NRPE1 (bottom). d Scatter plot of very recent transposition against BIO04 (left) and BIO19 (right) in non-carriers (NC, up) and carriers (C, down) of the derived NRPE1’ alleles. GLM predictions and confidence intervals are indicated in black and gray, respectively. e Directional Mantel associations for 77 TE families between very recent transposition and 19 WorldClim bio-variables (1970–2000) with dendrogram of hierarchical clustering of coefficient correlations. The four main clusters are indicated (colors). f Transposition rates in 1000 offspring of Col-0 WT and nrpd1 parents grown under standard conditions or exposed to heat-shock or flagellin. g Normalized peak density of in vitro binding of TFs (DAP-seq) enriched over the “temperature” TE cluster in Col-0 gDNA and PCR-amplified DNA. h Tracks of DNA methylation (CG in red, CHG in blue, CHH in green) in Col-0 WT and nrpe1_11 mutants and DAP-seq peaks of heat-shock factors HSF3, HSFC1, and HSF7 in Col-0 gDNA and PCR-amplified DNA. The position of the tandem heat-responsive elements (HREs: nTTCnnGAAn) [31] located in the LTRs are indicated in purple
Fig. 4
Fig. 4
TE mobilization within or near genes predominantly generates deleterious mutations. a Fraction of low- and high-frequency TE presence variants overlapping genic annotations (exons, introns, 5′ or 3′ UTRs) or located near genes (upstream/downstream within 250 bp, or within 2 kb) or intergenic (> 2 kb away from nearest gene) compared to the genomic proportion of each category. b Insertion frequencies across genomic categories for TE families with ≥ 50 TIPs. Rows are standardized and clustered based on correlation distance. c Distribution of low- and high-frequency TE presence variants in exons, introns, and promoter regions (<− 250 bp) for each TE superfamily. d GO enrichments of LF presence variants within genes. e Excess of extreme expression log ratios between carriers (C) and non-carriers (NC) by insertion category at low- and high-frequency (negative = DE- at bottom, and positive = DE+ on top) compared to random sampling of carriers and non-carriers. f Median transcriptomic impact (C/NC expression ratio) by TE family by insertion category
Fig. 5
Fig. 5
Contribution of transposition to local environmental adaptation. a Significance against log-ratio of combined transcriptomic effects of TE insertions within or near (< 250 bp) genes in carrier accessions (C) compared to non-carrier accessions (NC). The number of TE insertions found for each locus is indicated as a shade of red. b Location and identity of the 16 TE insertions detected within FLC. c Flowering time at 16 °C of carrier accessions (C) and non-carrier accessions (NC) of FLC TE-insertions. The p value of Wilcoxon test is indicated. d Top 5 GO enrichment terms across genes never visited or visited once or more. e Weights across 19 bio-variables of 3 first climatic envelopes (CEs) in PCA of 1047 accessions. f–h Distributions of climatic envelope shifts (ΔCEs) observed between carriers and non-carriers of TE insertions for each of the 566 genes hit 3 times or more compared to the distribution of ΔCEs with the same numbers of randomly selected carriers. The p values of Kolmogorov-Smirnov comparisons between observed and random distributions are indicated. i Frequency of TE insertions found within or near genes visited (all-hits), visited 3 times or more (3hits+), in association with a CE shift (env) or not (no-env). The p values of Wilcoxon tests between distributions are indicated. j Boxplot of numbers of very recent TE insertions in extreme or moderate CE2 accessions. The p values of Wilcoxon tests between distributions are indicated. k Boxplot of distance to CE2 center (absolute z-scored CE2) for carriers of the reference NRPE1ref and derived NRPE1’ alleles. The p values of Wilcoxon tests between distributions are indicated. l iHH12 values in extreme CE2 accessions (upper and lower quartiles of CE2.z) across the NRPE1 region with in black indicated values above the genome-wide 1% threshold (dashed line)
Fig. 6
Fig. 6
Increased TE mobilization under future climates. a Forecasted change of climatic envelope CE2 by genetic group under average CMIP6 SSP5–8.5 GCM for 2081–2100 compared to recent climate (1970–2000). b Predictive variance of the numbers of recent copies on 100 random testing sets of 100 accessions for GLMs based on population structure and allelic variation at NRPE1 (G), including BIO15 (G+BIO15), or with interactions between bio-variables and NRPE1 (GxE). c–e Predicted change by genetic group in copy numbers using GxE GLM with future climate predictions for 2081–2100 for c carriers of the reference NRPE1 allele and d carriers of the derived NRPE1’ alleles. e Spatial variations in BIO02 predicted for 2081–2100 and their outcome on copy-number changes by accession

References

    1. Barrett R, Schluter D. Adaptation from standing genetic variation. Trends Ecol Evol. 2008:38–44. 10.1016/j.tree.2007.09.008 - PubMed
    1. Hermisson J, Pennings PS. Soft sweeps. Genetics. 2005:2335–52. 10.1534/genetics.104.036947 - PMC - PubMed
    1. Huang CRL, Burns KH, Boeke JD. Active transposition in genomes. Annu Rev Genet. 2012;46:651–675. doi: 10.1146/annurev-genet-110711-155616. - DOI - PMC - PubMed
    1. Friedli M, Trono D. The developmental control of transposable elements and the evolution of higher species. Annu Rev Cell Dev Biol. 2015;31:429–451. doi: 10.1146/annurev-cellbio-100814-125514. - DOI - PubMed
    1. Wicker T, Sabot F, Hua-Van A, Bennetzen JL, Capy P, Chalhoub B, et al. A unified classification system for eukaryotic transposable elements. Nat Rev Genet. 2007;8:973–982. doi: 10.1038/nrg2165. - DOI - PubMed

Publication types

Substances

LinkOut - more resources