. 2021 May 6;11(1):9644.
doi: 10.1038/s41598-021-88959-1.

Endothelial angiogenic activity and adipose angiogenesis is controlled by extracellular matrix protein TGFBI

Affiliations

Endothelial angiogenic activity and adipose angiogenesis is controlled by extracellular matrix protein TGFBI

Seul Gi Lee et al. Sci Rep. .

Abstract

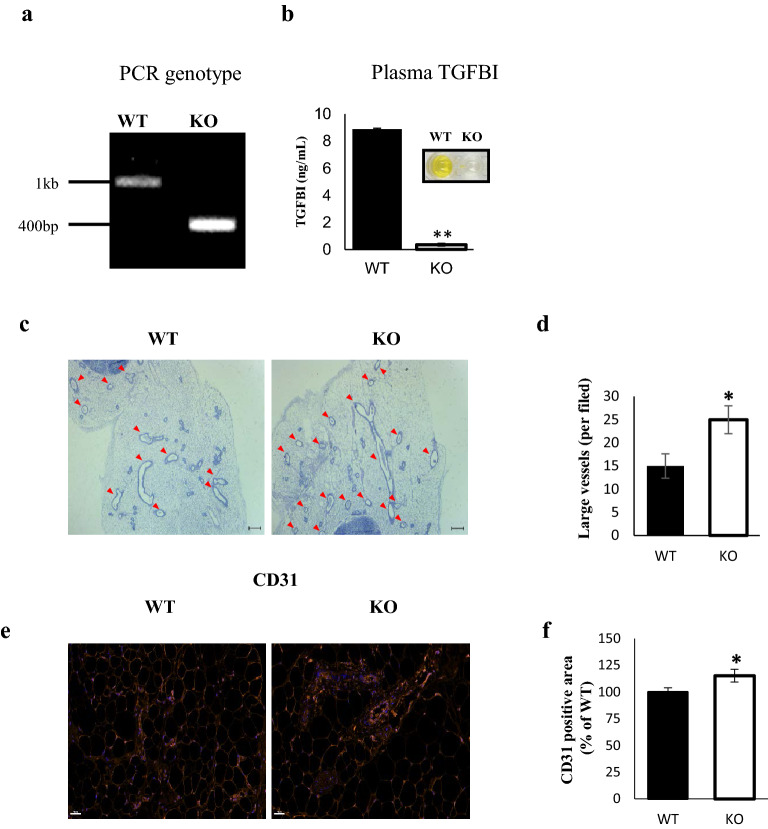
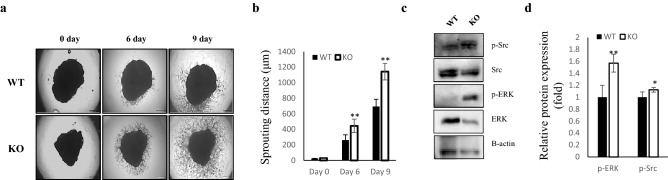
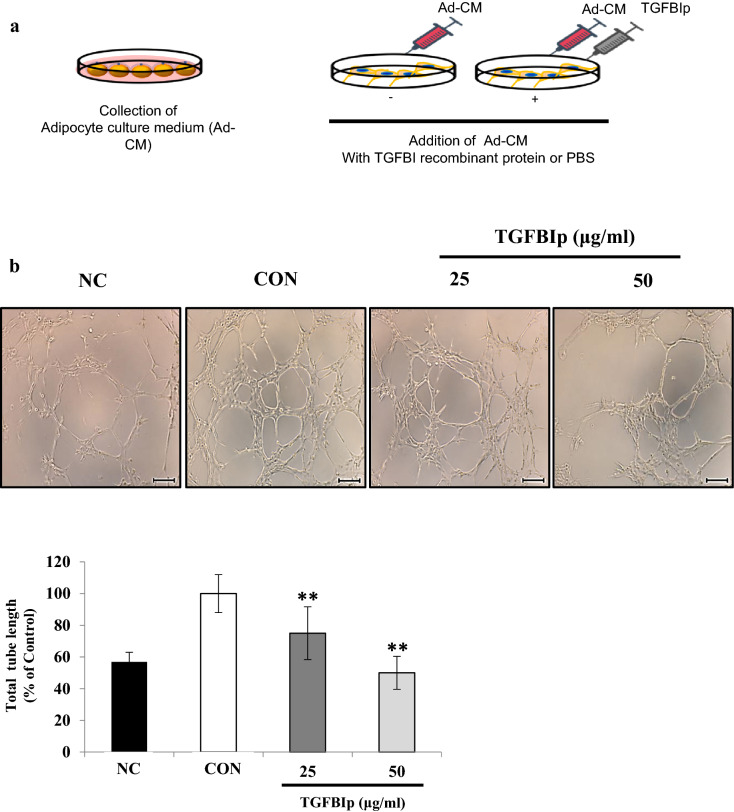
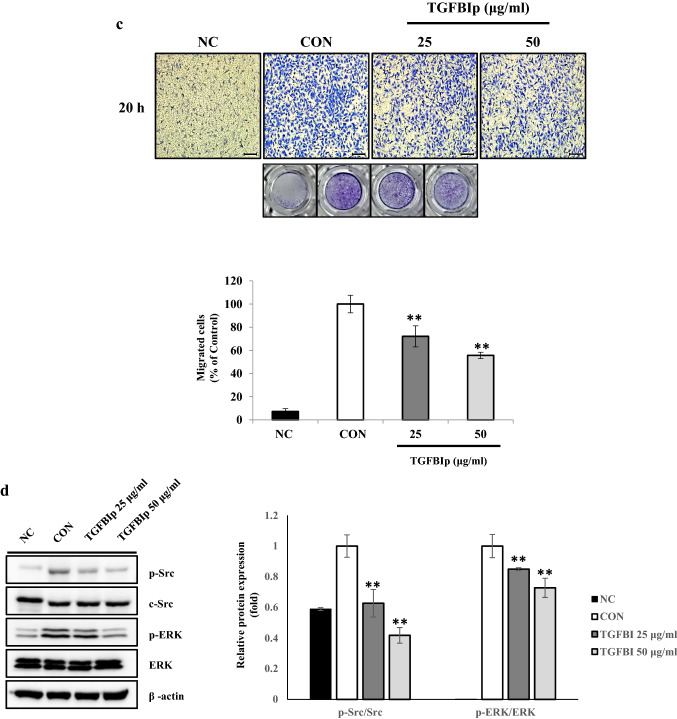
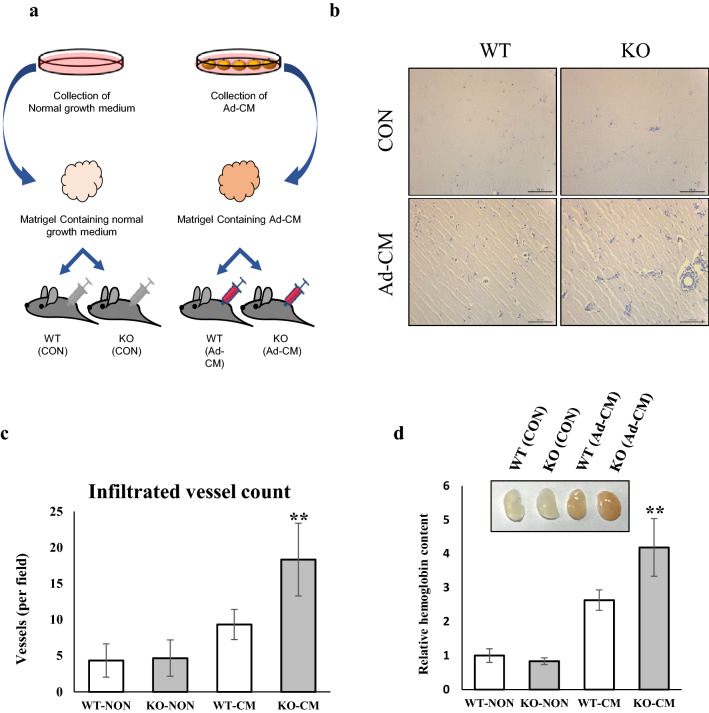
Several studies have suggested that extracellular matrix (ECM) remodeling and the microenvironment are tightly associated with adipogenesis and adipose angiogenesis. In the present study, we demonstrated that transforming growth factor-beta induced (TGFBI) suppresses angiogenesis stimulated by adipocyte-conditioned medium (Ad-CM), both in vitro and in vivo. TGFBI knockout (KO) mice exhibited increased numbers of blood vessels in adipose tissue, and blood vessels from these mice showed enhanced infiltration into Matrigel containing Ad-CM. The treatment of Ad-CM-stimulated SVEC-10 endothelial cells with TGFBI protein reduced migration and tube-forming activity. TGFBI protein suppressed the activation of the Src and extracellular signaling-related kinase signaling pathways of these SVEC-10 endothelial cells. Our findings indicated that TGFBI inhibited adipose angiogenesis by suppressing the activation of Src and ERK signaling pathways, possibly because of the stimulation of the angiogenic activity of endothelial cells.


Conflict of interest statement

The authors declare no competing interests.

Figures

Figure 1
Figure 1
TGFBI KO mice show higher vessel density in adipose tissue compared with WT mice. (a) Genotyping was performed using PCR. The amplification targeted exon 3 of the TGFBI gene. (b) Plasma TGFBI concentrations in 20-week-old WT and KO mice (n = 3/group). (c) Representative H&E staining of iWAT sections from 20-week-old male WT and KO mice (n = 5/group). The red arrow indicates a large vessel (≥ 10 µm in diameter). Scale bars represent 200 μm. (d) The vessels were counted in sections from three mice, and expressed as mean number. (e,f) Representative images of CD31 immunohistofluorescence staining of iWAT from 20-week-old male WT and KO mice (n = 5/group). Scale bars represent 50 μm. (f) Quantification of area percentage of CD31 staining using ImageJ software. Data are presented as the mean ± S.E.M. *p < 0.05 versus WT.
Figure 2
Figure 2
Enhanced capillary sprouting from adipose tissue in TGFBI KO mice. iWAT was dissected from 20-week-old male WT and KO mice and embedded on Matrigel. (a) Capillary sprouts emerging from iWAT were monitored for up to 9 days. Representative images of sprouted capillaries are shown at the indicated days. (b) The distance of capillary sprouting was quantified with Image J software. (c) Cells were isolated from capillary branches on day 9 post-embedding. Total proteins were extracted as described in the “Materials and methods” section. Representative expression of the indicated proteins in isolated primary cells from capillary sprouts in WT and KO mice (n = 3/group). (d) Relative expression of these proteins. Data are presented as the mean ± s.e.m. *p < 0.05, **p < 0.01 versus WT.
Figure 3
Figure 3
TGFBI reduces the migration and tube formation activity stimulated by Ad-CM in SVEC-10 endothelial cells. (a) Schematic of the in vitro experiment using SVEC-10 cells treated with Ad-CM. Negative control cells (NC) were cultured in normal growth medium with the same amount of PBS. (b) Representative images of tube formation (upper) and quantitation of the total tube length (lower). Scale bars represent 200 μm. (c) Representative images of migration (upper) and quantitation of the migrated cells after staining with crystal violet (lower). (d) SVEC-10 cells were starved overnight, treated with TGFBI for 60 min, and then stimulated with adipocyte-CM for 10 min. Expression levels of the indicated proteins were quantified (right). Data are presented as the mean ± s.e.m. *p < 0.05, **p < 0.01 versus control.
Figure 3
Figure 3
TGFBI reduces the migration and tube formation activity stimulated by Ad-CM in SVEC-10 endothelial cells. (a) Schematic of the in vitro experiment using SVEC-10 cells treated with Ad-CM. Negative control cells (NC) were cultured in normal growth medium with the same amount of PBS. (b) Representative images of tube formation (upper) and quantitation of the total tube length (lower). Scale bars represent 200 μm. (c) Representative images of migration (upper) and quantitation of the migrated cells after staining with crystal violet (lower). (d) SVEC-10 cells were starved overnight, treated with TGFBI for 60 min, and then stimulated with adipocyte-CM for 10 min. Expression levels of the indicated proteins were quantified (right). Data are presented as the mean ± s.e.m. *p < 0.05, **p < 0.01 versus control.
Figure 4
Figure 4
TGFBI modulates vessel infiltration into Matrigel containing Ad-CM. Matrigel impregnated with either normal medium or Ad-CM was injected in WT and KO mice. Normal medium: DMEM-high glucose, 10% FBS, and 1% antibiotics. (a) Schematic of the Matrigel plug assay in WT and TGFBI KO mice treated with Ad-CM. (b) Representative H&E staining section of Matrigel from WT and KO mice (n = 3/group). Scale bars represent 100 μm. (c) The infiltrated vessels were counted in three Matrigel H&E-stained sections and expressed as the mean number. Significant differences were evaluated between two groups of experiments in the same condition (WT-NON versus KO-NON or WT-CM versus KO-CM). (d) Relative hemoglobin content of Matrigel plugs. The insert image represents Matrigel for each group. Data are presented as the mean ± s.e.m. **p < 0.01 versus control.

References

    1. Cao Y. Adipose tissue angiogenesis as a therapeutic target for obesity and metabolic diseases. Nat. Rev. Drug Discov. 2010;9:107–115. doi: 10.1038/nrd3055. - DOI - PubMed
    1. Sung H-K, et al. Adipose vascular endothelial growth factor regulates metabolic homeostasis through angiogenesis. Cell Metab. 2013;17:61–72. doi: 10.1016/j.cmet.2012.12.010. - DOI - PubMed
    1. Michailidou Z, et al. Increased angiogenesis protects against adipose hypoxia and fibrosis in metabolic disease-resistant 11β-hydroxysteroid dehydrogenase type 1 (HSD1)-deficient mice. J. Biol. Chem. 2012;287:4188–4197. doi: 10.1074/jbc.M111.259325. - DOI - PMC - PubMed
    1. Sun K, Tordjman J, Clement K, Scherer PE. Fibrosis and adipose tissue dysfunction. Cell Metab. 2013;18:470–477. doi: 10.1016/j.cmet.2013.06.016. - DOI - PMC - PubMed
    1. Lin D, Chun T-H, Kang L. Adipose extracellular matrix remodelling in obesity and insulin resistance. Biochem. Pharmacol. 2016;119:8–16. doi: 10.1016/j.bcp.2016.05.005. - DOI - PMC - PubMed

Publication types

Substances