

nAChRs gene expression and neuroinflammation in APPswe/PS1dE9 transgenic mouse
- PMID: 33958667
- PMCID: PMC8102527
- DOI: 10.1038/s41598-021-89139-x
nAChRs gene expression and neuroinflammation in APPswe/PS1dE9 transgenic mouse
Erratum in
-
Publisher Correction: nAChRs gene expression and neuroinflammation in APPswe/PS1dE9 transgenic mouse.Sci Rep. 2021 Jul 6;11(1):14314. doi: 10.1038/s41598-021-93288-4. Sci Rep. 2021. PMID: 34230519 Free PMC article. No abstract available.
Retraction in
-
Retraction Note: nAChRs gene expression and neuroinflammation in APPswe/PS1dE9 transgenic mouse.Sci Rep. 2024 Nov 26;14(1):29316. doi: 10.1038/s41598-024-80730-6. Sci Rep. 2024. PMID: 39592702 Free PMC article. No abstract available.
Abstract
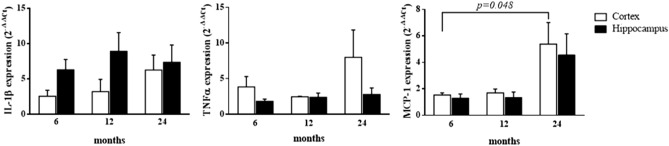
An evaluation of the APPswe/PS1dE9 transgenic AD mouse, presenting with the toxic Aβ1-42 deposition found in human AD, allowed us to characterize time-dependent changes in inflammatory and cholinergic markers present in AD. Astrogliosis was observed in cortex and hippocampus, with cellular loss occurring in the same areas in which Aβ plaques were present. In this setting, we found early significantly elevated levels of IL-1β and TNFα gene expression; with the hippocampus showing the highest IL-1β expression. To investigate the cholinergic anti-inflammatory pathway, the expression of nicotinic receptors (nAChRs) and cholinesterase enzymes also was evaluated. The anti-inflammatory nAChRα7, α4, and β2 were particularly increased at 6 months of age in the hippocampus, potentially as a strategy to counteract Aβ deposition and the ensuing inflammatory state. A time-dependent subunit switch to the α3β4 type occurred. Whether α3, β4 subunits have a pro-inflammatory or an inhibitory effect on ACh stimulation remains speculative. Aβ1-42 deposition, neuronal loss and increased astrocytes were detected, and a time-dependent change in components of the cholinergic anti-inflammatory pathway were observed. A greater understanding of time-dependent Aβ/nAChRs interactions may aid in defining new therapeutic strategies and novel molecular targets.
Conflict of interest statement
The authors declare no competing interests.
Figures


Similar articles
-
Expression Profiling of Cytokine, Cholinergic Markers, and Amyloid-β Deposition in the APPSWE/PS1dE9 Mouse Model of Alzheimer's Disease Pathology.J Alzheimers Dis. 2018;62(1):467-476. doi: 10.3233/JAD-170999. J Alzheimers Dis. 2018. PMID: 29439355 Free PMC article.
-
Suppression of nuclear factor kappa B ameliorates astrogliosis but not amyloid burden in APPswe/PS1dE9 mice.Neuroscience. 2009 Jun 16;161(1):53-8. doi: 10.1016/j.neuroscience.2009.03.010. Epub 2009 Mar 13. Neuroscience. 2009. PMID: 19286451
-
Effect of huprine X on β-amyloid, synaptophysin and α7 neuronal nicotinic acetylcholine receptors in the brain of 3xTg-AD and APPswe transgenic mice.Neurodegener Dis. 2010;7(6):379-88. doi: 10.1159/000287954. Epub 2010 Aug 4. Neurodegener Dis. 2010. PMID: 20689242
-
Soluble Aβ levels correlate with cognitive deficits in the 12-month-old APPswe/PS1dE9 mouse model of Alzheimer's disease.Behav Brain Res. 2011 Sep 23;222(2):342-50. doi: 10.1016/j.bbr.2011.03.072. Epub 2011 Apr 14. Behav Brain Res. 2011. PMID: 21513747
-
The Swedish dilemma - the almost exclusive use of APPswe-based mouse models impedes adequate evaluation of alternative β-secretases.Biochim Biophys Acta Mol Cell Res. 2022 Mar;1869(3):119164. doi: 10.1016/j.bbamcr.2021.119164. Epub 2021 Oct 23. Biochim Biophys Acta Mol Cell Res. 2022. PMID: 34699873 Review.
Cited by
-
Neuroinflammation increases oxygen extraction in a mouse model of Alzheimer's disease.Alzheimers Res Ther. 2024 Apr 10;16(1):78. doi: 10.1186/s13195-024-01444-5. Alzheimers Res Ther. 2024. PMID: 38600598 Free PMC article.
-
Nicotine Activating α4β2 Nicotinic Acetylcholine Receptors to Suppress Neuroinflammation via JAK2-STAT3 Signaling Pathway in Ischemic Rats and Inflammatory Cells.Mol Neurobiol. 2022 May;59(5):3280-3293. doi: 10.1007/s12035-022-02797-4. Epub 2022 Mar 17. Mol Neurobiol. 2022. PMID: 35297011
-
Targeting Neuronal Alpha7 Nicotinic Acetylcholine Receptor Upregulation in Age-Related Neurological Disorders.Cell Mol Neurobiol. 2025 Jul 16;45(1):70. doi: 10.1007/s10571-025-01586-6. Cell Mol Neurobiol. 2025. PMID: 40668334 Free PMC article. Review.
-
Animal models of Alzheimer's disease: Current strategies and new directions.Zool Res. 2024 Nov 18;45(6):1385-1407. doi: 10.24272/j.issn.2095-8137.2024.274. Zool Res. 2024. PMID: 39572020 Free PMC article. Review.
-
Unprecedented effect of vitamin D3 on T-cell receptor beta subunit and alpha7 nicotinic acetylcholine receptor expression in a 3-nitropropionic acid induced mouse model of Huntington's disease.IBRO Neurosci Rep. 2023 Jul 14;15:116-125. doi: 10.1016/j.ibneur.2023.07.001. eCollection 2023 Dec. IBRO Neurosci Rep. 2023. PMID: 38204575 Free PMC article.
References
-
- Dineley, K. T. Beta-amyloid peptide–nicotinic acetylcholine receptor interaction: the two faces of health and disease. Front. Biosci. J. Virtual Libr.12, 5030–5038 (2007). - PubMed
-
- Hardy, J. & Allsop, D. Amyloid deposition as the central event in the aetiology of Alzheimer’s disease. Trends Pharmacol. Sci.12, 383–388 (1991). - PubMed
-
- Hardy, J. A. & Higgins, G. A. Alzheimer’s disease: the amyloid cascade hypothesis. Science256, 184–185 (1992). - PubMed
Publication types
MeSH terms
Substances
LinkOut - more resources
Full Text Sources
Other Literature Sources
Medical
Molecular Biology Databases
