Review
. 2021 Aug;125(5):641-657.
doi: 10.1038/s41416-021-01387-w. Epub 2021 May 6.

Radiomics and radiogenomics in gliomas: a contemporary update

Affiliations
Review

Radiomics and radiogenomics in gliomas: a contemporary update

Gagandeep Singh et al. Br J Cancer. 2021 Aug.

Abstract

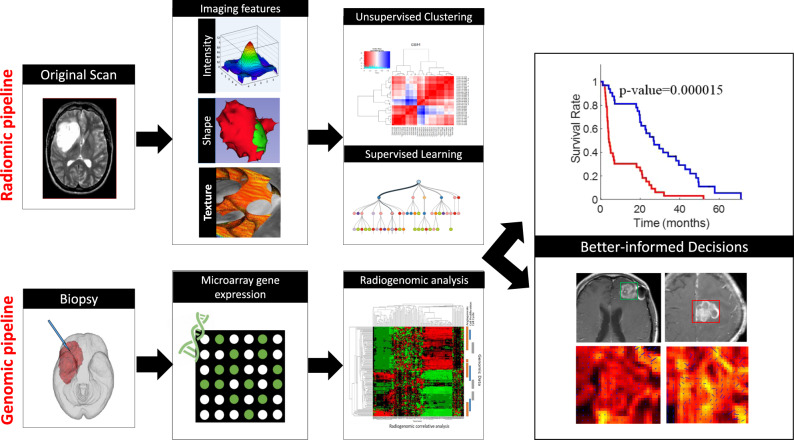
The natural history and treatment landscape of primary brain tumours are complicated by the varied tumour behaviour of primary or secondary gliomas (high-grade transformation of low-grade lesions), as well as the dilemmas with identification of radiation necrosis, tumour progression, and pseudoprogression on MRI. Radiomics and radiogenomics promise to offer precise diagnosis, predict prognosis, and assess tumour response to modern chemotherapy/immunotherapy and radiation therapy. This is achieved by a triumvirate of morphological, textural, and functional signatures, derived from a high-throughput extraction of quantitative voxel-level MR image metrics. However, the lack of standardisation of acquisition parameters and inconsistent methodology between working groups have made validations unreliable, hence multi-centre studies involving heterogenous study populations are warranted. We elucidate novel radiomic and radiogenomic workflow concepts and state-of-the-art descriptors in sub-visual MR image processing, with relevant literature on applications of such machine learning techniques in glioma management.


Conflict of interest statement

The authors declare no competing interests.

The authors declare that the research was conducted in the absence of any commercial or financial relationships that could be construed as a potential conflict of interest.

Figures

Fig. 1
Fig. 1. Radiomics and Radiogenomics workflow.
Use of Radiomics and Radiogenomics pipelines in personalized medicine.
Fig. 2
Fig. 2. Construction of Hypoxia Enrichment Score.
ac show a 2D Gd-T1w MRI slice with expert-annotated necrosis (outlined in green), enhancing tumour (yellow) and oedematous regions (brown) in three different GBM patients that exhibited low, medium, and high hypoxia enrichment score (HES) respectively. The corresponding inverse difference moment (Haralick) feature map has been overlaid on the manually annotated tumour regions, for HESlow (d), HESmedium (e), and HEShigh (f). g Unsupervised clustering of the RNAseq data from the 21 hypoxia associated genes clustered as high hypoxia (HEShigh—shown in navy blue, medium hypoxia (HESmedium—shown in teal) and low hypoxia (HESlow—shown in yellow). The x axis in the clustergram represents the 21 genes and y axis represents the patient population of 97 GBM cases. Figure from Beig et al.; licensed under a Creative Commons Attribution (CC BY) license.
Fig. 3
Fig. 3. Deformation Radiomics.
a, b Deformation vectors representing tissue displacement are shown as volume rendered 3D quivers overlaid on an image slice of right-hemispheric GBMs. The deformation magnitude is proportional to the size of quivers. Higher value of deformation magnitude is represented by ‘red’ and lower value by “blue” colour respectively. The quivers also show the direction of tissue displacement. c The AAL regions in which, the MEDH negatively correlated with survival with P < 0.05 for right-hemispheric tumour group (neurological view). The colormaps show the negative correlation values (shown as positive for easier representation). Figure from Prasanna et al.; licensed under a Creative Commons Attribution (CC BY) license.

References

    1. Ostrom QT, Gittleman H, Truitt G, Boscia A, Kruchko C, Barnholtz-Sloan JS. CBTRUS statistical report: primary brain and other central nervous system tumors diagnosed in the United States in 2011–2015. Neuro Oncol. 2018;20:iv1–iv86. doi: 10.1093/neuonc/noy131. - DOI - PMC - PubMed
    1. Louis DN, Perry A, Reifenberger G, von Deimling A, Figarella-Branger D, Cavenee WK, et al. The 2016 World Health Organization Classification of Tumors of the Central Nervous System: a summary. Acta Neuropathol. 2016;131:803–820. doi: 10.1007/s00401-016-1545-1. - DOI - PubMed
    1. Johnson DR, Guerin JB, Giannini C, Morris JM, Eckel LJ, Kaufmann TJ. 2016 updates to the WHO brain tumor classification system: what the radiologist needs to know. Radiographics. 2017;37:2164–2180. doi: 10.1148/rg.2017170037. - DOI - PubMed
    1. Gulsen S. Achieving higher diagnostic results in stereotactic brain biopsy by simple and novel technique. Open Access Maced. J. Med. Sci. 2015;3:99–104. doi: 10.3889/oamjms.2015.016. - DOI - PMC - PubMed
    1. Gutman DA, Cooper LA, Hwang SN, Holder CA, Gao J, Aurora TD, et al. MR imaging predictors of molecular profile and survival: multi-institutional study of the TCGA glioblastoma data set. Radiology. 2013;267:560–569. doi: 10.1148/radiol.13120118. - DOI - PMC - PubMed