. 2021 May;23(5):526-537.
doi: 10.1038/s41556-021-00672-3. Epub 2021 May 6.

LIMIT is an immunogenic lncRNA in cancer immunity and immunotherapy

Affiliations

LIMIT is an immunogenic lncRNA in cancer immunity and immunotherapy

Gaopeng Li et al. Nat Cell Biol. 2021 May.

Abstract

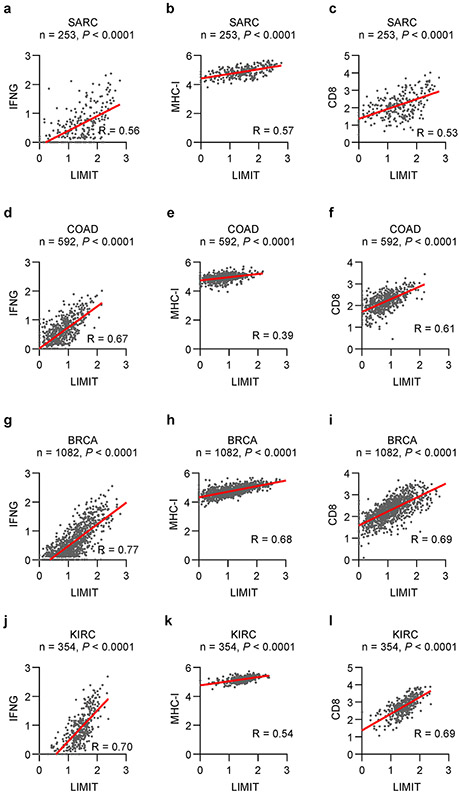
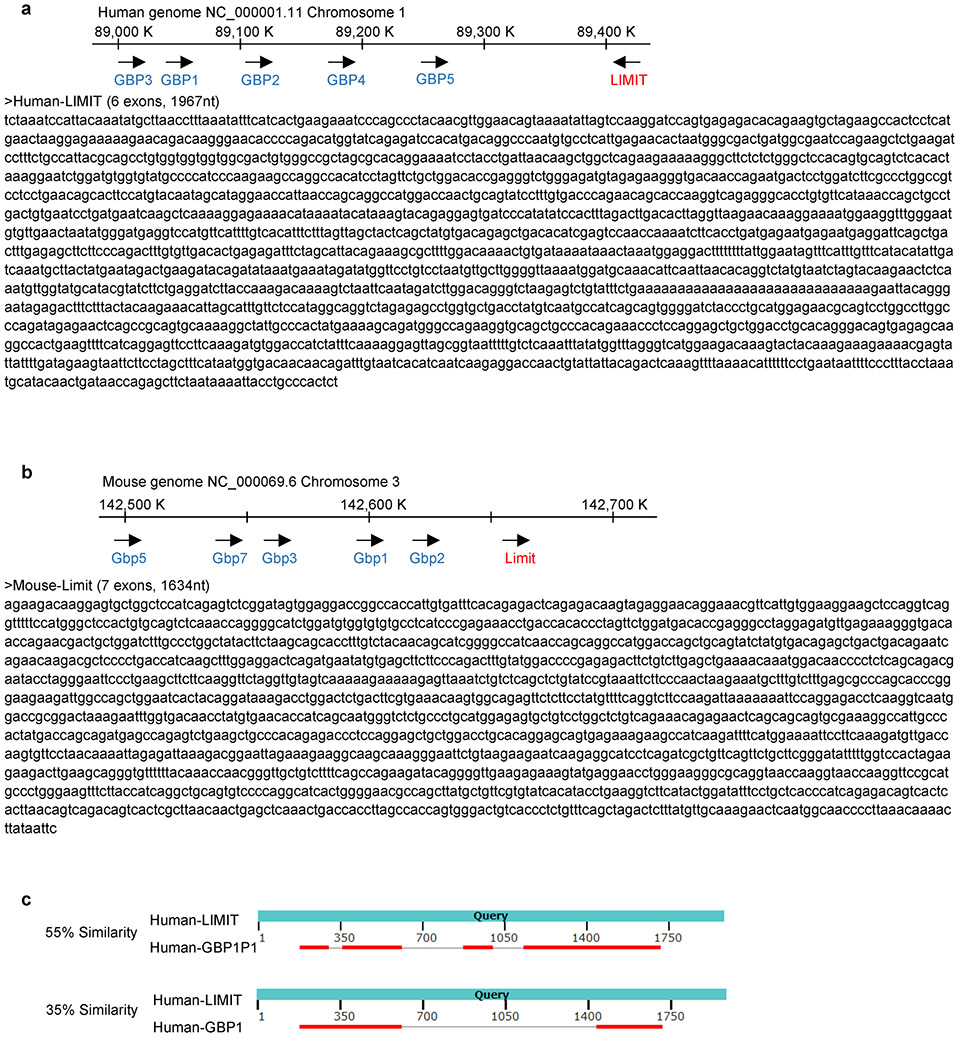
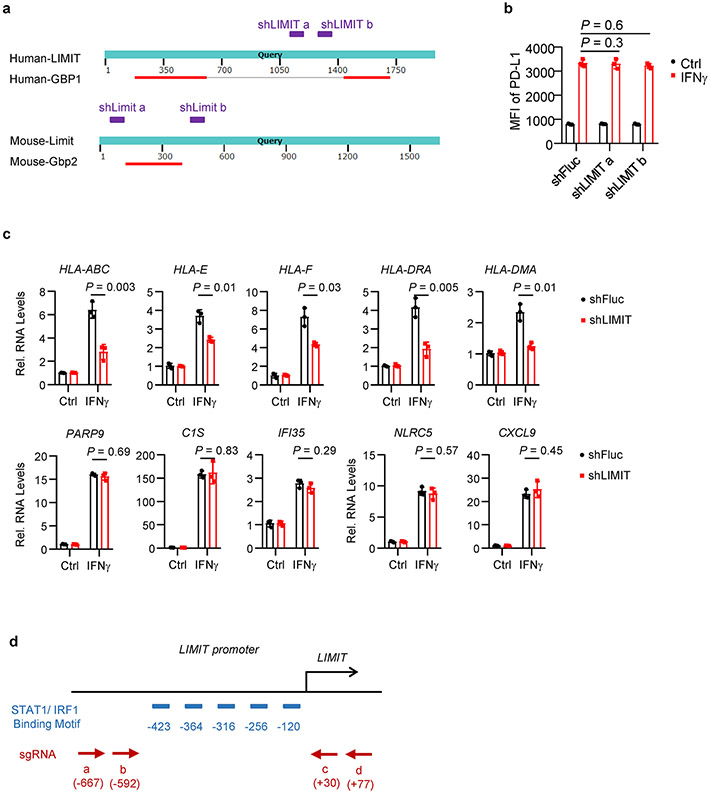
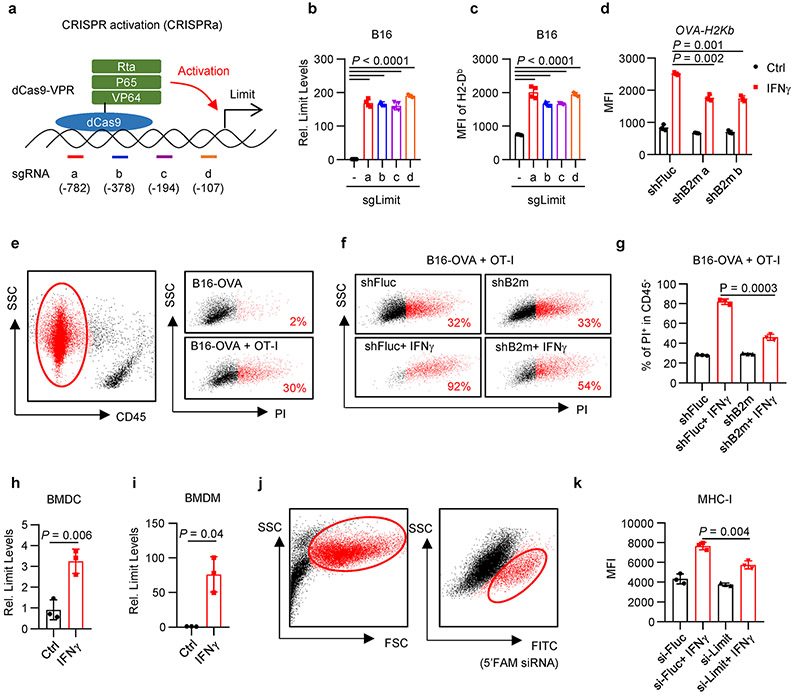
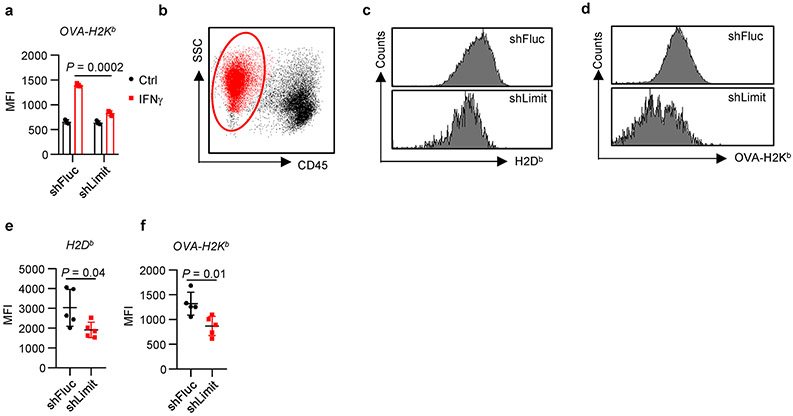
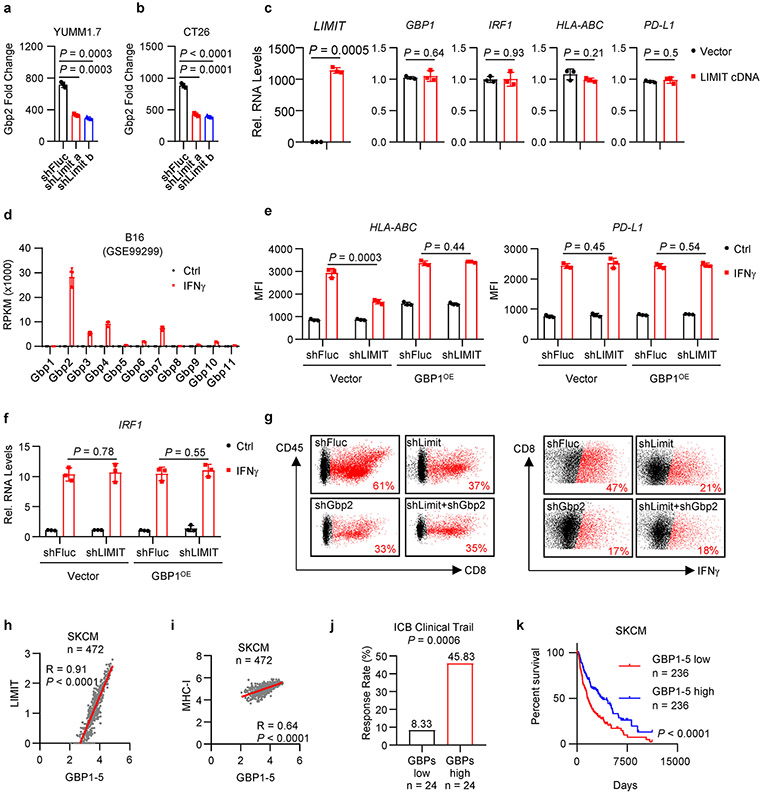
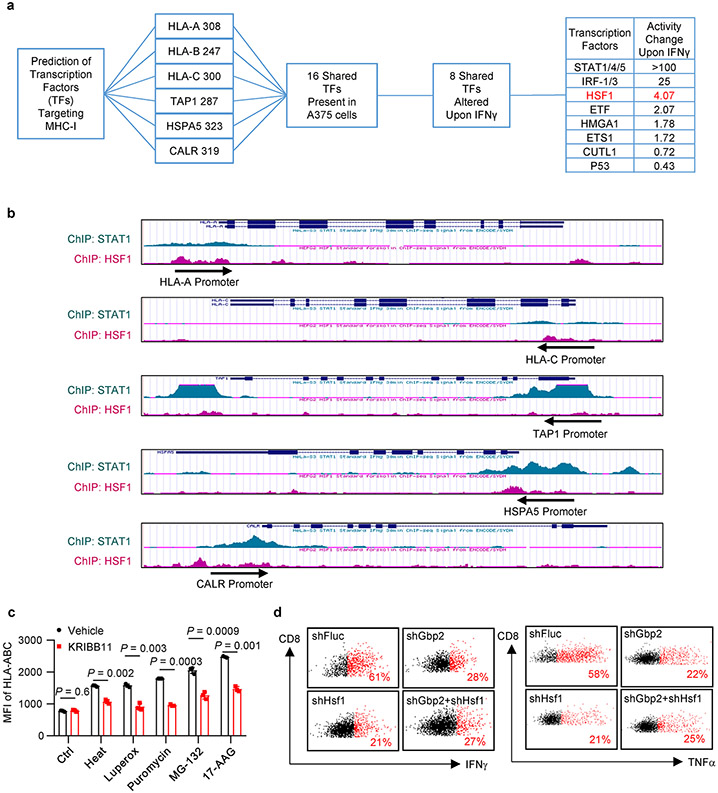
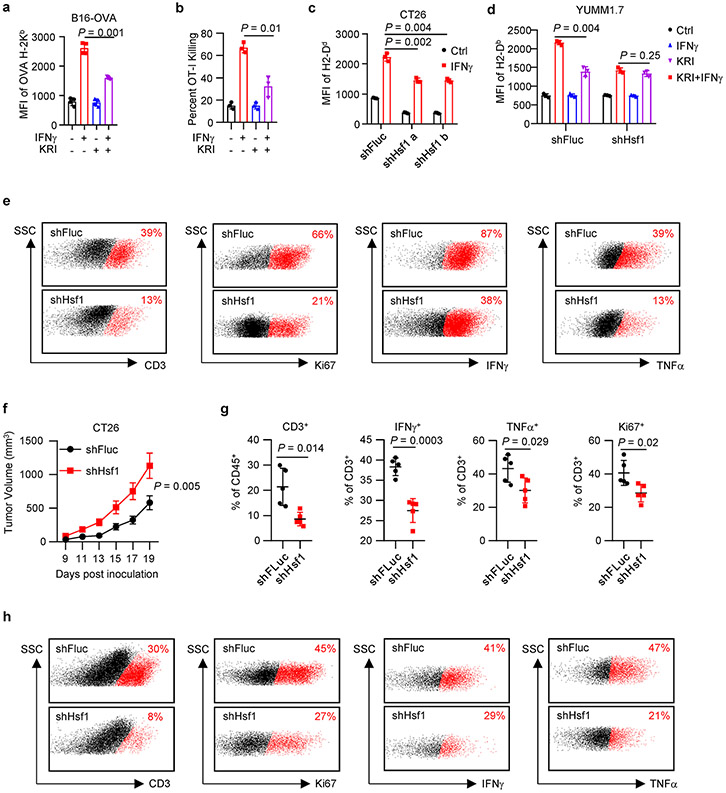
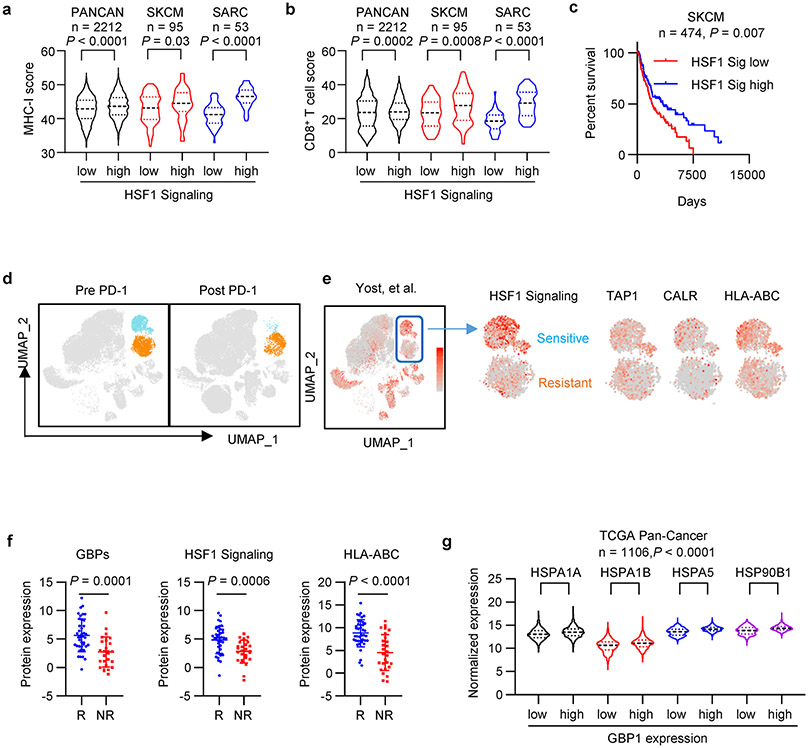
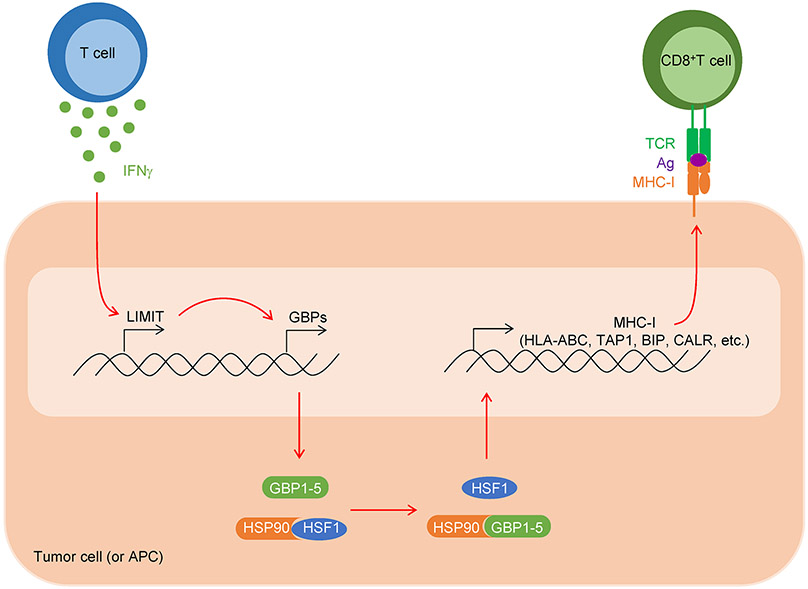
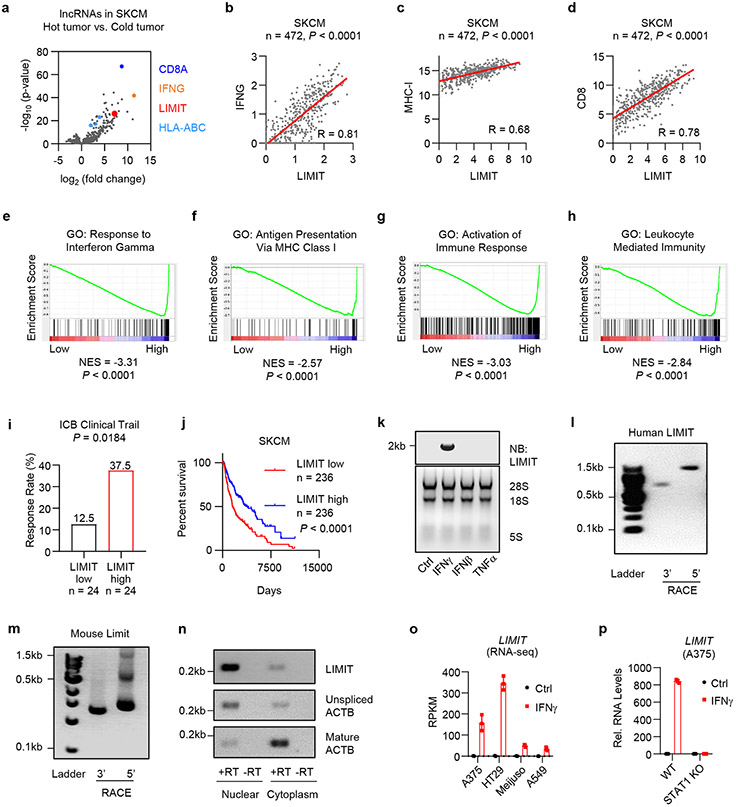
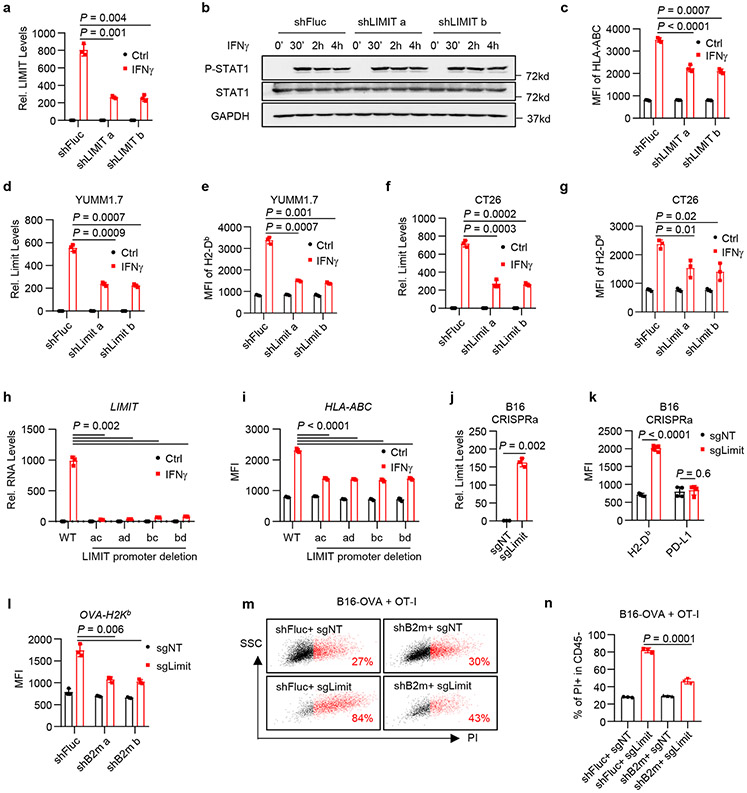
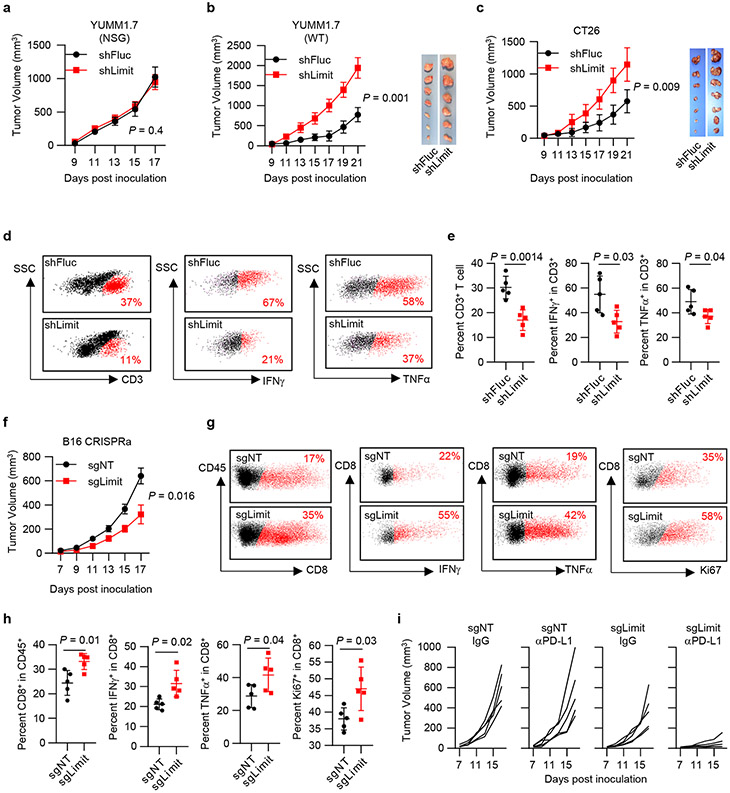
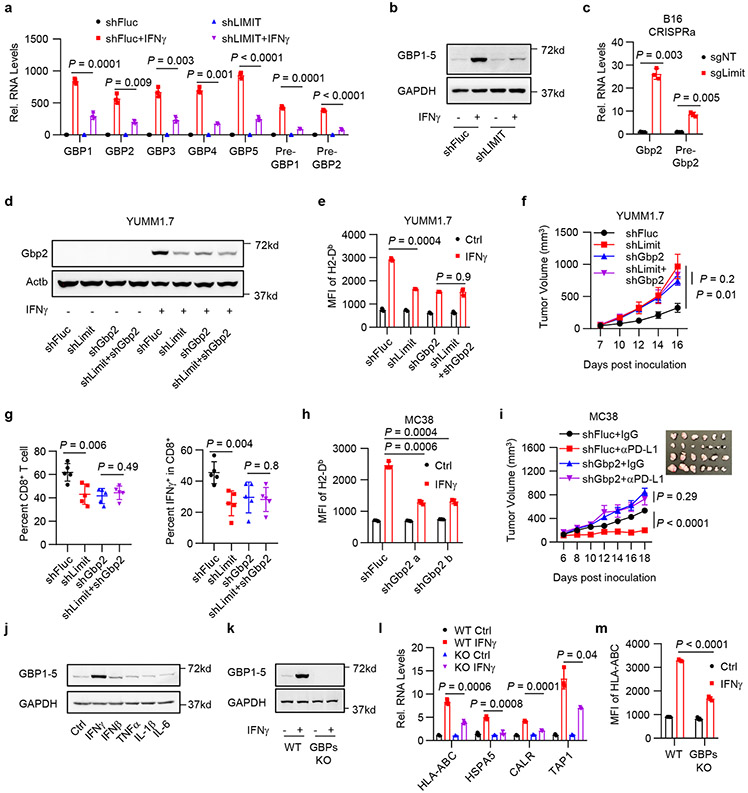
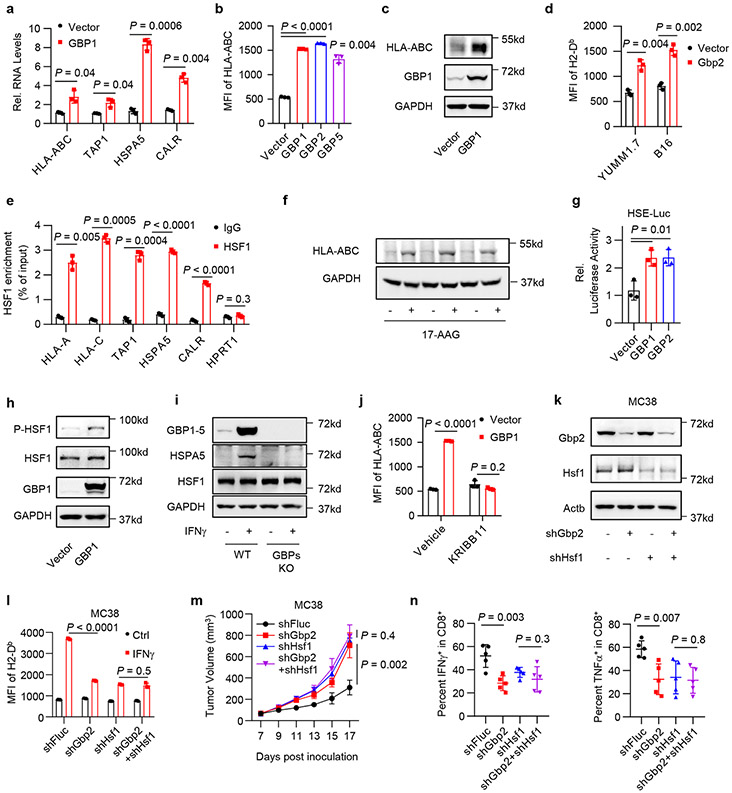
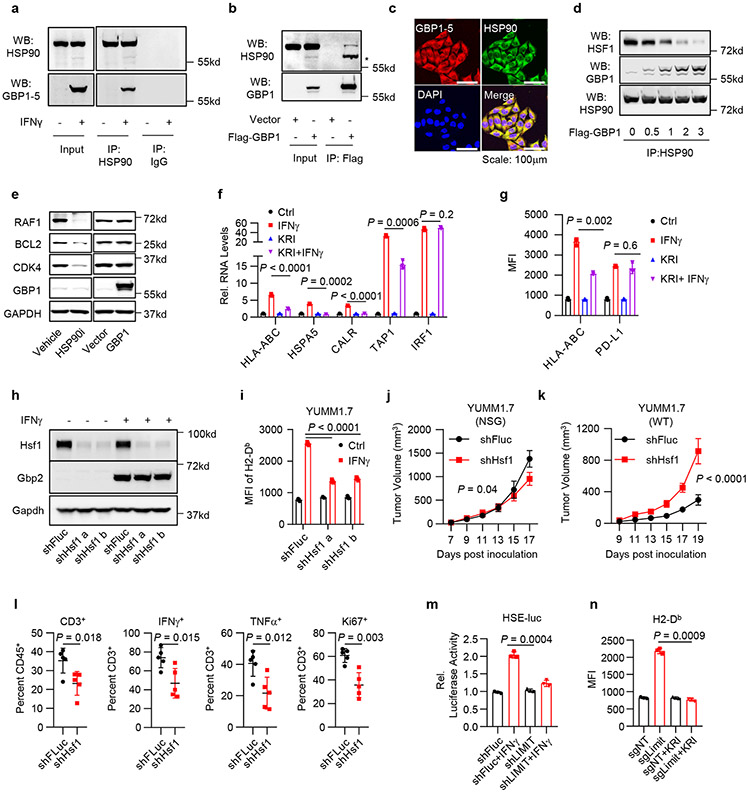
Major histocompatibility complex-I (MHC-I) presents tumour antigens to CD8+ T cells and triggers anti-tumour immunity. Humans may have 30,000-60,000 long noncoding RNAs (lncRNAs). However, it remains poorly understood whether lncRNAs affect tumour immunity. Here, we identify a lncRNA, lncRNA inducing MHC-I and immunogenicity of tumour (LIMIT), in humans and mice. We found that IFNγ stimulated LIMIT, LIMIT cis-activated the guanylate-binding protein (GBP) gene cluster and GBPs disrupted the association between HSP90 and heat shock factor-1 (HSF1), thereby resulting in HSF1 activation and transcription of MHC-I machinery, but not PD-L1. RNA-guided CRISPR activation of LIMIT boosted GBPs and MHC-I, and potentiated tumour immunogenicity and checkpoint therapy. Silencing LIMIT, GBPs and/or HSF1 diminished MHC-I, impaired antitumour immunity and blunted immunotherapy efficacy. Clinically, LIMIT, GBP- and HSF1-signalling transcripts and proteins correlated with MHC-I, tumour-infiltrating T cells and checkpoint blockade response in patients with cancer. Together, we demonstrate that LIMIT is a cancer immunogenic lncRNA and the LIMIT-GBP-HSF1 axis may be targetable for cancer immunotherapy.


Conflict of interest statement

Competing Interest Declaration

W.Z. has served as a scientific advisor or consultant for NGM, Cstone, Oncopia, and Hengenix. All other authors declare no competing interests.

Figures

Extended Data Fig. 1:
LIMIT correlates to effector immune genes across multiple cancer types.
Extended Data Fig. 2:
Genetic loci and sequences of human LIMIT and mouse Limit.
Extended Data Fig. 3:
LIMIT augments MHC-1 expression
Extended Data Fig. 4:
LIMIT augments MHC-1 expression.
Extended Data Fig. 5:
LIMIT augments antigen-loaded MHC-1 expression in vivo.
Extended Data Fig. 6:
LIMIT cis-activates GBPs to boost MHC-1 and tumor immunity.
Extended Data Fig. 7:
GBPs activate HSF1 to stimulate MHC-I expression.
Extended Data Fig. 8:
HSF1 drives MHC-I expression and tumor immunity.
Extended Data Fig. 9:
HSF1 signaling genes correlated with MHC-I and tumor immunity.
Extended Data Fig. 10:
Scheme showing how LIMIT-GBP-HSF1 axis affects MHC-I and tumor immunity.
Fig. 1:
Fig. 1:. LIMIT is an immunogenic lncRNA.
a. Human melanoma samples (TCGA data set, SKCM, n = 472 patients) were divided into hot and cold tumors on the basis of CD8A transcripts. The volcano plots showed the fold change and p-value of 3926 lncRNA candidates in hot tumor (CD8A, top 10%) vs. cold tumor (CD8A, bottom 10%). P value by 2-sided t-test. b-d. Correlation of LIMIT with IFNG (b), MHC-I (c), or CD8 (d) in human melanoma patients (TCGA, SKCM). P value by 2-sided linear regression. e-h. Human melanoma samples (TCGA, SKCM) were divided into high (n = 236 patients) and low (n = 236 patients) LIMIT tumors. Gene set enrichment analysis showed the indicated gene signatures. P value by GSEA analysis. i. Cancer patients having received immune checkpoint blockade (ICB) therapy were divided into low and high LIMIT groups (bottom 15% vs top 15%). The response rates to ICB were calculated as the percentages of partial response (PR) plus complete response (CR). P value by Chi-square test. Patients were from 4 cohorts. j. Survival plot of melanoma patients (TCGA, SKCM). Patients were divided into high (n = 236 patients) and low (n = 236 patients) LIMIT groups. P value by 2-sided log-rank test. k. A375 cells were treated with indicated cytokines (5 ng/ml) for 24 hours. LIMIT was detected by Northern blotting. The 28S rRNA, 18S rRNA, and 5S rRNA are shown as loading controls.1 of 2 experiments is shown. l-m. 5’RACE and 3’RACE of human LIMIT (l) or murine Limit (m). 1 of 2 experiments is shown. n. A375 cells were treated with IFNγ for 24 hours. LIMIT was detected by RT-PCR in nuclear or cytoplasmic RNAs. The unspliced and mature ACTB were served as controls for nuclear and cytoplasmic RNAs, respectively. 1 of 2 experiments is shown. o. RPKM of LIMIT in different cancer cells in response to IFNγ. p. Wild type (WT) or STAT1 knockout (KO) A375 cells were treated with 5 ng/ml IFNγ for 24 hours. RNA levels of LIMIT were quantified by qRT-PCR. All Data are mean ± SD. n = 3 biological independent samples in (o, p). Source data are provided in Soure_data_Fig1.xlsx and Unmodified_blots_Fig1.pdf.
Fig. 2:
Fig. 2:. LIMIT augments MHC-I expression.
a. A375 shFluc or shLIMIT cells were treated with IFNγ for 24 hours. RNA levels of LIMIT were determined by qRT-PCR. P value by 2-sided t-test. b. A375 shFluc or shLIMIT cells were treated with IFNγ for the indicated time. Protein levels of phospho-STAT1 (p-Y701), STAT1, and GAPDH were determined by Western blotting. 1 of 2 experiments is shown. c. A375 shFluc or shLIMIT cells were treated with IFNγ for 48 hours. Surface expression of HLA-ABC were determined by flow cytometry (FACS). P value by 2-sided t-test. d-g. YUMM1.7 (d, e) or CT26 (f, g) cells carrying shFluc or shLimit were treated with IFNγ. RNA levels of Limit were determined 24 hours after treatment (d, f). Surface staining of MHC-I (H2-Db) was detected 48 hours after treatment (e, g). P value by 2-sided t-test. h-i. A375 WT or LIMIT promoter deletion cells were treated with IFNγ. RNA levels of LIMIT were determined 24 hours after treatment (h). Surface expression of HLA-ABC were determined 48 hours after treatment (i). P value by 2-sided t-test. j-k. B16 cells were transfected with dCas9-VPR, together with non-targeting sgRNA (sgNT) or sgRNA targeting the promoter of Limit (sgLimit). RNA levels of Limit were determined 24 hours after treatment (j). Surface expression of MHC-I (H2-Db) or PD-L1 were determined 48 hours after treatment (k). P value by 2-sided t-test. l. B16-OVA cells carrying shFluc or shB2m were manipulated with Limit CRISPRa (sgLimit) for 48 hours. Surface expression of OVA-H2Kb were determined by FACS. P value by 2-sided t-test. m-n. B16-OVA cells were manipulated with B2m knocking down (shB2m) or Limit CRISPRa (sgLimit), and co-cultured with OT-I cell at the ratio of 1:4. Cell death was measured by PI staining in CD45 tumor cells. Dot plots (m) and statistical results (n) are shown. P value by 2-sided t-test. All data are mean ± SD. n = 3 biological independent samples in (a, c, d, e, f, g, h, i, j, k, l, n). Source data are provided in Soure_data_Fig2.xlsx and Unmodified_blots_Fig2.pdf.
Fig. 3:
Fig. 3:. LIMIT enhances anti-tumor immunity.
a. Tumor growth curve of YUMM1.7 shFluc or YUMM1.7 shLimit cells in NSG mice. n = 5 animals, P value by 2-sided t-test for tumor volume at end point. b. Tumor growth curve and tumor size of YUMM1.7 shFluc or YUMM1.7 shLimit cells inoculated in wild type C57BL/6 mice. n = 6 (shFluc) or 7 (shLimit) animals, P value by 2-sided t-test for tumor volume at end point. c. Tumor growth curve of CT26 shFluc or CT26 shLimit cells in wild type BALB/c mice. n = 7 animals, P value by 2-sided t-test for tumor volume at end point. d. Dot plots of intratumoral CD3+ T cells, IFNγ+ T cells, and TNFα+ T cells in YUMM1.7 shFluc or YUMM1.7 shLimit tumors. e. The percentages of intra-tumoral CD3+ T cells (of CD45+), IFNγ+ T cells, and TNFα+ T cells in YUMM1.7 shFluc or YUMM1.7 shLimit tumors. P value by 2-sided t-test. f. Tumor growth curve of B16 sgNT or B16 sgLimit (CRISPRa) cells in wild type C57BL/6 mice. n = 5 animals. P value by 2-sided t-test. g. Dot plots of intral-tumoral T cell population and activation in B16 sgNT or B16 sgLimit tumors. h. Intral-tumoral T cell population or activation in B16 sgNT or B16 sgLimit tumors. P value by 2-sided t-test. i. Tumor growth curve of B16 sgNT cells and B16 sgLimit cells in response to IgG or anti-PD-L1 antibody. n = 5 animals. All data are mean ± SD. n = 5 biological independent samples in (e, h). Source data are provided in Soure_data_Fig3.xlsx.
Fig. 4:
Fig. 4:. LIMIT cis-activates GBPs to boost MHC-I and tumor immunity.
a. A375 shFluc or shLIMIT cells were treated with IFNγ for 24 hours. RNA (a) or protein (b) levels of GBPs were determined. P value by 2-sided t-test. 1 of 3 blots is shown. c. B16 cells were manipulated with Limit CRISPRa for 24 hours. Gbp2 precursor and mature RNAs were determined. P value by 2-sided t-test. d-e. YUMM1.7 shFluc, shLimit, shGbp2 or shLimit+shGbp2 cells were treated with IFNγ. Gbp2 protein was detected 24 hours after treatment (d). Surface expression of MHC-I (H2-Db) was measured 48 hours after treatment (e). 1 of 2 blots is shown. P value by 2-sided t-test. f. Tumor growth curves of YUMM1.7 shFluc, shLimit, shGbp2, or shLimit+shGbp2 cells inoculated in C57BL/6 mice. n = 5 animals, P value by 2-sided t-test for tumor volume at end point. g. Percentages of intral-tumoral CD8+ T cells or IFNγ+CD8+ T cells in YUMM1.7 tumors carrying shFluc, shLimit, shGbp2, or shLimit+shGbp2. n = 5 animals, P value by 2-sided t-test. h. MC38 shFluc or shGbp2 cells were treated with IFNγ . Surface staining of H2-Db were determined 48 hours after treatment. P value by 2-sided t-test. i. Tumor growth curves of MC38 shFluc and MC38 shGbp2 cells. Tumor bearing mice were treated with IgG or anti-PD-L1 antibody. n = 6 (shFluc) or 7 (shGbp2) animals, P value by t-test for end point tumor volume. j. A375 cells were treated with indicated cytokines for 24 hours. Protein levels of GBP1-5 were determined. 1 of 2 experiments is shown. k-m. A375 WT or GBP1-5 KO cells were treated with IFNγ. GBP1-5 protein (k) and MHC-I-related gene transcripts (l) were determined 24 hours after treatment. MHC-I surface expression (m) were determined 48 hours after treatment. 1 of 3 blots is shown. P value by 2-sided t-test. All data are mean ± SD. n = 3 biological independent samples in (a, c, e, h, l, m). Source data are provided in Soure_data_Fig4.xlsx and Unmodified_blots_Fig4.pdf.
Fig. 5:
Fig. 5:. GBPs activate HSF1 to stimulate MHC-I expression and tumor immunity.
a-c. A375 cells were forced expression of GBPs. MHC-I RNA (a), surface expression (b) or total protein (c) levels were determined 24 hours (a) or 48 hours (b, c) afterwards. P value by 2-sided t-test. 1 of 2 blots is shown. d. MHC-I surface expression in YUMM1.7 or B16 cells upon Gbp2 overexpression. P value by 2-sided t-test. e. HSF1 chromatin IP for indicated gene promoters were performed in IFNγ-pretreated A375 cells. P value by 2-sided t-test. f. A375 cells were treated with 17-AAG to activate HSF1. Protein levels of HLA-ABC were determined 48 hours after treatment. 1 of 2 experiments is shown. g. A375 HSE-luc cells were forced expression of GBPs. Luciferase activity were detected 48 hours afterwards. P value by 2-sided t-test. h. A375 cells were forced expression of GBP1. Indicated proteins were determined 12 hours afterwards. 1 of 2 experiments is shown. i. A375 WT or GBPs KO cells were treated with IFNγ. Indicated proteins were determined 24 hours afterwards. 1 of 2 experiments is shown. j. A375 cells were forced expression of GBP1, and treated with KRIBB11. MHC-I surface expression was determined 48 hours afterwards. P value by 2-sided t-test. k-l. MC38 shFluc, shGbp2, shHsf1, or shGbp2+shHsf1 cells were treated with IFNγ. Indicated proteins (k) or MHC-I surface expression (l) were determined 48 hours afterwards. 1 of 2 experiments is shown. P value by 2-sided t-test. m. Tumor growth curves of MC38 shFluc, shGbp2, shHsf1, and shGbp2+shHsf1 cells in C57BL/6 mice. n = 5 animals, P value by 2-sided t-test for end point tumor volume. n. Percentages of intral-tumoral IFNγ+CD8+ T cells or TNFα+CD8+ T cells in MC38 tumors carrying shFluc, shGbp2, shHsf1, or shGbp2+shHsf1. n = 5 biological independent samples, P value by 2-sided t-test. All data are mean ± SD. n = 3 biological independent samples in (a, b, d, e, g, j, l). Source data are provided in Soure_data_Fig5.xlsx and Unmodified_blots_Fig5.pdf.
Fig. 6:
Fig. 6:. LIMIT-GBP-HSF1 axis drives MHC-I and tumor immunity.
a. Co-IP of GBP1-5 with HSP90 antibody in IFNγ-pretreated A375 cells. 1 of 3 experiments is shown. b. Co-IP of HSP90 with Flag antibody in Flag-GBP1-overexpressed A375 cells. * indicated the band shift of HSP90 upon GBP1 overexpression. 1 of 2 experiments is shown. c. Immunofluorescence staining of GBP1 and HSP90 in IFNγ-pretreated A375 cells. 1 of 4 images is shown. d. 293T cells were forced expression of Flag-HSF1 and increased doses of Flag-GBP1. Co-IP of HSF1 or GBP1 with HSP90 antibody were performed 24 hours afterwards. 1 of 2 experiments is shown. e. A375 cells were treated with HSP90 inhibitor, or forced expression of GBP1. Indicated proteins were detected 48 hours afterwards. 1 of 2 experiments is shown. f-g. A375 cells were treated with IFNγ and KRIBB11. RNA (f) or surface staining (g) levels of indicated genes were determined 48 hours afterwards. P value by 2-sided t-test. h. YUMM1.7 shFluc or shHsf1 cells were treated with IFNγ. Total protein (h) or surface expression (i) levels of indicated genes were determined 48 hours afterwards. 1 of 2 experiments is shown. P value by 2-sided t-test. j-k. Tumor growth curves of YUMM1.7 shFluc or shHsf1 cells in NSG mice (j) or wild type C57BL/6 mice (k). n = 5 (j) or 6 (k) animals, P value by 2-sided t-test for end point tumor volume. l. Percentages of CD3+, Ki67+, IFNγ+, and TNFα+ T cells in YUMM1.7 shFluc or shHsf1 tumors. n = 5 biological independent samples, P value by 2-sided t-test. m. A375 shFluc or shLIMIT cells were transfected with HSE-luc and PRL-SV40 overnight, and then treated with IFNγ for additional 48 hours. HSF1 transcriptional activity is depicted as the relative luciferase activity. P value by 2-sided t-test. n. B16 cells were manipulated with Limit CRISPRa and treated with KRIBB11. Surface expression of MHC-I (H2-Db) was determined 48 hours afterwards. P value by 2-sided t-test. All data are mean ± SD. n = 3 biological independent samples in (f, g, i, m, n). Source data are provided in Soure_data_Fig6.xlsx and Unmodified_blots_Fig6.pdf.

Comment in

Similar articles

Cited by

References

    1. Zou W, Wolchok JD & Chen L PD-L1 (B7-H1) and PD-1 pathway blockade for cancer therapy: Mechanisms, response biomarkers, and combinations. Sci Transl Med 8, 328rv324, doi:10.1126/scitranslmed.aad7118 (2016). - DOI - PMC - PubMed
    1. Schumacher TN & Schreiber RD Neoantigens in cancer immunotherapy. Science 348, 69–74, doi:10.1126/science.aaa4971 (2015). - DOI - PubMed
    1. Garcia-Lora A, Algarra I & Garrido F MHC class I antigens, immune surveillance, and tumor immune escape. J Cell Physiol 195, 346–355, doi:10.1002/jcp.10290 (2003). - DOI - PubMed
    1. Festenstein H & Garrido F MHC antigens and malignancy. Nature 322, 502–503, doi:10.1038/322502a0 (1986). - DOI - PubMed
    1. Garrido F, Aptsiauri N, Doorduijn EM, Garcia Lora AM & van Hall T The urgent need to recover MHC class I in cancers for effective immunotherapy. Curr Opin Immunol 39, 44–51, doi:10.1016/j.coi.2015.12.007 (2016). - DOI - PMC - PubMed

Publication types

MeSH terms