

The reference genome of Miscanthus floridulus illuminates the evolution of Saccharinae
- PMID: 33958777
- PMCID: PMC8238680
- DOI: 10.1038/s41477-021-00908-y
The reference genome of Miscanthus floridulus illuminates the evolution of Saccharinae
Erratum in
-
Publisher Correction: The reference genome of Miscanthus floridulus illuminates the evolution of Saccharinae.Nat Plants. 2021 Jul;7(7):991. doi: 10.1038/s41477-021-00968-0. Nat Plants. 2021. PMID: 34183785 Free PMC article. No abstract available.
-
Author Correction: The reference genome of Miscanthus floridulus illuminates the evolution of Saccharinae.Nat Plants. 2021 Jul;7(7):990. doi: 10.1038/s41477-021-00972-4. Nat Plants. 2021. PMID: 34183786 Free PMC article. No abstract available.
Abstract
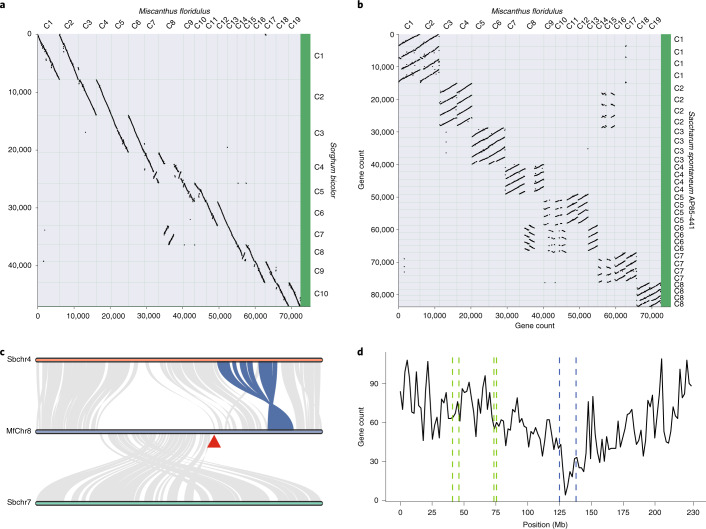
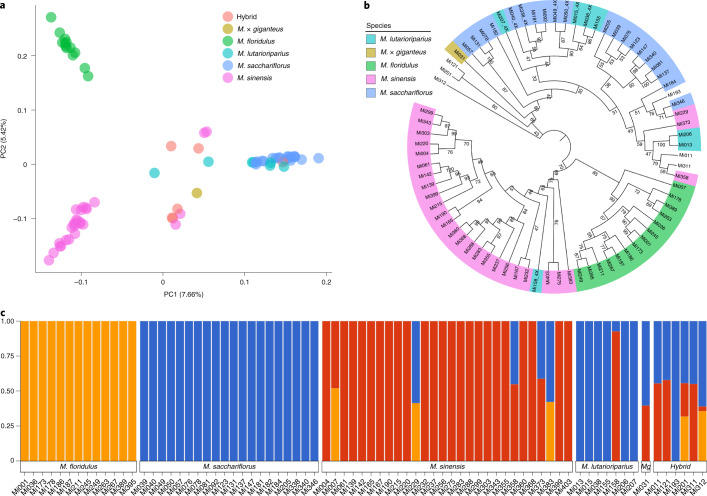
Miscanthus, a member of the Saccharinae subtribe that includes sorghum and sugarcane, has been widely studied as a feedstock for cellulosic biofuel production. Here, we report the sequencing and assembly of the Miscanthus floridulus genome by the integration of PacBio sequencing and Hi-C mapping, resulting in a chromosome-scale, high-quality reference genome of the genus Miscanthus. Comparisons among Saccharinae genomes suggest that Sorghum split first from the common ancestor of Saccharum and Miscanthus, which subsequently diverged from each other, with two successive whole-genome duplication events occurring independently in the Saccharum genus and one whole-genome duplication occurring in the Miscanthus genus. Fusion of two chromosomes occurred during rediploidization in M. floridulus and no significant subgenome dominance was observed. A survey of cellulose synthases (CesA) in M. floridulus revealed quite high expression of most CesA genes in growing stems, which is in agreement with the high cellulose content of this species. Resequencing and comparisons of 75 Miscanthus accessions suggest that M. lutarioriparius is genetically close to M. sacchariflorus and that M. floridulus is more distantly related to other species and is more genetically diverse. This study provides a valuable genomic resource for molecular breeding and improvement of Miscanthus and Saccharinae crops.
Conflict of interest statement
The authors declare no competing interests.
Figures


Similar articles
-
A framework genetic map for Miscanthus sinensis from RNAseq-based markers shows recent tetraploidy.BMC Genomics. 2012 Apr 24;13:142. doi: 10.1186/1471-2164-13-142. BMC Genomics. 2012. PMID: 22524439 Free PMC article.
-
SSR-based genetic maps of Miscanthus sinensis and M. sacchariflorus, and their comparison to sorghum.Theor Appl Genet. 2012 May;124(7):1325-38. doi: 10.1007/s00122-012-1790-1. Epub 2012 Jan 25. Theor Appl Genet. 2012. PMID: 22274765
-
Sequencing of transcriptomes from two Miscanthus species reveals functional specificity in rhizomes, and clarifies evolutionary relationships.BMC Plant Biol. 2014 May 18;14:134. doi: 10.1186/1471-2229-14-134. BMC Plant Biol. 2014. PMID: 24884969 Free PMC article.
-
Biofuel and energy crops: high-yield Saccharinae take center stage in the post-genomics era.Genome Biol. 2013 Jun 27;14(6):210. doi: 10.1186/gb-2013-14-6-210. Genome Biol. 2013. PMID: 23805917 Free PMC article. Review.
-
Domestication to crop improvement: genetic resources for Sorghum and Saccharum (Andropogoneae).Ann Bot. 2007 Nov;100(5):975-89. doi: 10.1093/aob/mcm192. Epub 2007 Sep 1. Ann Bot. 2007. PMID: 17766842 Free PMC article. Review.
Cited by
-
Genome-wide analysis of NBS-LRR genes revealed contribution of disease resistance from Saccharum spontaneum to modern sugarcane cultivar.Front Plant Sci. 2023 Feb 20;14:1091567. doi: 10.3389/fpls.2023.1091567. eCollection 2023. Front Plant Sci. 2023. PMID: 36890898 Free PMC article.
-
Evolutionary analysis of the DHHCs in Saccharinae.Sci Rep. 2025 Jan 17;15(1):2290. doi: 10.1038/s41598-025-86463-4. Sci Rep. 2025. PMID: 39833334 Free PMC article.
-
Chromosome-level Genomes Reveal the Genetic Basis of Descending Dysploidy and Sex Determination in Morus Plants.Genomics Proteomics Bioinformatics. 2022 Dec;20(6):1119-1137. doi: 10.1016/j.gpb.2022.08.005. Epub 2022 Aug 30. Genomics Proteomics Bioinformatics. 2022. PMID: 36055564 Free PMC article.
-
Genome-Wide Characterization and Expression Profiling of the GRAS Gene Family in Salt and Alkali Stresses in Miscanthus sinensis.Int J Mol Sci. 2022 Nov 22;23(23):14521. doi: 10.3390/ijms232314521. Int J Mol Sci. 2022. PMID: 36498850 Free PMC article.
-
Recent Advances in Sugarcane Leaf Scald Disease: Pathogenic Insights and Sustainable Management Approaches.Plants (Basel). 2025 Feb 7;14(4):508. doi: 10.3390/plants14040508. Plants (Basel). 2025. PMID: 40006767 Free PMC article. Review.
References
-
- Paterson, A. H. Genomics of the Saccharinae (Springer, 2012).
-
- Przybysz K, et al. Production of sugar feedstocks for fermentation processes from selected fast growing grasses. Energies. 2019;12:3129. doi: 10.3390/en12163129. - DOI
MeSH terms
Substances
LinkOut - more resources
Full Text Sources
Other Literature Sources
