. 2021 Jun;53(6):787-793.
doi: 10.1038/s41588-021-00847-6. Epub 2021 May 6.

Genome-wide survival study identifies a novel synaptic locus and polygenic score for cognitive progression in Parkinson's disease

Collaborators, Affiliations

Genome-wide survival study identifies a novel synaptic locus and polygenic score for cognitive progression in Parkinson's disease

Ganqiang Liu et al. Nat Genet. 2021 Jun.

Abstract

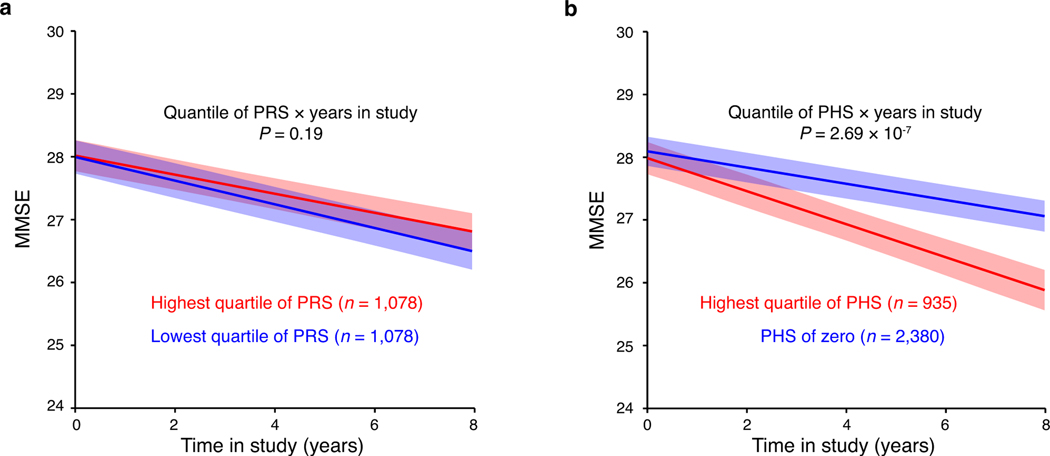
A key driver of patients' well-being and clinical trials for Parkinson's disease (PD) is the course that the disease takes over time (progression and prognosis). To assess how genetic variation influences the progression of PD over time to dementia, a major determinant for quality of life, we performed a longitudinal genome-wide survival study of 11.2 million variants in 3,821 patients with PD over 31,053 visits. We discover RIMS2 as a progression locus and confirm this in a replicate population (hazard ratio (HR) = 4.77, P = 2.78 × 10⁻¹¹), identify suggestive evidence for TMEM108 (HR = 2.86, P = 2.09 × 10⁻⁸) and WWOX (HR = 2.12, P = 2.37 × 10⁻⁸) as progression loci, and confirm associations for GBA (HR = 1.93, P = 0.0002) and APOE (HR = 1.48, P = 0.001). Polygenic progression scores exhibit a substantial aggregate association with dementia risk, while polygenic susceptibility scores are not predictive. This study identifies a novel synaptic locus and polygenic score for cognitive disease progression in PD and proposes diverging genetic architectures of progression and susceptibility.


Figures

Extended Data Fig. 1
Extended Data Fig. 1. Genotyping pipeline for discovery and replication cohorts.
Quality control (QC) steps outlined in blue were performed using PLINK v1.90beta.
Extended Data Fig. 2
Extended Data Fig. 2. Characteristics of loci associated with cognitive progression in PD.
a, RIMS2 locus. b, TMEM108 locus. c, WWOX locus. Top, chromosomal position; middle, -log10(P values) for individual SNPs at each locus (left y-axis) with the rate of recombination indicated by the red line (right y-axis); bottom, gene positions with the locus. Each point represents a SNP colored according to LD with the lead associated variant. Figure panels were generated with LocusTrack and r2 values were calculated based on CEU population in the 1000 Genomes Project data set.
Extended Data Fig. 3
Extended Data Fig. 3. Associations between a second RIMS2 variant rs116918991, TMEM108 rs138073281, and WWOX rs8050111 with cognitive PD progression.
a,c,e, Covariate-adjusted survival curves for PD patients without the indicated variant (blue line) and for those carrying the indicated variant (heterozygotes and homozygotes; red dashed line) are shown. P values Cox PH models with two-sided Wald test and were not corrected for multiple hypothesis testing. b,d,f, Adjusted mean MMSE scores across time predicted from the estimated fixed-effect parameters of the LMM analysis are shown for cases carrying the variant (heterozygotes and homozygotes; red) and cases without the variant (non-carriers; blue) adjusting for covariates. Shaded ribbons indicate +/− s.e.m. around predicted MMSE scores across time. Note that a second RIMS2 variant rs116918991 (correlated with r2 = 0.49 with the lead variant rs182987047; Fig. 1) is shown in a and b, and that the HR and P values shown here for TMEM108 rs138073281 and WWOX rs8050111 are different from the HR and P values from the main analysis (Table 1), where variant alleles were coded as 0, 1, 2. P values from LMM analysis with two-sided t-test and were not corrected for multiple hypothesis testing
Extended Data Fig. 4
Extended Data Fig. 4. RIMS2, TMEM108, and WWOX are expressed in human brain.
Gene expression profiles were downloaded directly from the GTEx Portal V7. Expression values are shown in Transcript per Million (TPM), calculated from a gene model with isoforms collapsed to a single gene. Box plots visualize first, third quartiles and medians; the ends of the whiskers represent the lowest (or highest) value still within 1.5-times the interquartile range. Outliers are displayed as dots, if they are above or below 1.5-times the interquartile range. n indicates number of individuals for each tissue analyzed in GTEx V7.
Extended Data Fig. 5
Extended Data Fig. 5. Cell-type specific expression of RIMS2, TMEM108, and WWOX in human brain.
Cell type-specific transcriptomes were assayed using laser-capture RNA sequencing (lcRNAseq) as reported. Gene expression (FPKM) profiles of RIMS2, TMEM108, and WWOX are from BRAINcode consortium (http://www.humanbraincode.org). n indicates the number of individuals assayed for each cell type. SNDA, indicates dopamine neurons laser-captured from human substantial nigra pars compacta; MCPY, pyramidal neurons from human motor cortex; TCPY, pyramidal neurons from human temporal cortex; PBMC, human peripheral blood mononuclear white cells; FB, primary human fibroblasts. Box plots visualize first, third quartiles, and medians; the ends of the whiskers represent the lowest (or highest) value still within 1.5-times the interquartile range. Each dot represents a sample.
Extended Data Fig. 6
Extended Data Fig. 6. The polygenic hazard score (PHS) is associated with decline in serial MMSE scores.
a, PD cases scoring in the highest quartile (red) of a polygenic risk score (PRS based on 90 susceptibility variants) compared to PD cases scoring in the lowest quartile of the PRS (blue) are shown. b, PD cases scoring in the highest quartile (red) of the PHS (comprising GBA + APOE ε4 + the 3 novel progression variants) compared to PD cases scoring zero on the PHS (blue) are shown. For a and b, adjusted mean MMSE scores across time predicted from the estimated fixed-effect parameters in the LMM analysis for the combined data set comprising discovery and replication populations are shown. The shaded ribbons indicate +/− s.e.m. around predicted MMSE scores across time. The P values from LMM analysis with two-sided t-tests and were not corrected for multiple hypothesis testing.
Fig. 1 |
Fig. 1 |. Within-cases longitudinal genome-wide survival study identifies three loci associated with progression to Parkinson’s disease dementia (PDD).
a, Manhattan plot of the genome-wide survival analyses. -log10(P value) from the Cox proportional hazards (Cox PH) model with two-sided Wald test for 12-year survival free of dementia are plotted against chromosomal position for the combined population (n = 3,821 cases with PD tracked in 31,053 longitudinal visits for up to 12 years). Each point represents a SNP. The dashed red line corresponds to the genome-wide significance threshold. b, Covariate-adjusted survival curves for PD patients without the RIMS2 rs182987047 variant (cyan line) and for those carrying the variant (magenta dashed line). Cox PH model with two-sided Wald test. c, Adjusted mean MMSE scores across time predicted from the estimated fixed-effect parameters in the LMM analysis are shown for cases carrying the RIMS2 rs182987047 variant (magenta) and cases without the variant (non-carriers; cyan) adjusting for covariates. Shaded ribbons indicate +/− standard error of the mean (s.e.m.) across time. P values from LMM.
Fig. 2 |
Fig. 2 |. GBA and APOE ε4 accelerate cognitive decline in individuals with Parkinson’s disease.
a, Covariate-adjusted survival curves for PD patients without GBA mutation (cyan line) and those carrying GBA mutation (orange dashed line). b, Adjusted mean MMSE scores across time predicted from the estimated fixed-effect parameters in the LMM for carriers (orange) and non-carriers (cyan) of a GBA variant. c, Covariate adjusted survival curves for patients with PD without an APOE ε4 allele (cyan line), carriers of one APOE ε4 allele (red line) and carriers of two APOE ε4 alleles (purple line). Cox PH model with two-sided Wald test. d, Adjusted mean MMSE scores across time predicted from the estimated fixed-effect for non-carriers (cyan line), APOE ε4 heterozygous (red line) and APOE ε4 homozygous (purple line) carriers. a,c, Cox PH model with two-sided Wald test; b-d, shaded ribbons indicate +/− s.e.m. across time; P values from LMM.
Fig. 3 |
Fig. 3 |. A polygenic hazard score outperforms polygenic risk scores in dementia prediction.
a, Comparison of polygenic Cox PH models for predicting progression to PDD in cases with PD (n = 3,821 with 31,053 longitudinal visits). Data are visualized as the 10-years cumulative AUC (bars) and the 95% CI (error bars), which was estimated as described implemented in the timeROC package. P values of the AUC of individual polygenic hazard score models (based on prognosis variants) compared to the AUC of a polygenic risk score (PRS) model (based on 90 susceptibility variants) are shown; * indicates P < 0.05 (i.e. exact P values of 0.006, 0.002 and 0.003, respectively) and ** indicates P = 0.0009; two-sided z-tests. b, Cox-adjusted survival curves for survival free of PDD for cases scoring in the highest quartile of PRS (orange) compared to cases scoring in the lowest quartile of PRS (cyan) are shown. c, Cox-adjusted survival curves for survival free of PDD for cases scoring in the highest quartile of PHS (magenta) compared to cases scoring zero on the PHS (cyan) are shown for the combined dataset. d, Cox-adjusted survival curves for survival free of PDD for cases scoring in the highest quartile of PHS (magenta) compared to cases scoring zero on the PHS (cyan) are shown for the new PHS validation dataset. b-d, Cox PH model with two-sided Wald test; stratified analyses’ results (HR, 95% CI, P values) are shown; non-stratified analyses’ results are in Table 2. Patients assigned to the highest quartile of PRS or PHS were those with a score greater than the score separating the fourth (highest) and third quartile of values.

References

    1. Nalls MA et al.Large-scale meta-analysis of genome-wide association data identifies six new risk loci for Parkinson’s disease. Nat. Genet. 46, 989–993 (2014). - PMC - PubMed
    1. Chang D. et al.A meta-analysis of genome-wide association studies identifies 17 new Parkinson’s disease risk loci. Nat. Genet. 49, 1511–1516 (2017). - PMC - PubMed
    1. Greenland JC, Williams-Gray CH & Barker RA The clinical heterogeneity of Parkinson’s disease and its therapeutic implications. Eur. J. Neurosci. 49, 328–338 (2019). - PubMed
    1. Wijmenga C. & Zhernakova A. The importance of cohort studies in the post-GWAS era. Nat. Genet. 50, 322–328 (2018). - PubMed
    1. Locascio JJ & Atri A. An overview of longitudinal data analysis methods for neurological research. Dement. Geriatr. Cogn. Dis. Extra 1, 330–357 (2011). - PMC - PubMed

Methods-only References

    1. Alves G. et al.Incidence of Parkinson’s disease in Norway: the Norwegian ParkWest study. J. Neurol. Neurosurg. Psychiatry 80, 851–857 (2009). - PubMed
    1. Parkinson Progression Marker I. The Parkinson Progression Marker Initiative (PPMI). Prog. Neurobiol. 95, 629–635 (2011). - PMC - PubMed
    1. Verbaan D. et al.Patient-reported autonomic symptoms in Parkinson disease. Neurology 69, 333–341 (2007). - PubMed
    1. Beach TG et al.Arizona Study of Aging and Neurodegenerative Disorders and Brain and Body Donation Program. Neuropathology 35, 354–389 (2015). - PMC - PubMed
    1. Lucero C. et al.Cognitive reserve and beta-amyloid pathology in Parkinson disease. Parkinsonism Relat. Disord. 21, 899–904 (2015). - PMC - PubMed

Publication types

MeSH terms