. 2021 May;27(5):851-861.
doi: 10.1038/s41591-021-01304-x. Epub 2021 May 6.

BRAFV600E-induced senescence drives Langerhans cell histiocytosis pathophysiology

Affiliations

BRAFV600E-induced senescence drives Langerhans cell histiocytosis pathophysiology

Camille Bigenwald et al. Nat Med. 2021 May.

Abstract

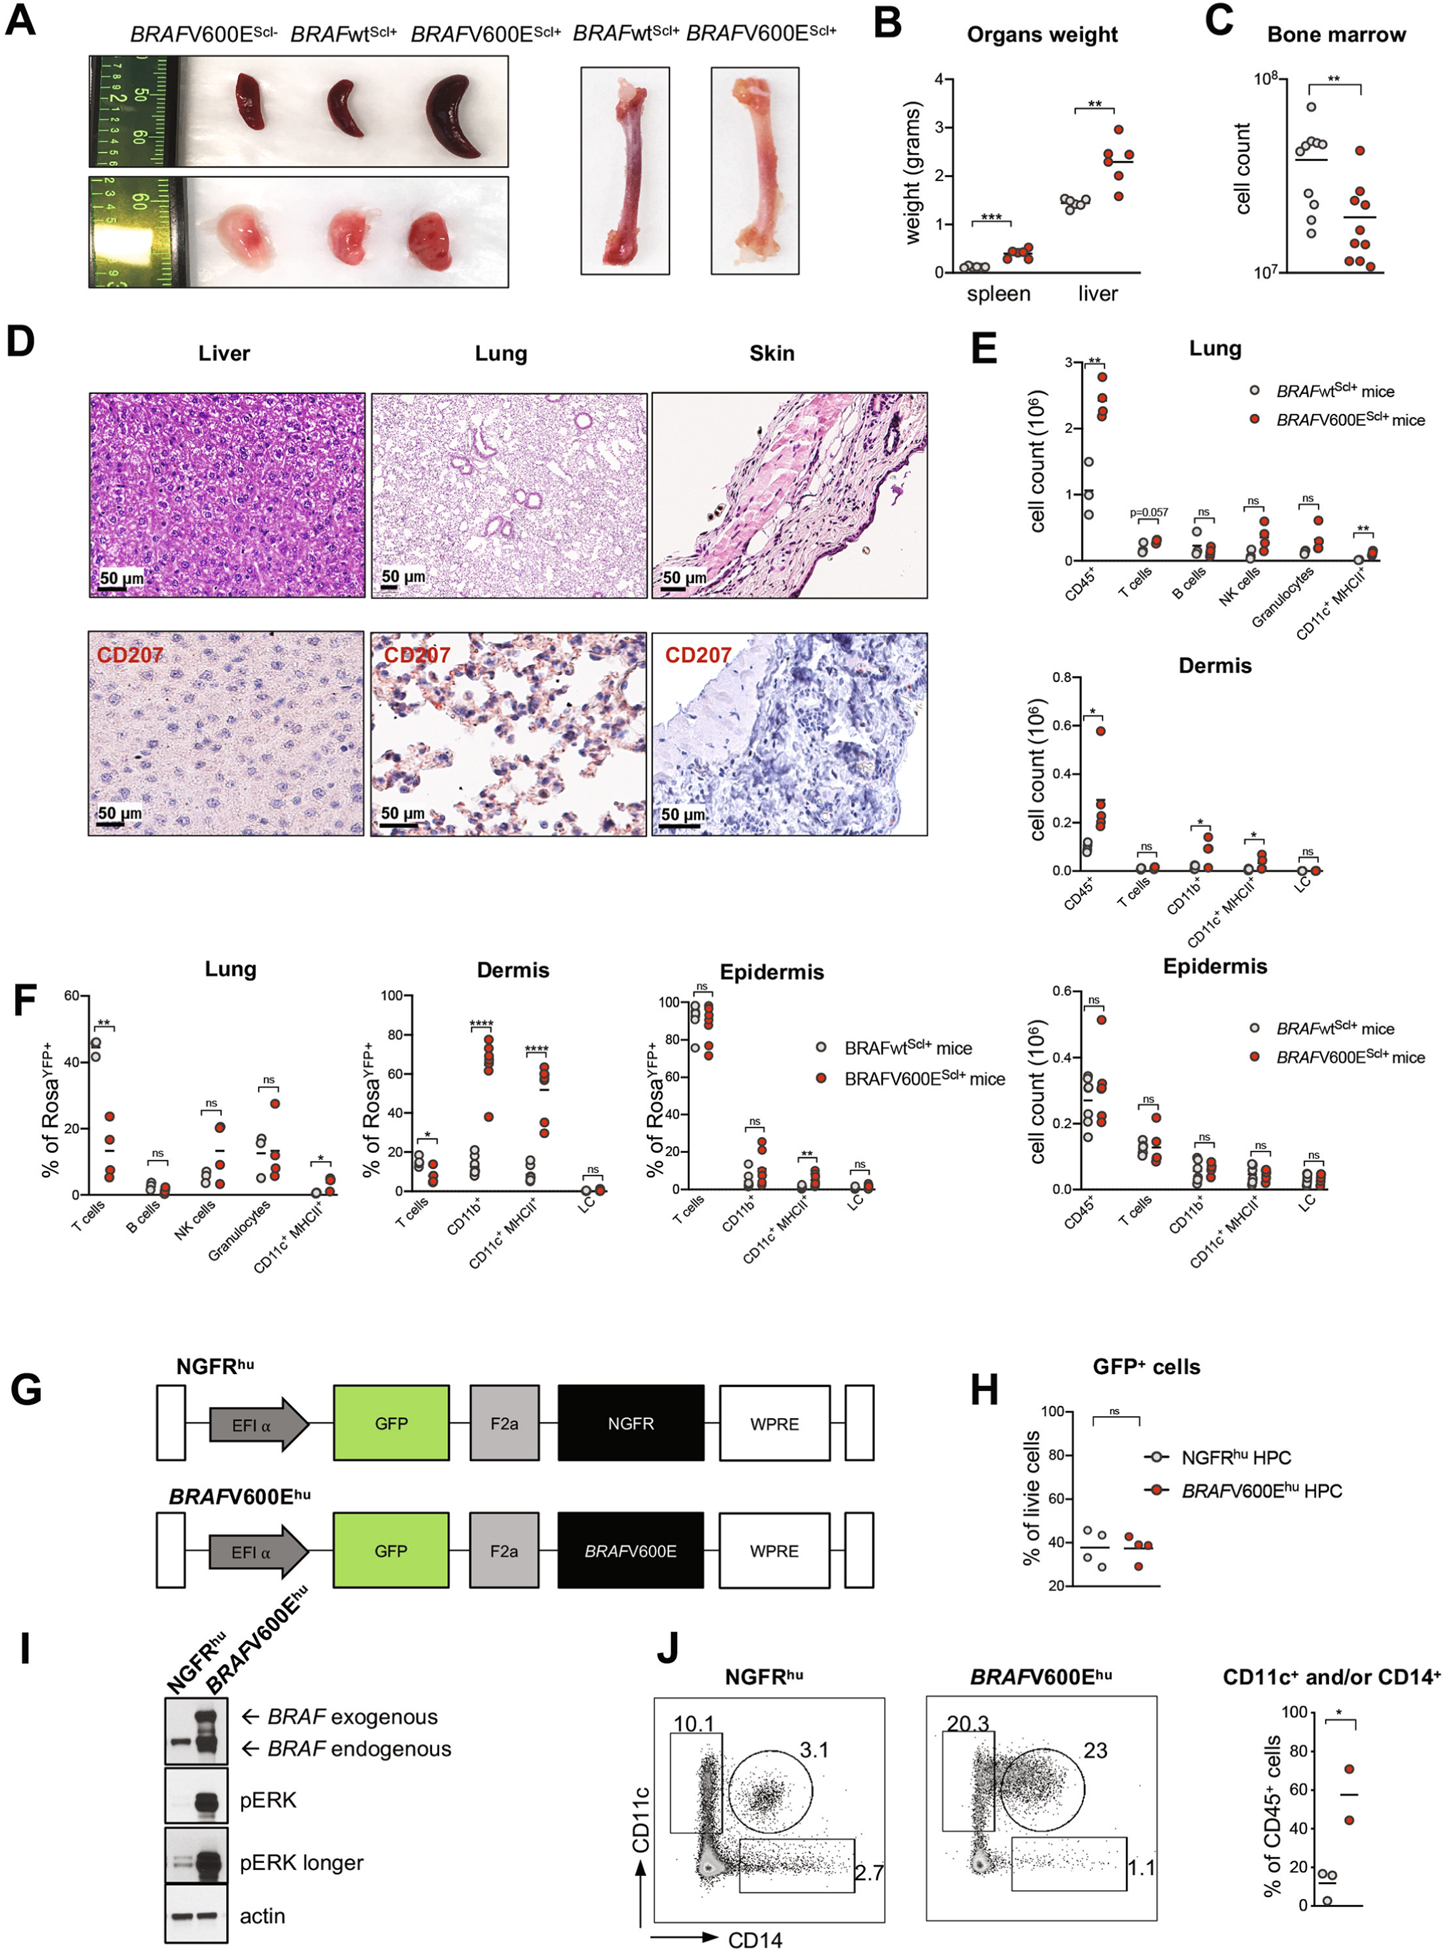
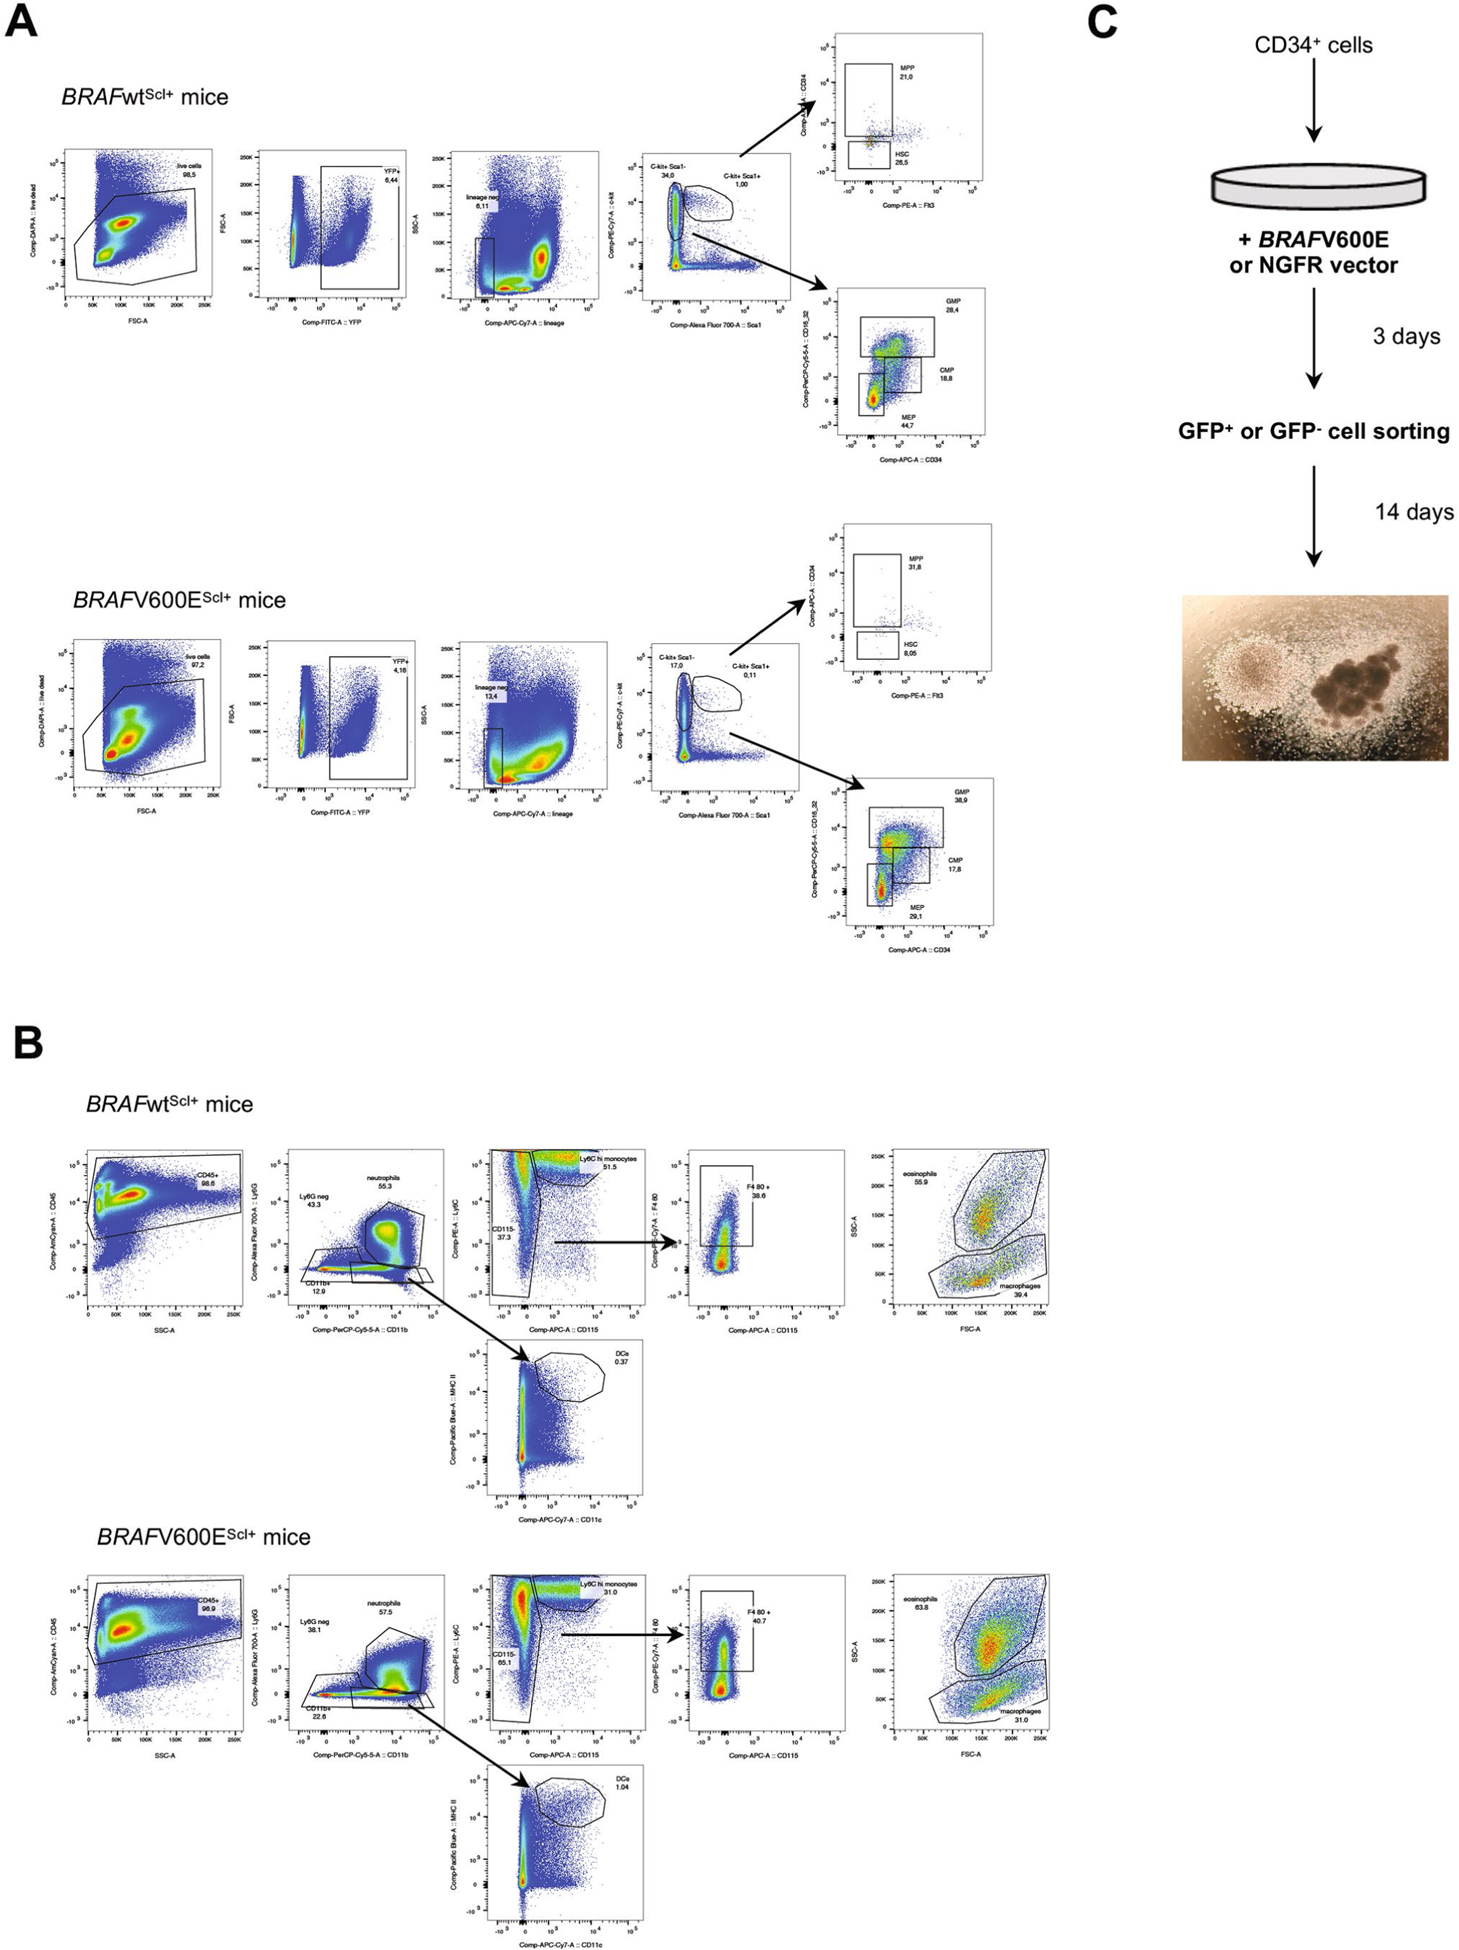
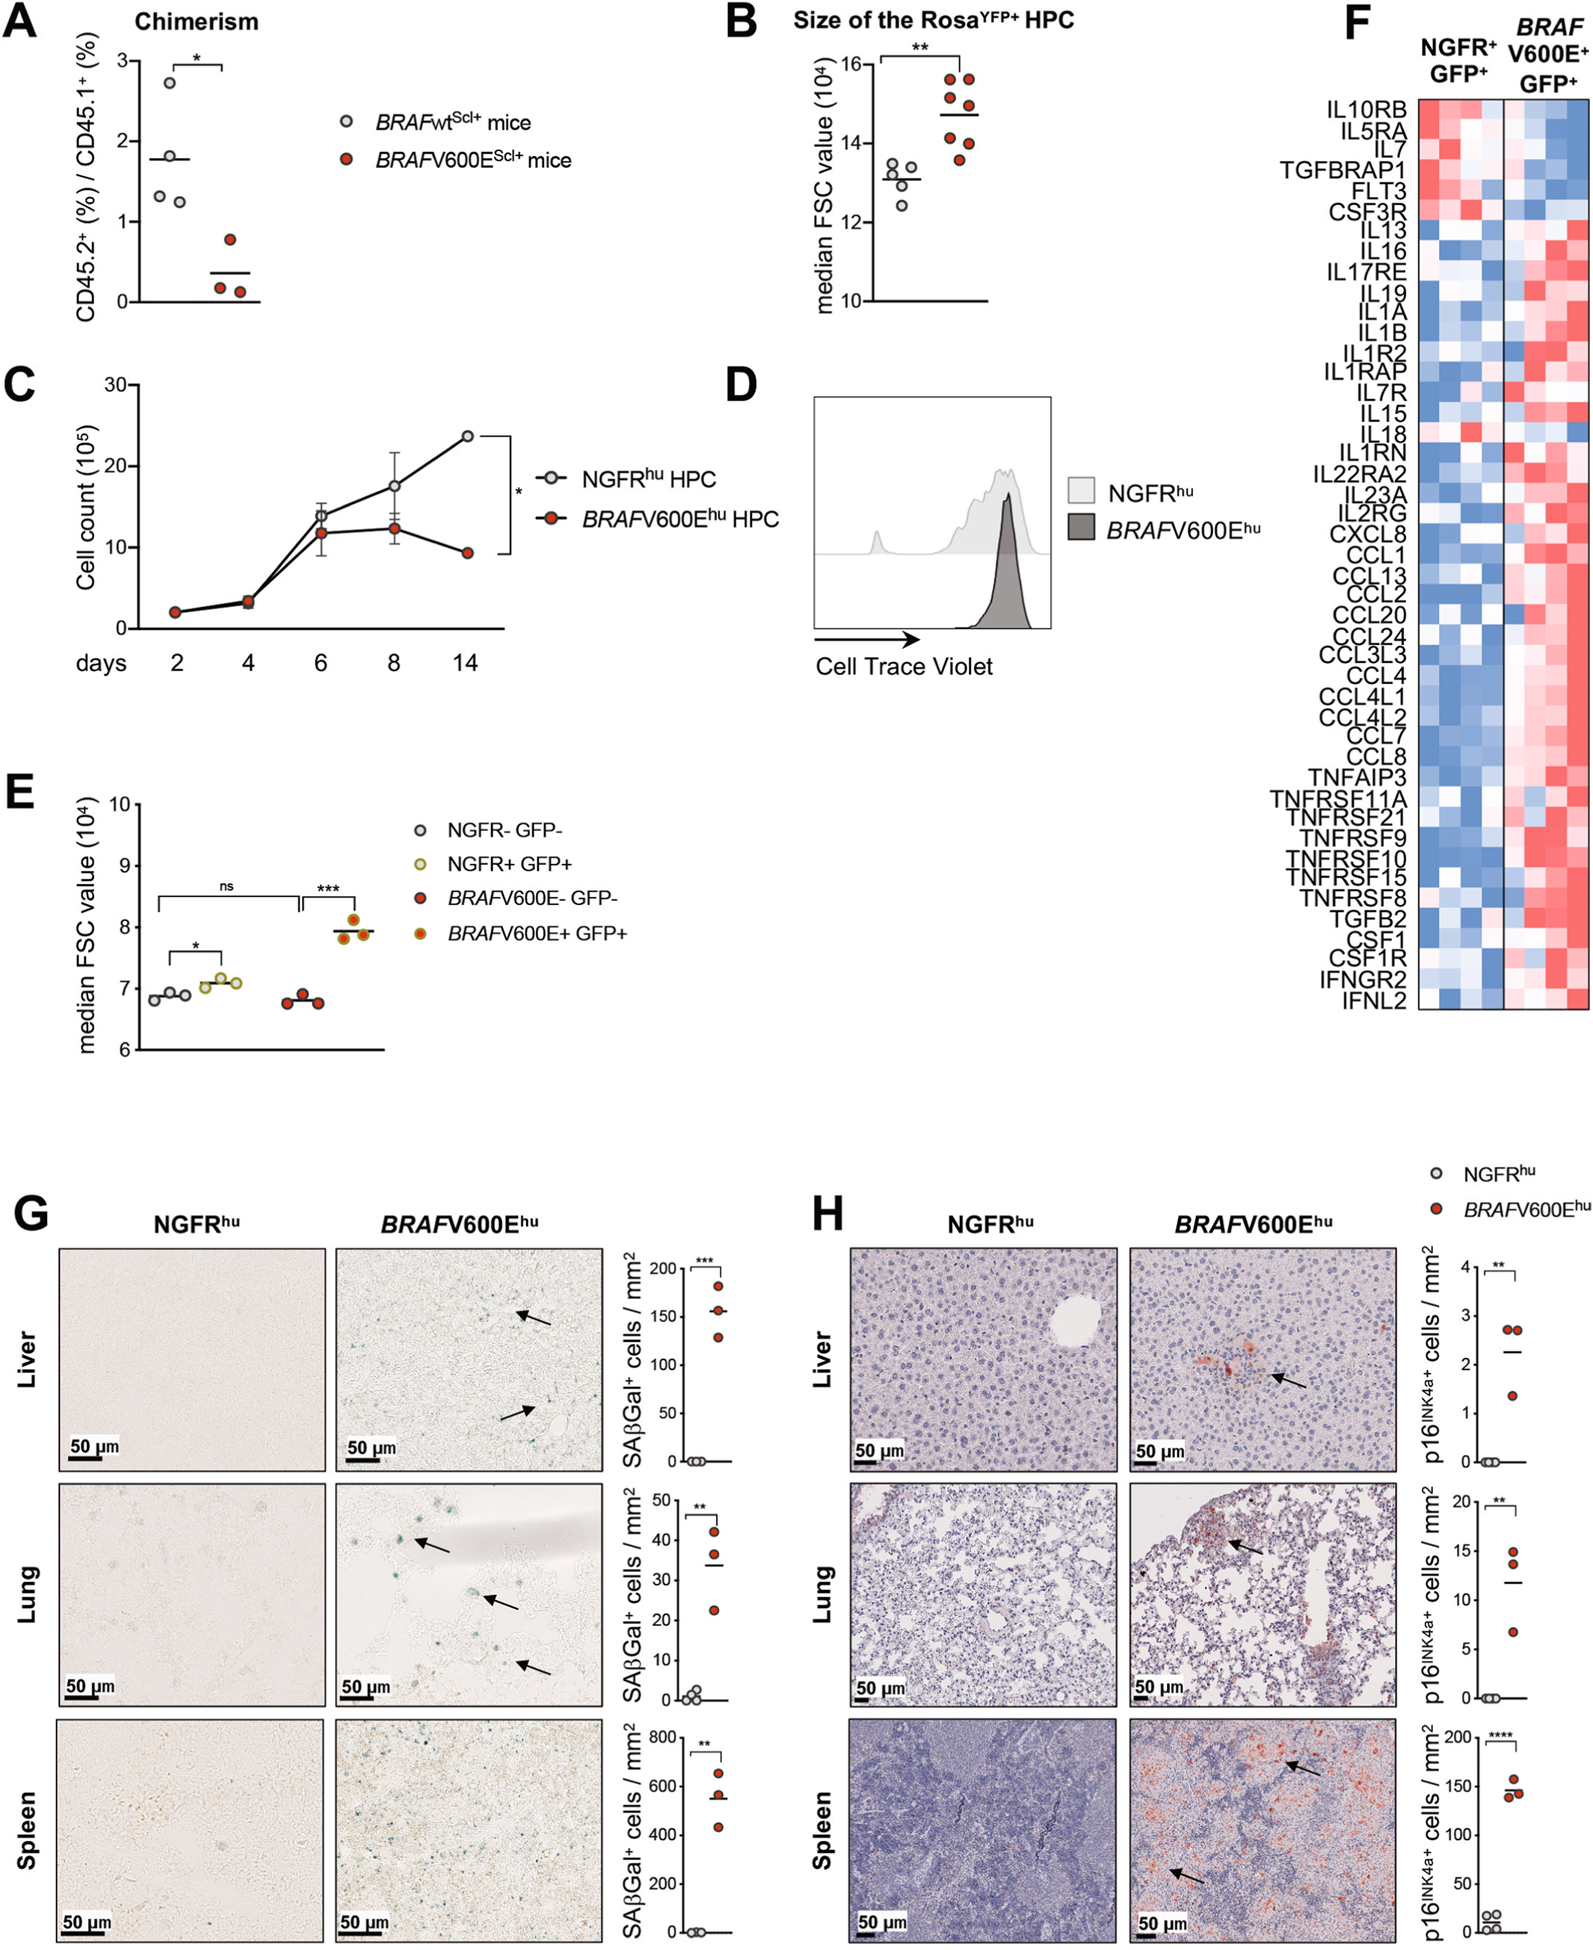
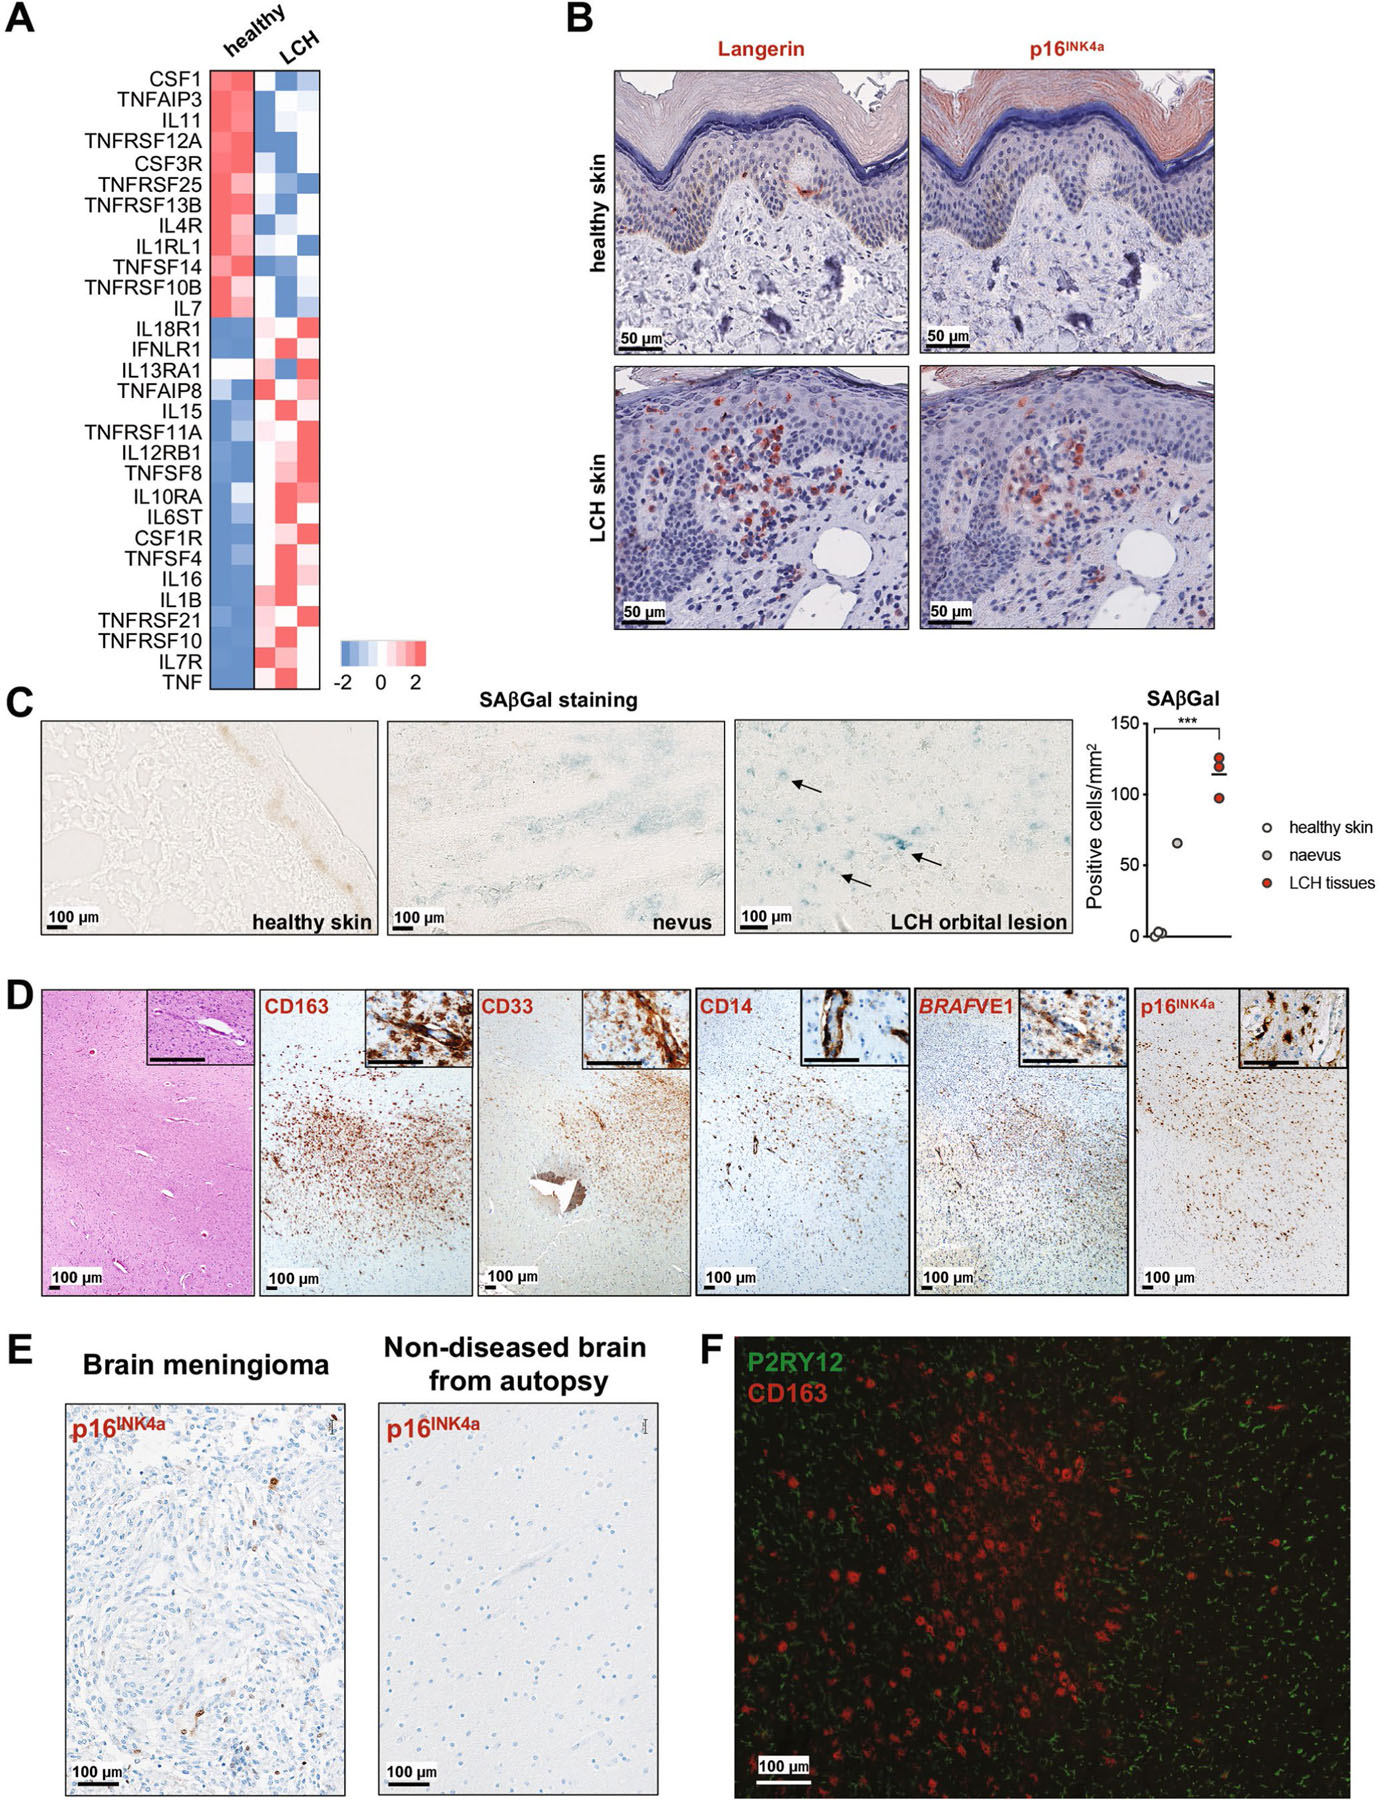
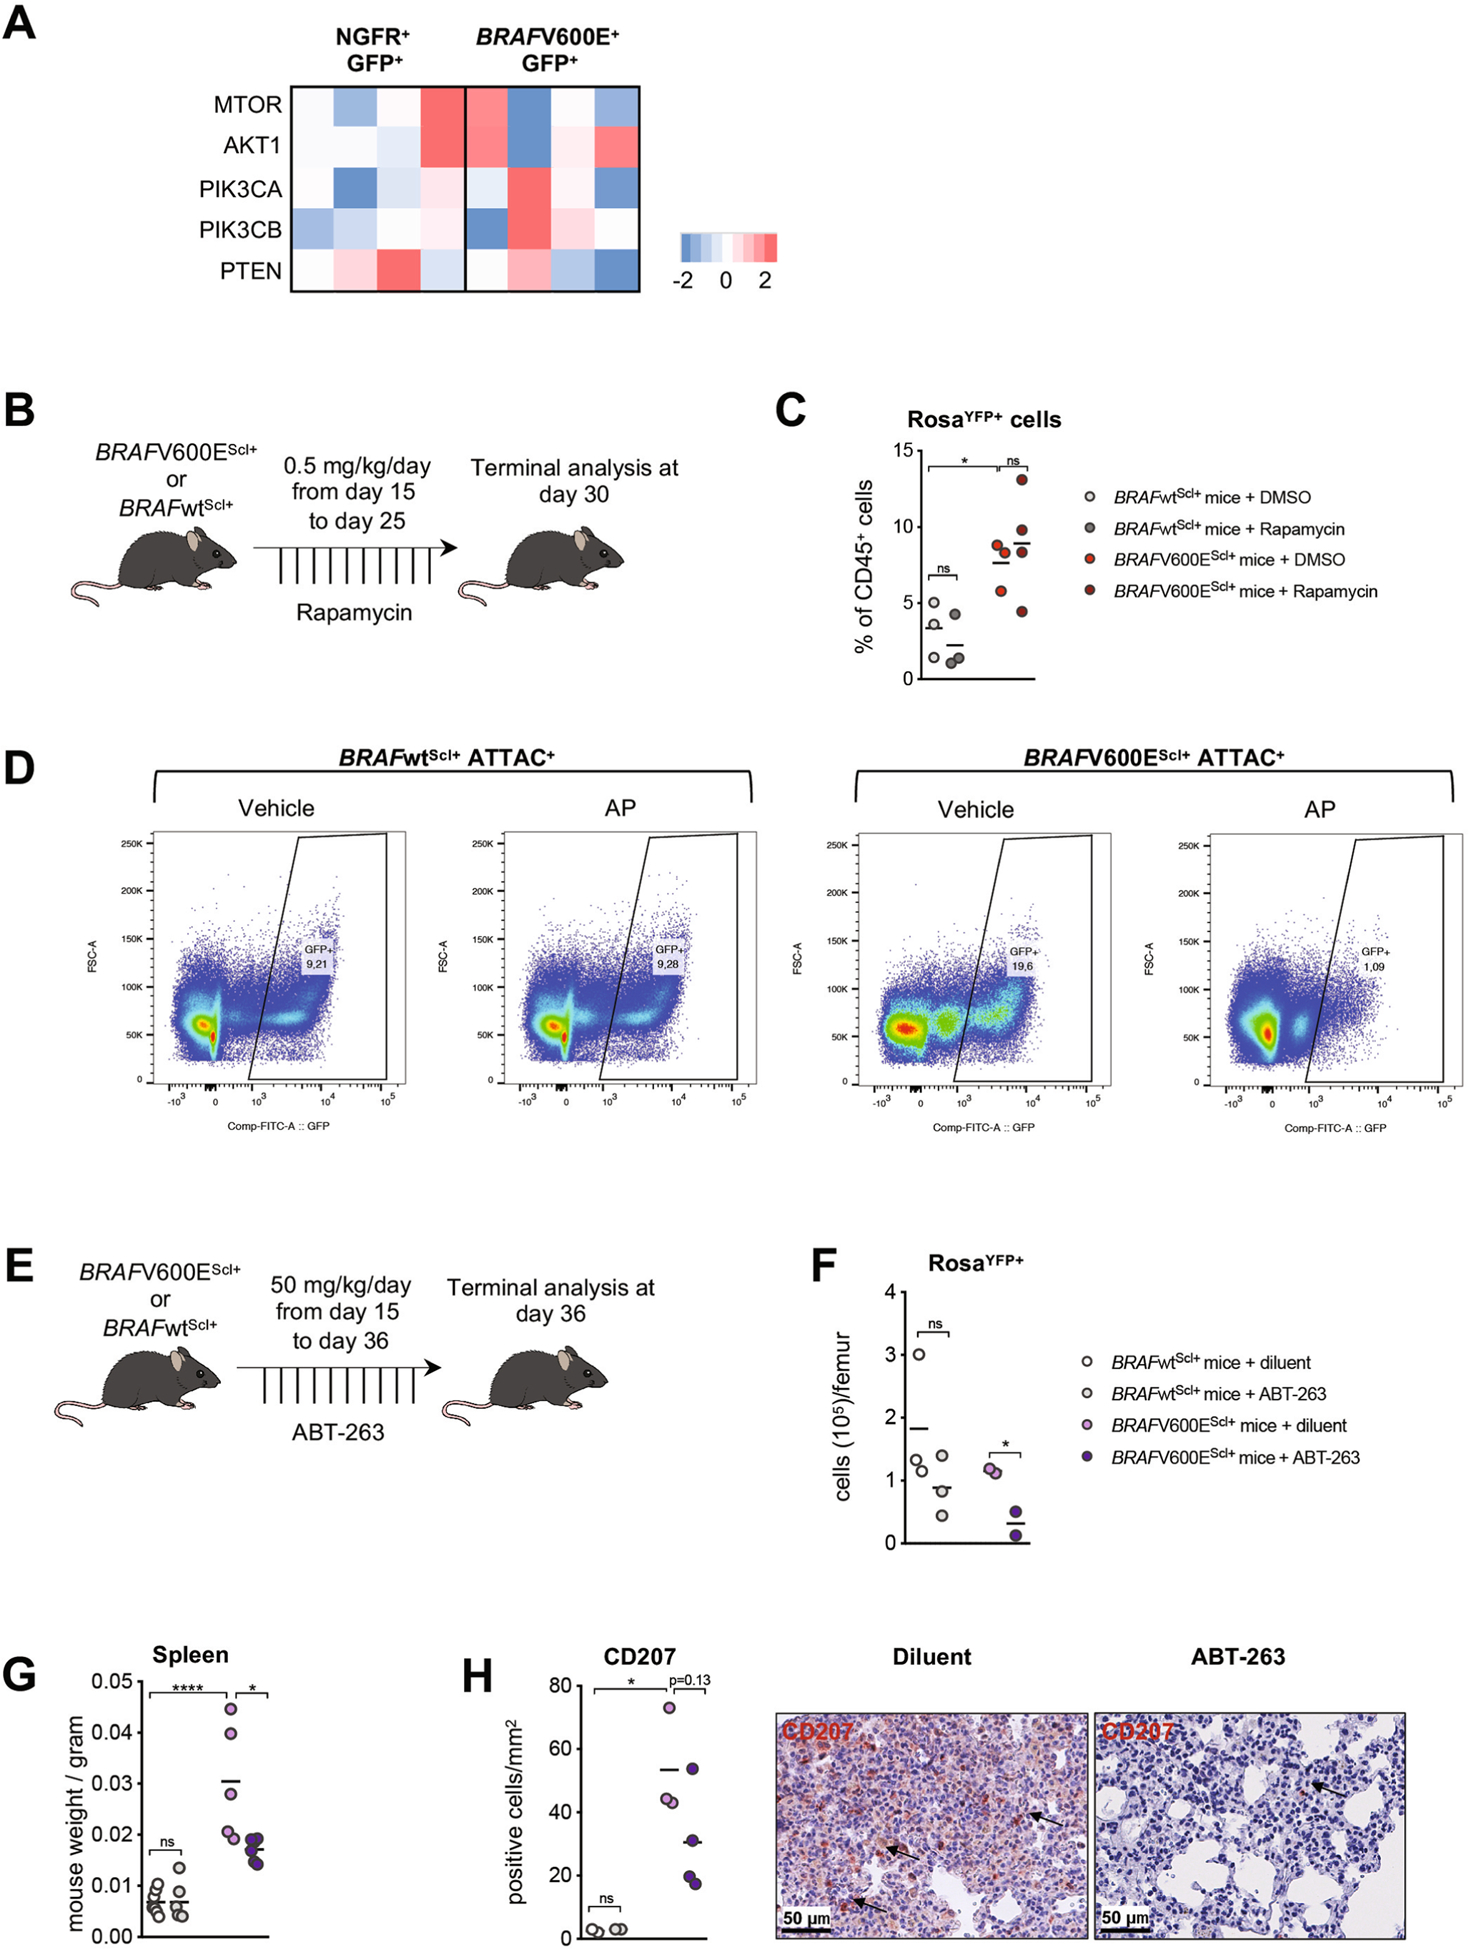
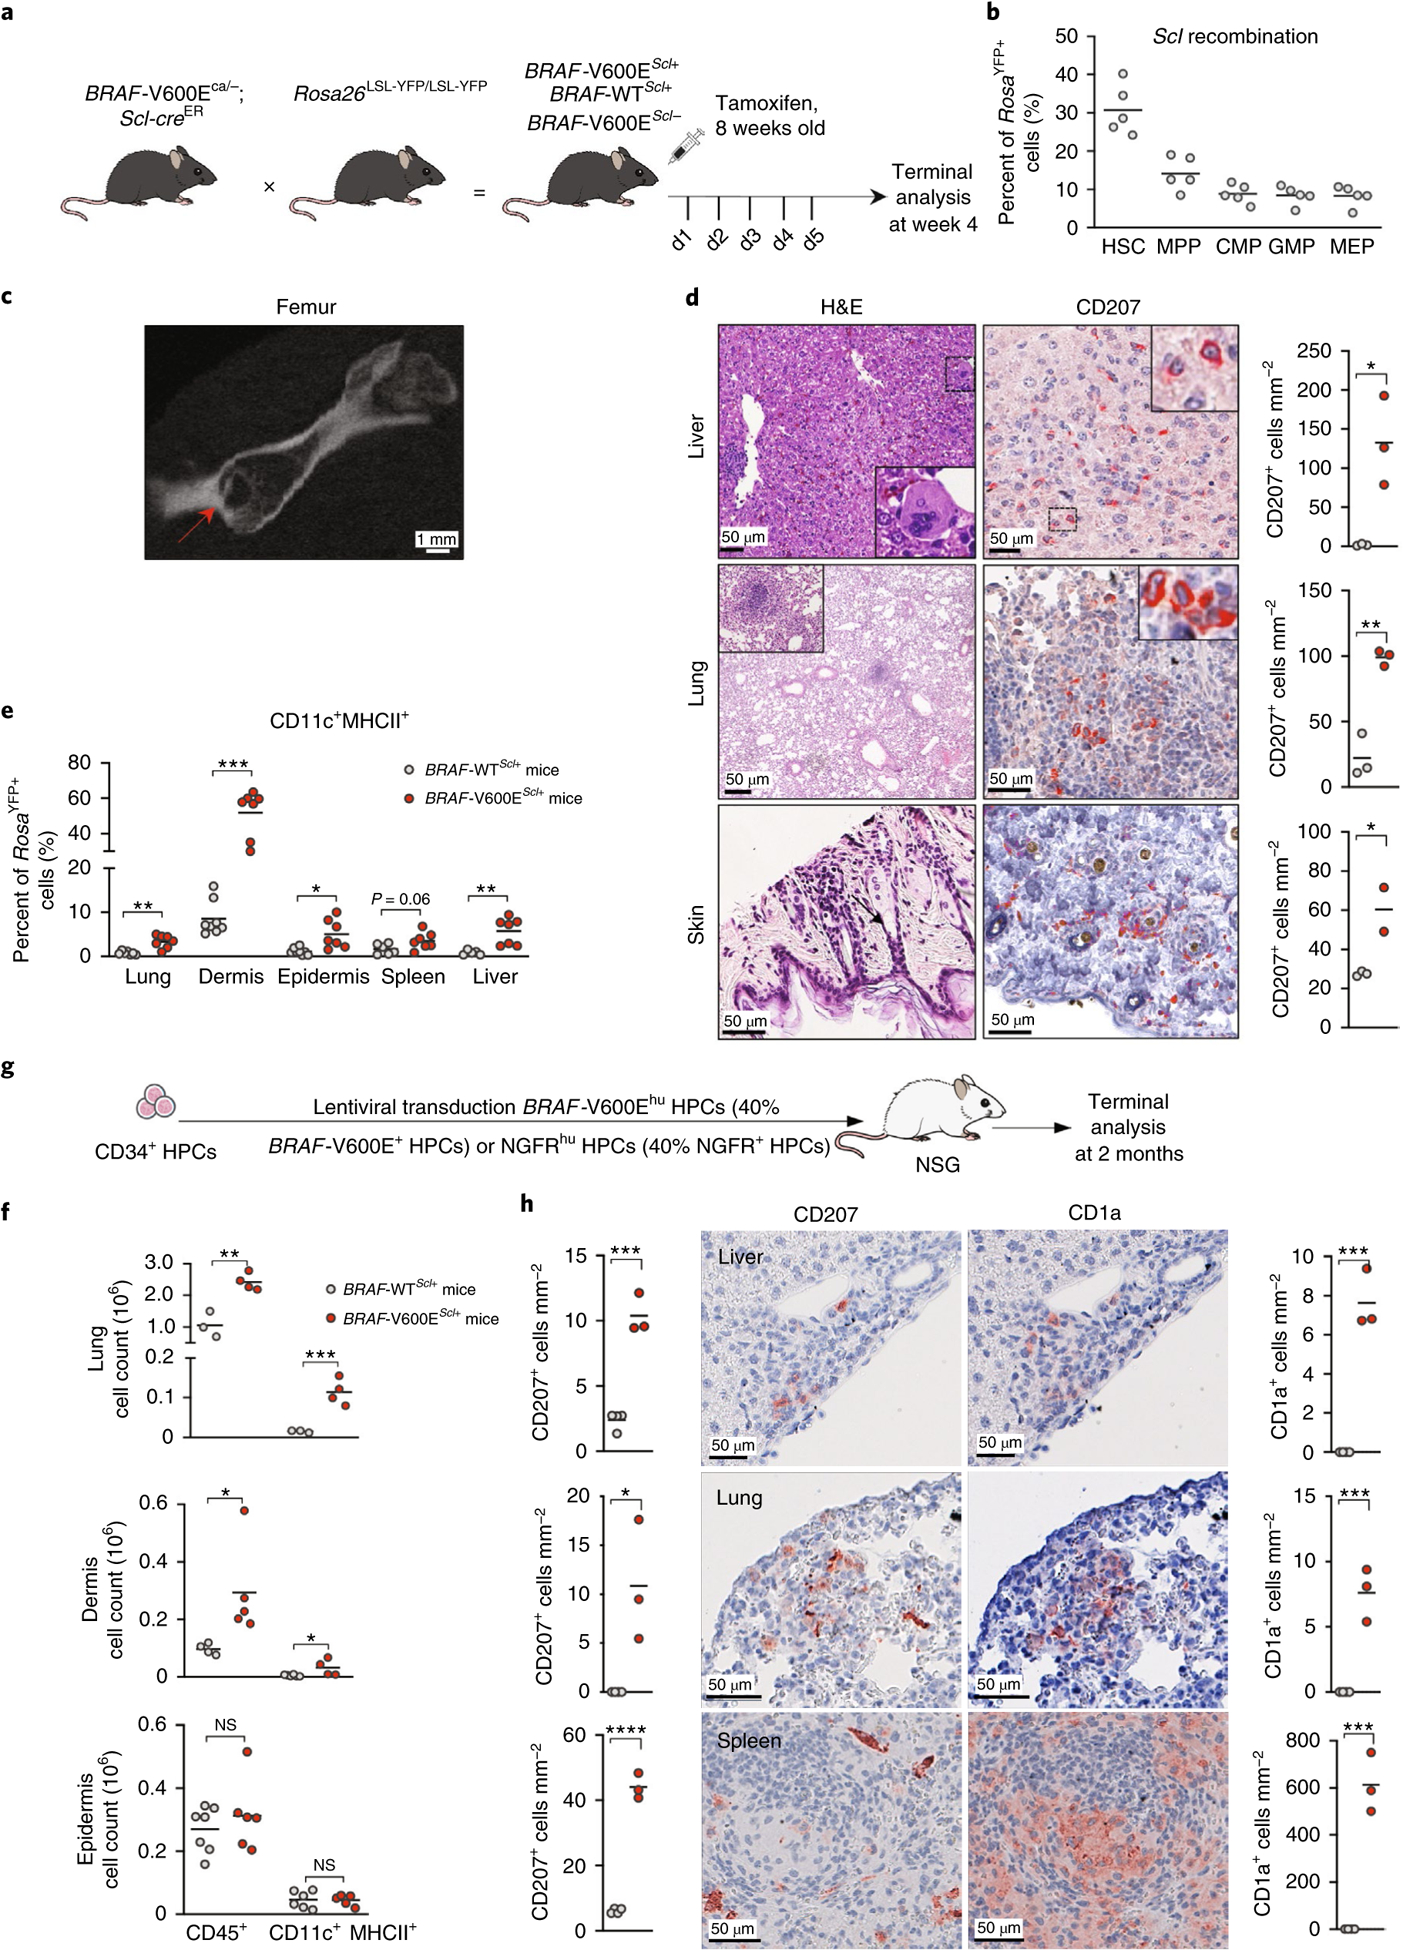
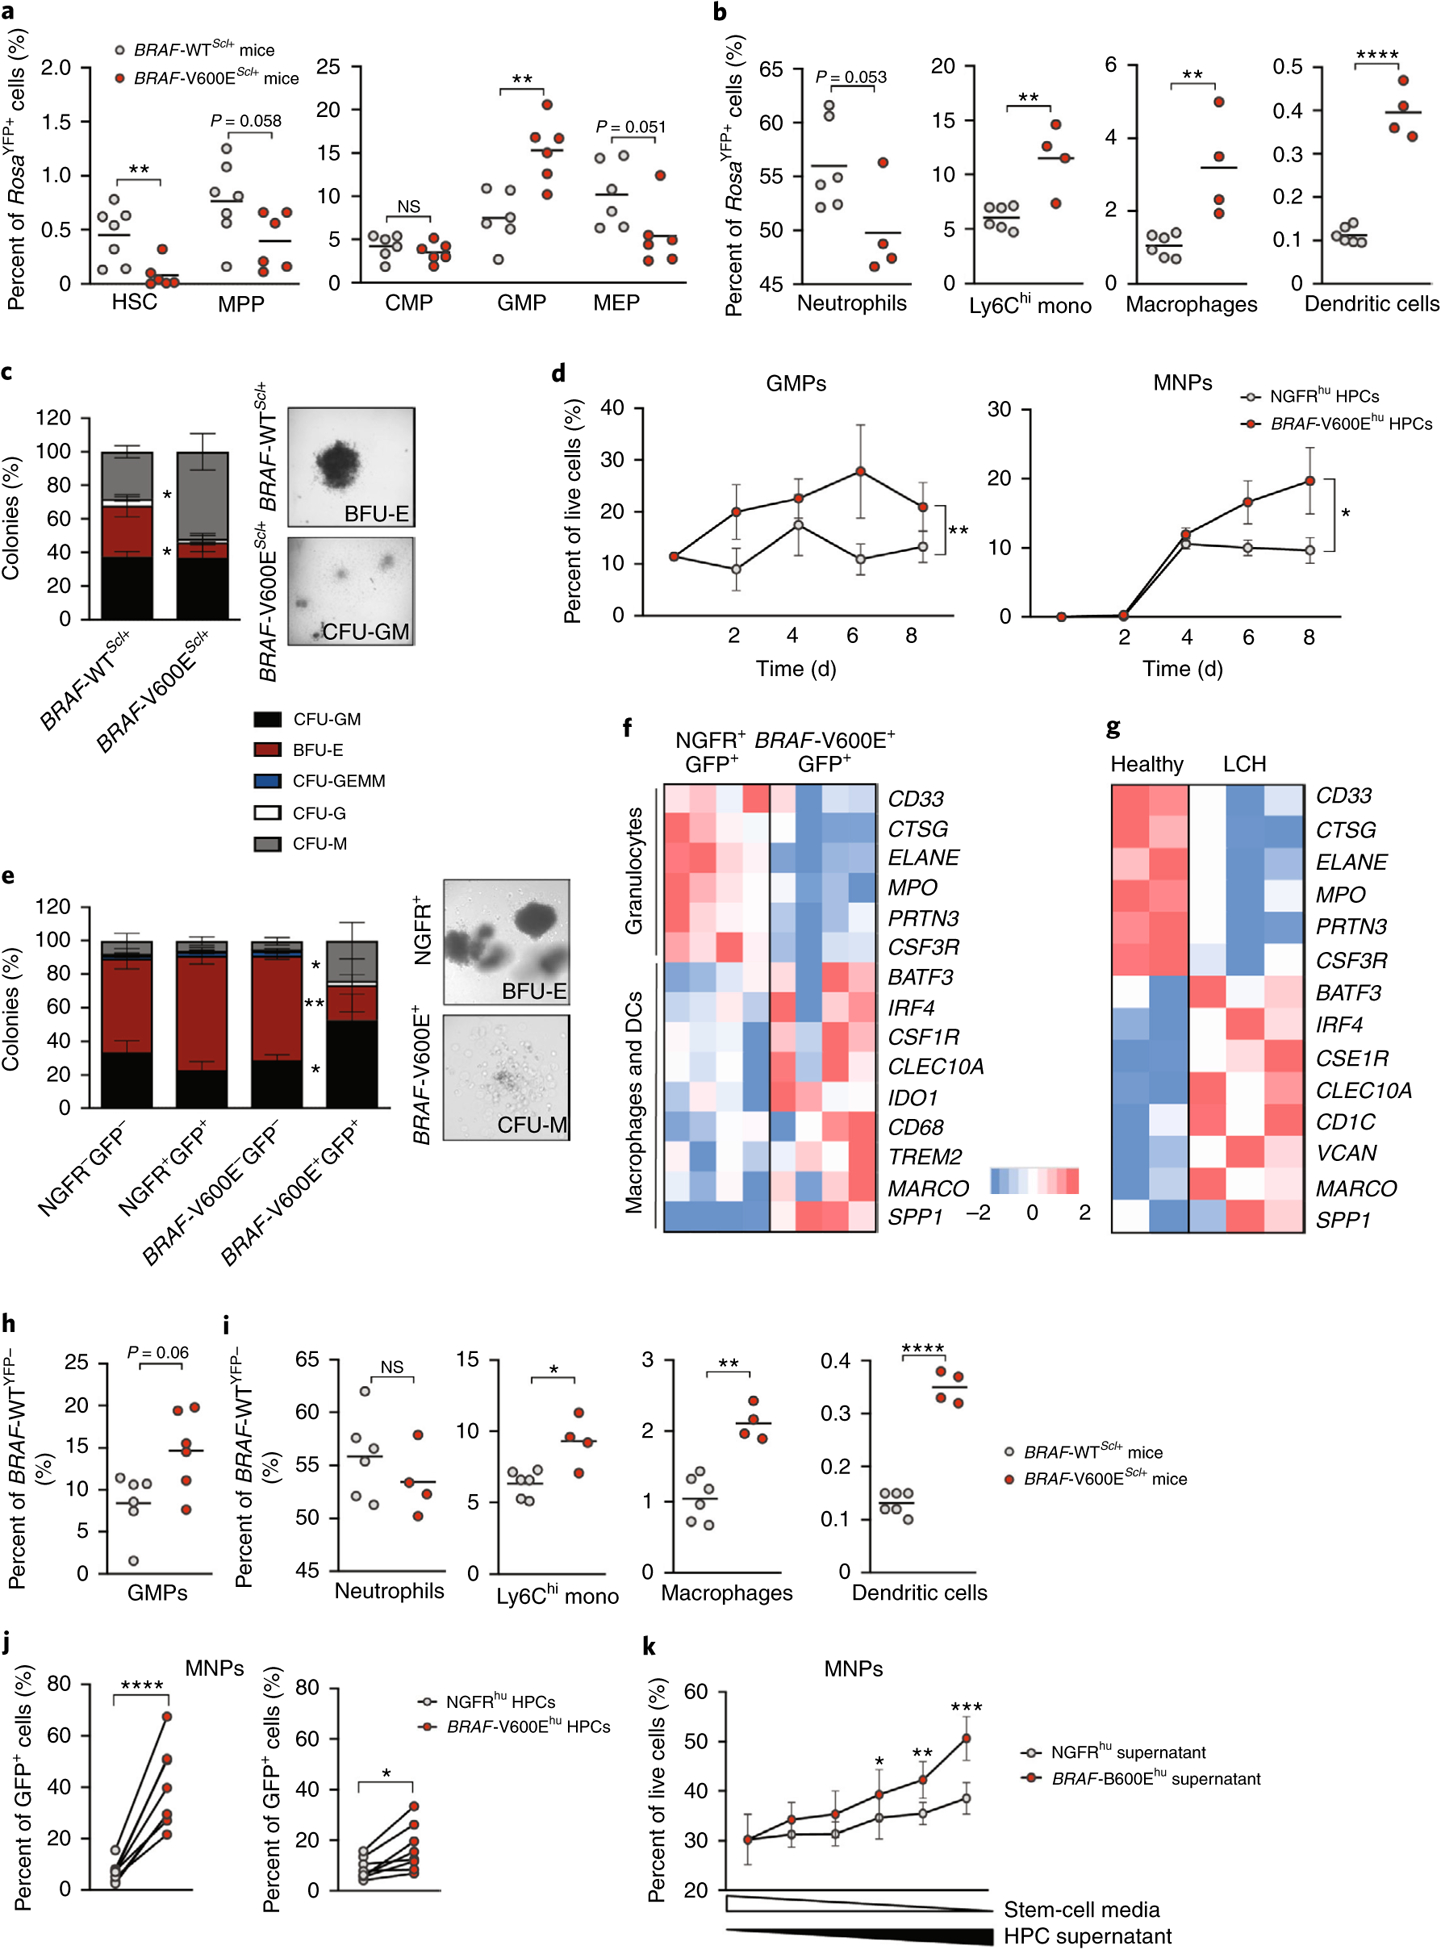
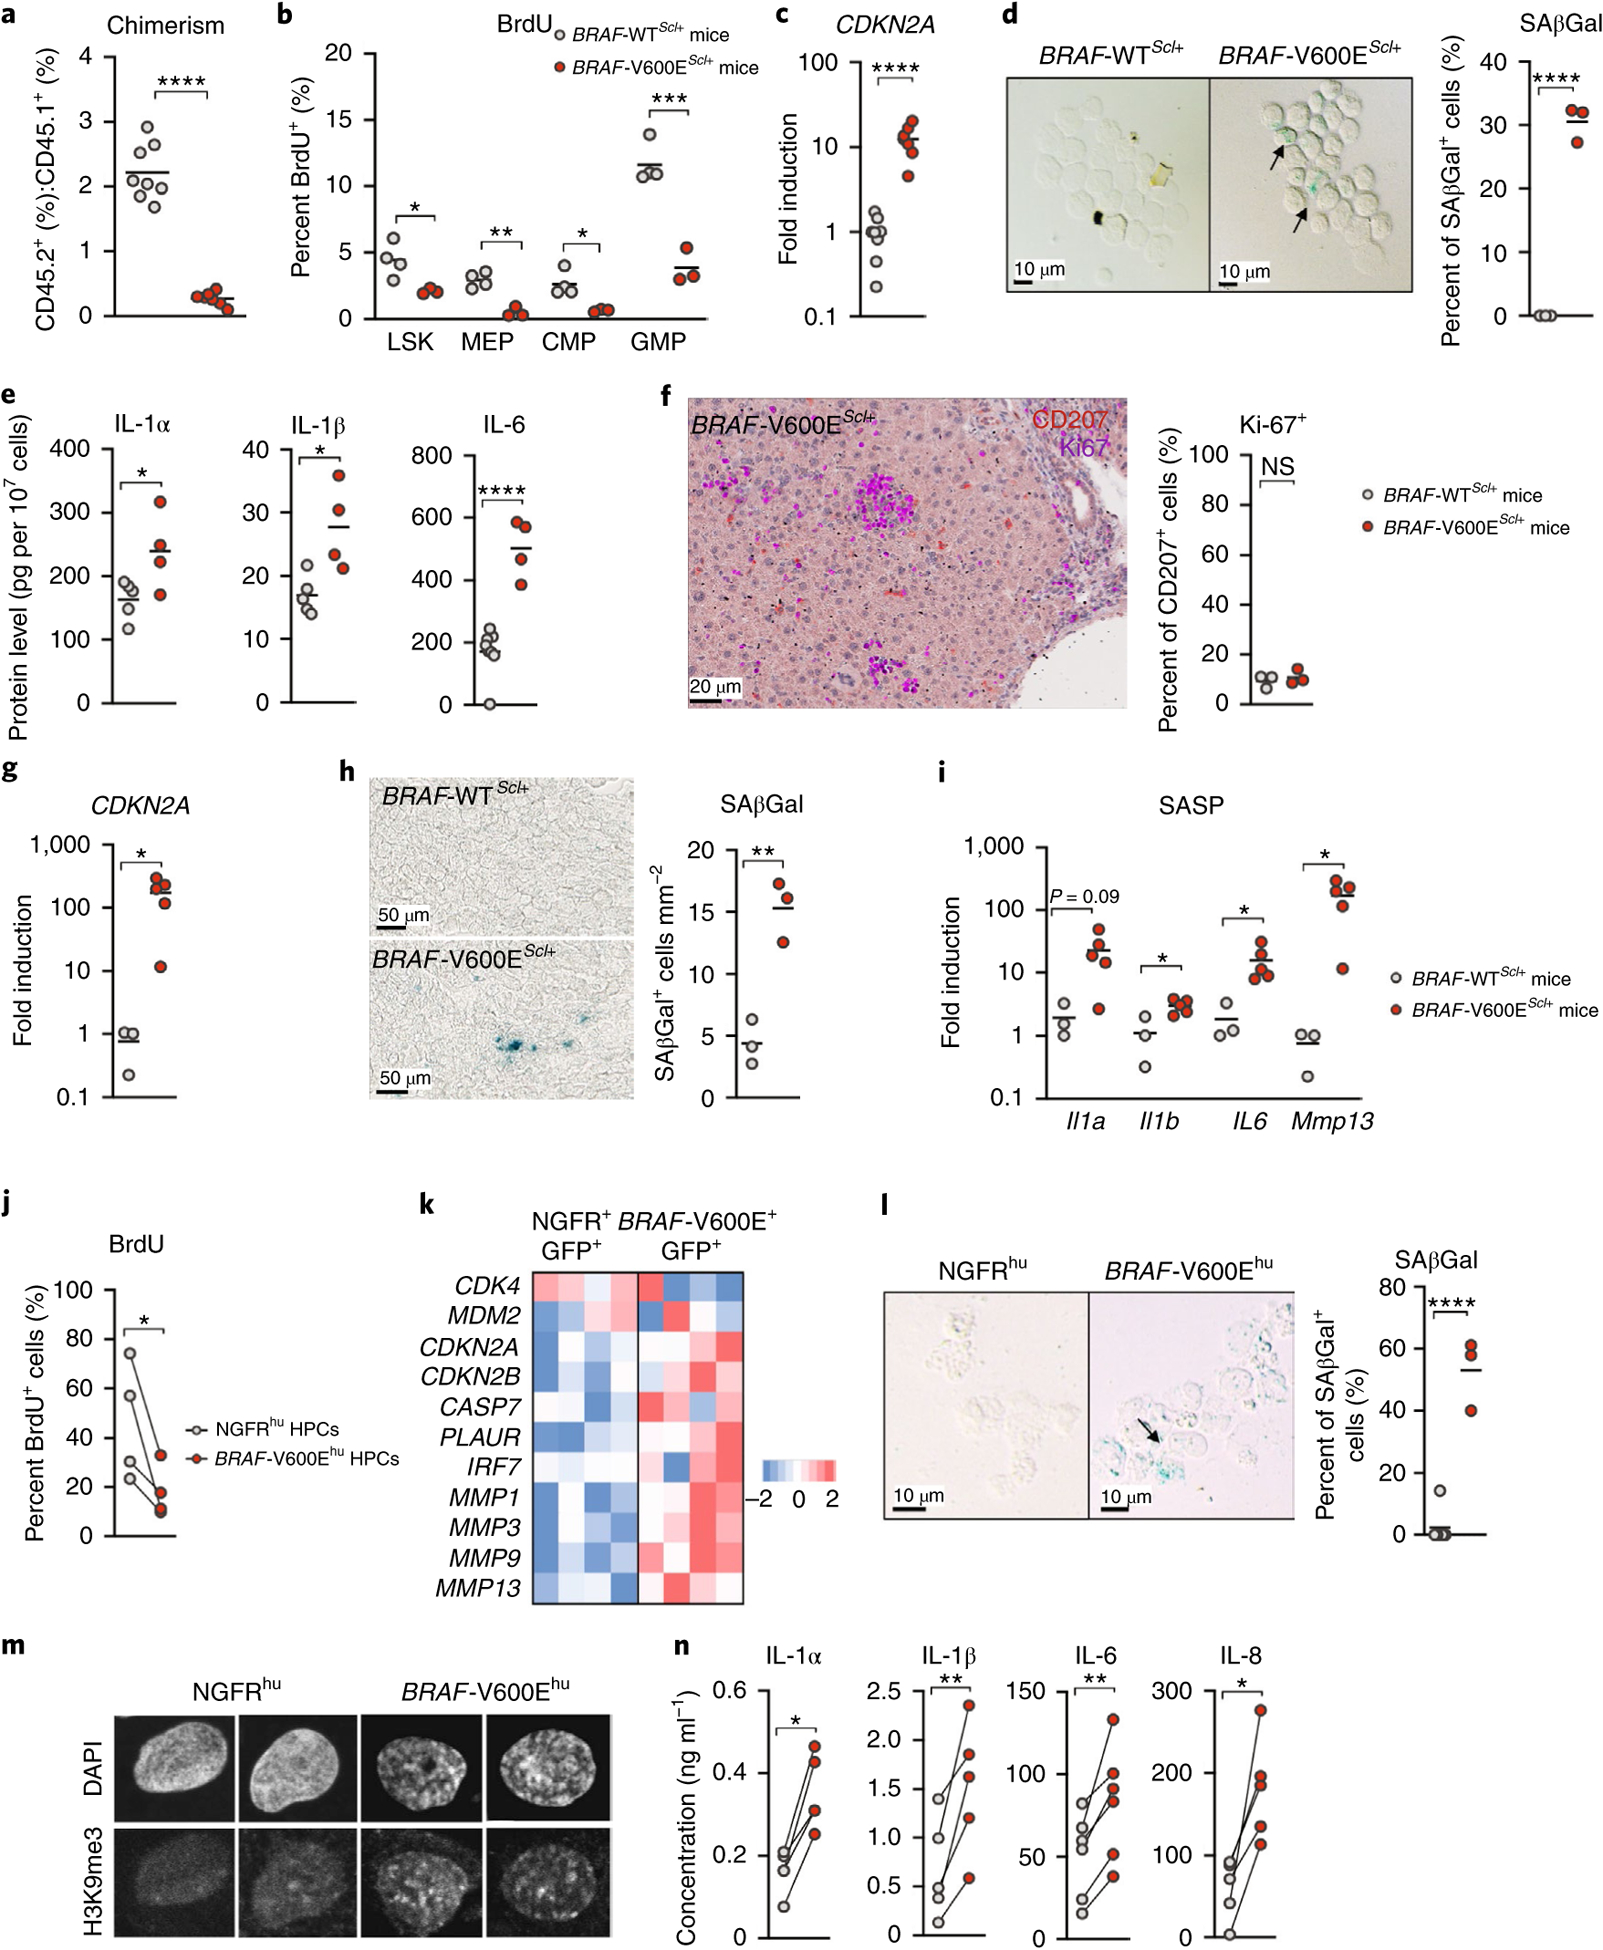
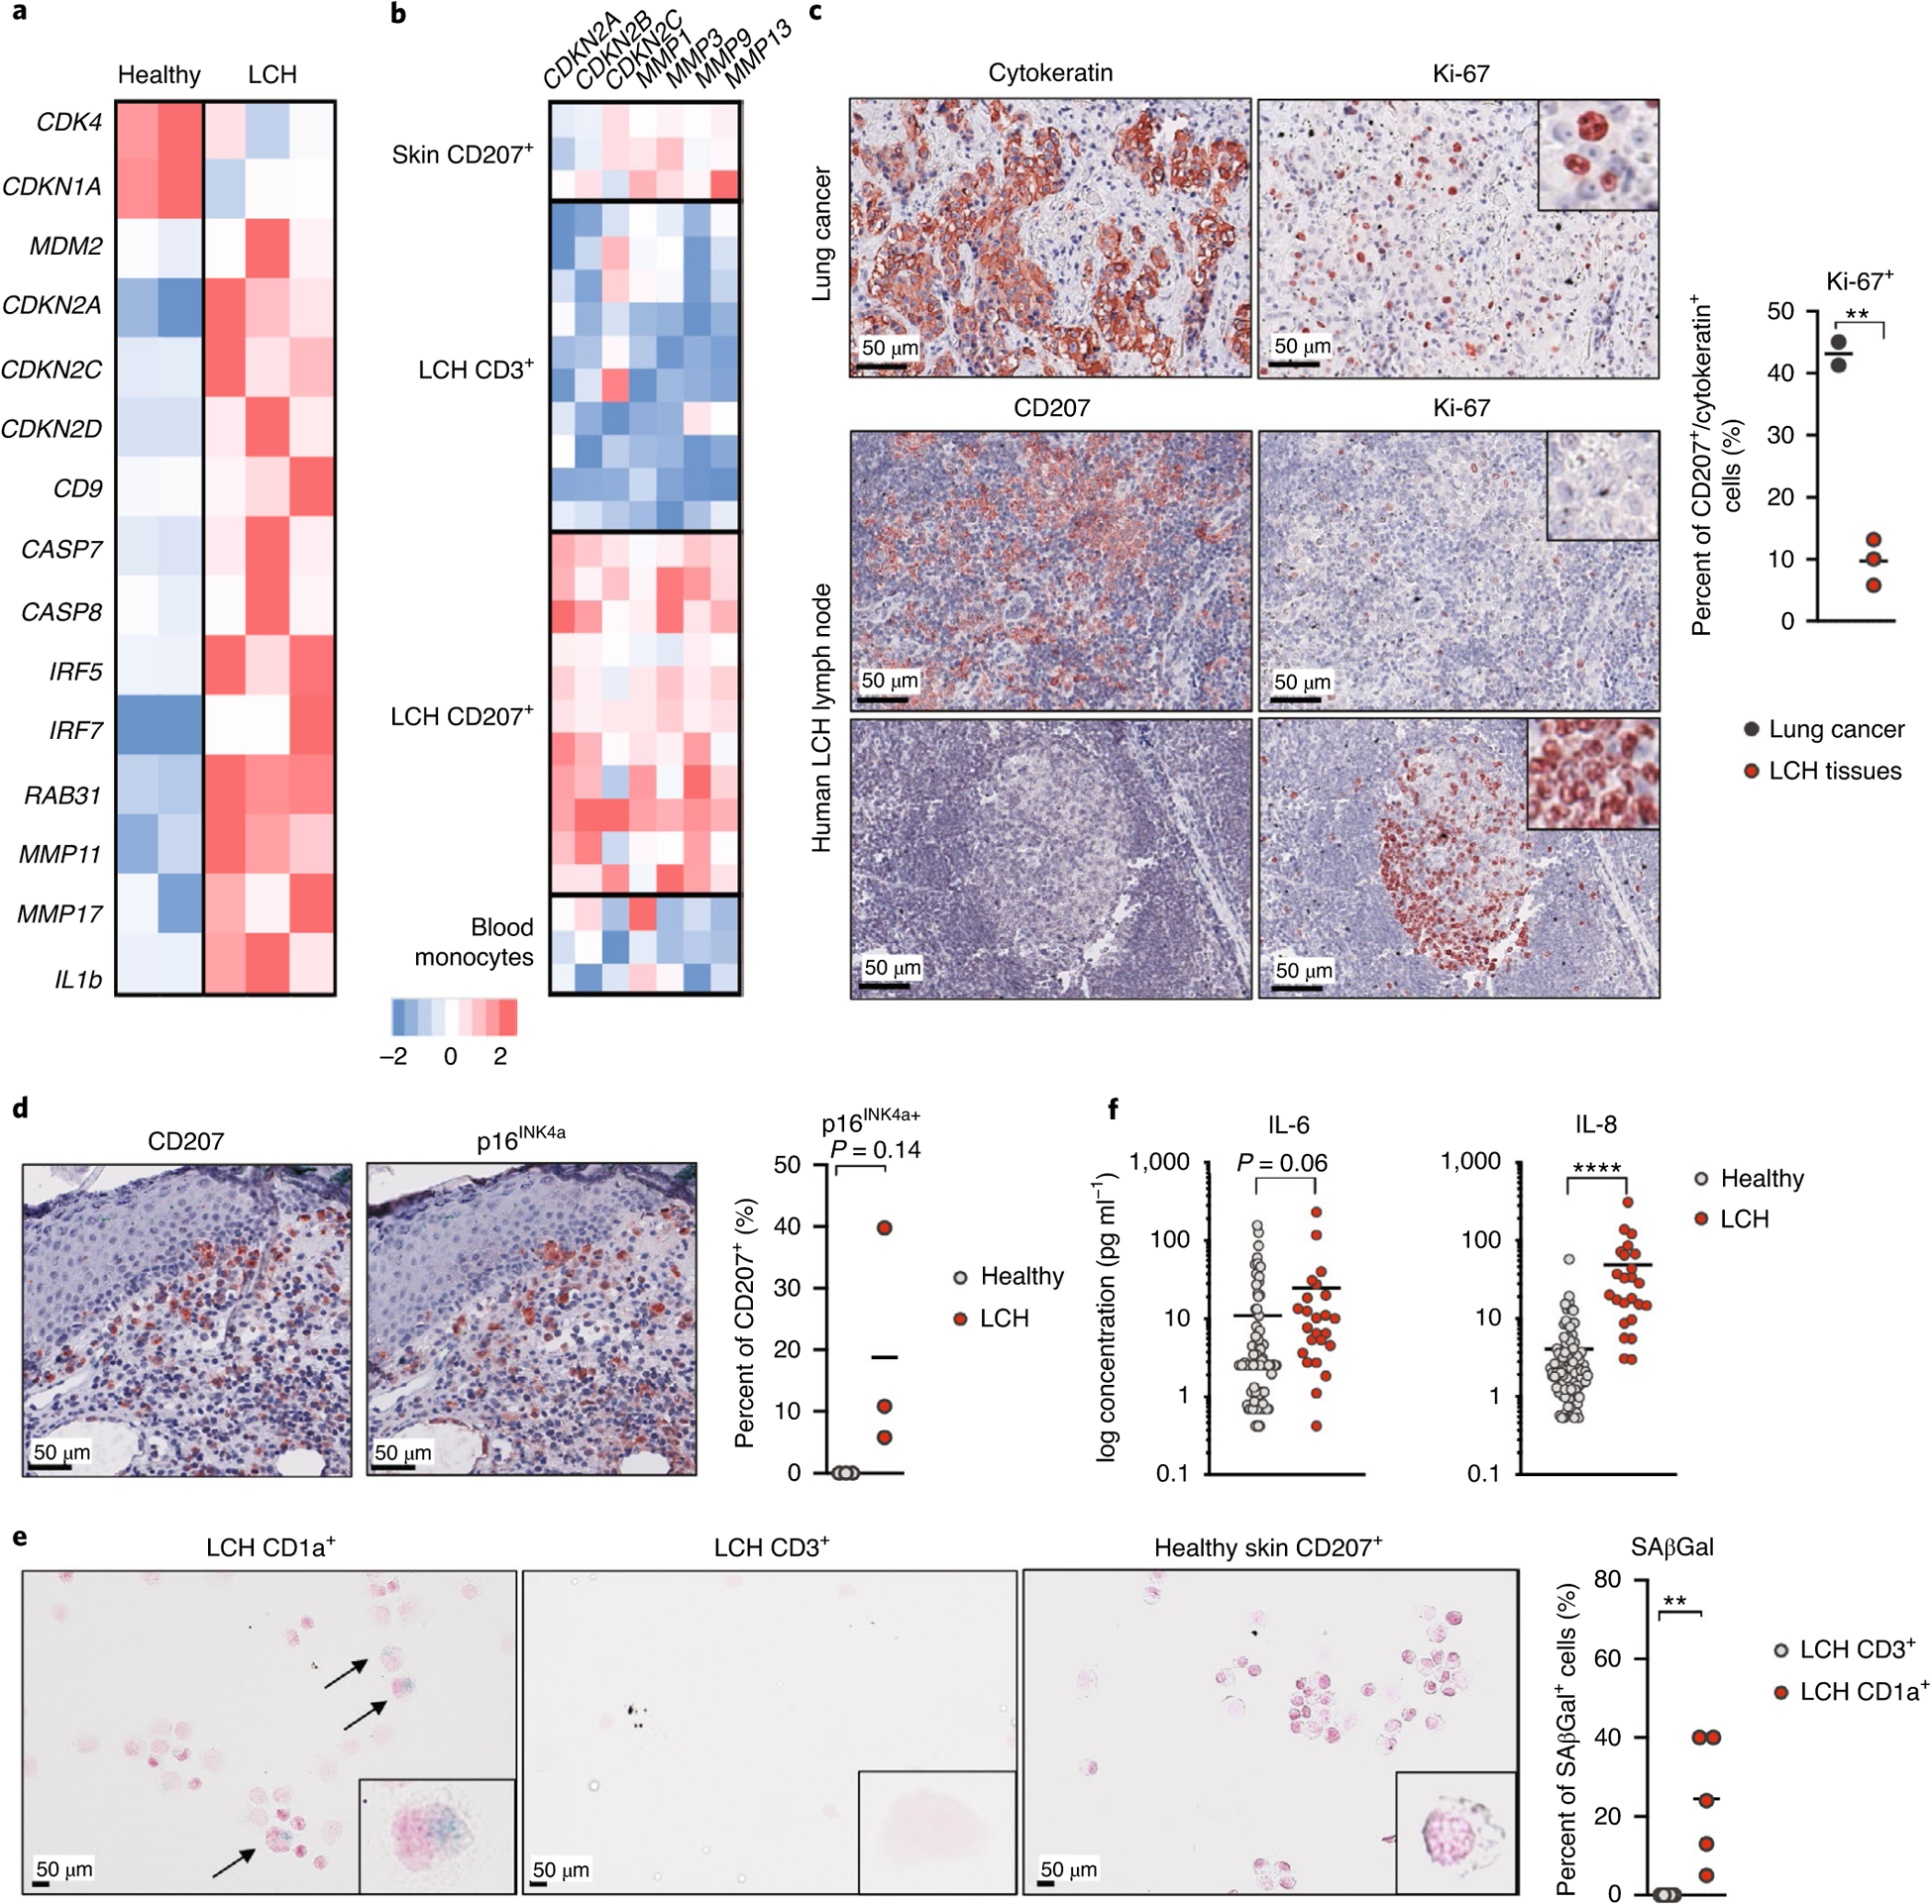
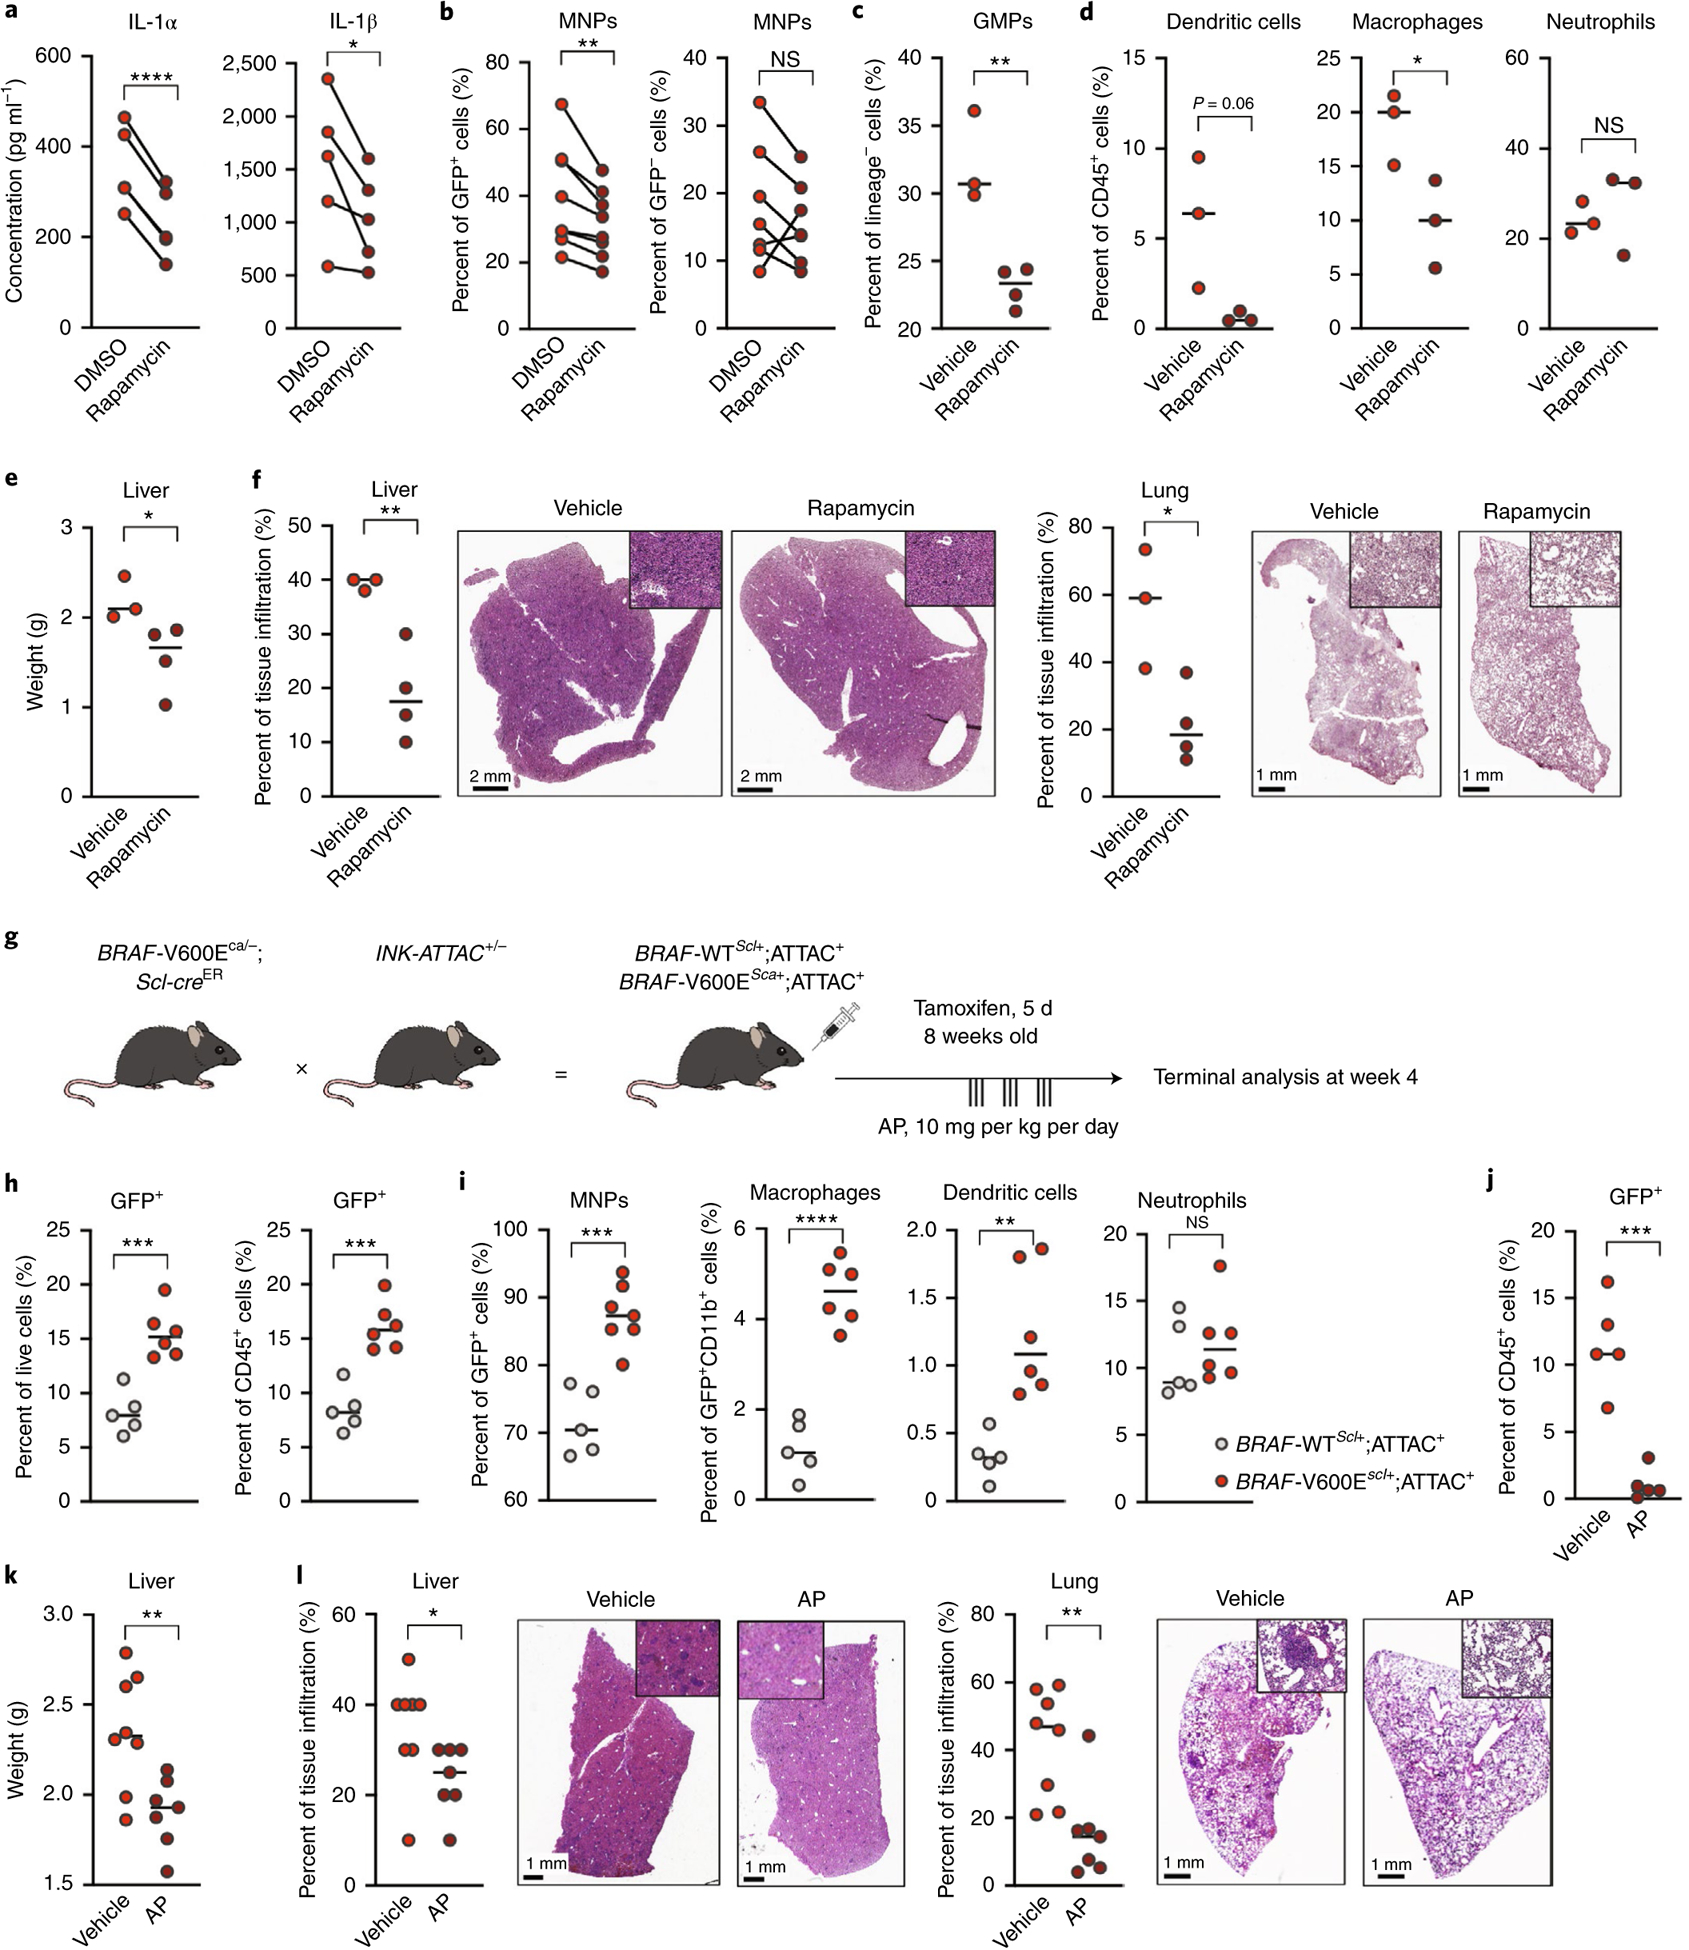
Langerhans cell histiocytosis (LCH) is a potentially fatal condition characterized by granulomatous lesions with characteristic clonal mononuclear phagocytes (MNPs) harboring activating somatic mutations in mitogen-activated protein kinase (MAPK) pathway genes, most notably BRAFV600E. We recently discovered that the BRAFV600E mutation can also affect multipotent hematopoietic progenitor cells (HPCs) in multisystem LCH disease. How the BRAFV600E mutation in HPCs leads to LCH is not known. Here we show that enforced expression of the BRAFV600E mutation in early mouse and human multipotent HPCs induced a senescence program that led to HPC growth arrest, apoptosis resistance and a senescence-associated secretory phenotype (SASP). SASP, in turn, promoted HPC skewing toward the MNP lineage, leading to the accumulation of senescent MNPs in tissue and the formation of LCH lesions. Accordingly, elimination of senescent cells using INK-ATTAC transgenic mice, as well as pharmacologic blockade of SASP, improved LCH disease in mice. These results identify senescent cells as a new target for the treatment of LCH.


Conflict of interest statement

Competing interests

The authors declare no competing interests.

Figures

Extended Data Fig. 1 |
Extended Data Fig. 1 |. Langerhans Cell Histiocytosis mouse models.
a-f, BRAFV600EScl+ mice and BRAFwtScl+ mice were generated as described in Fig. 1a. a, Representative images of spleen, lung, and femurs at 4 weeks post tamoxifen injections. b, Liver and spleen weights. c, Absolute number of BM cells in BRAFV600EScl+ mice and control littermates (n = 10 mice per group). d, Hematoxylin and eosin staining and CD207 immunohistochemistry staining of tissues isolated from BRAFwtScl+ mice (n = 2–3 mice per group). e, Absolute numbers of lung, dermal and epidermal immune cells in BRAFV600EScl+ mice and control littermates. Data are representative of 3 experiments (n = 3–8). f, Percentage of immune cell populations among lung and skin infiltrating RosaYFP+ cells in BRAFV600EScl+ mice and control littermates. Data are representative of 3 experiments (n = 3–8). g, Scheme of the lentiviral vector constructs used to transduce human CD34+ HPC. h, Graph shows that the transduction efficiency of BRAFV600E and NGFR lentiviral constructs in human CD34+ HPC does not exceed 40 %. i, Western blot of BRAF and phospho-ERK performed on purified BRAFV600Ehu and NGFRhu human CD34+ HPC 7 days after transduction. j, Representative flow plot showing the percentage of CD11c+ CD14+ MNP among circulating blood cells in NSG mice reconstituted with BRAFV600Ehu and NGFRhu HPC. Graph represents the percentage of CD11c and or CD14+ cells among human CD45+ cells from NSG circulating blood (n = 2–3 mice per group). Data are represented as mean ± s.e.m; statistical significance analyzed by an unpaired two-sided t-test is indicated by *p < 0.05; **p < 0.01; ***p < 0.001; ****p < 0.0001.
Extended Data Fig. 2 |
Extended Data Fig. 2 |. Myeloid skewing of BRAFV600E+ hematopoietic progenitors.
a, Flow cytometry gating strategy for hematopoietic progenitors (HSC: hematopoietic stem cell, MPP: multipotent progenitors, GMP: Granulocyte-macrophage progenitors, CMP: common myeloid progenitors, MEP: megakaryocyte-erythroid progenitors) in BRAFwtScl+ and BRAFV600EScl+ animals. b, Flow cytometry gating strategy for bone marrow myeloid cells in BRAFwtScl+ and BRAFV600EScl+ animals. c, Experimental design of the CFU assays performed in Fig. 2e is shown.
Extended Data Fig. 3 |
Extended Data Fig. 3 |. Senescence program in different LCH models.
a, Lineage negative BM cells isolated from either BRAFV600EScl+ CD45.2+ or BRAFwtScl+ CD45.2+ mice were injected intravenously together with lineage negative CD45.1+ BM cells into lethally irradiated CD45.1+ mice at a 2:1 ratio (CD45.2+: CD45.1+). Graph shows the ratio of CD45.2+ / CD45.1+ in blood circulation in each group measured 8 weeks after transplantation using flow cytometry (n = 8). b, Forward scatter measurement of lineage negative RosaYFP+ cells in the BM from BRAFV600EScl+ mice and BRAFwtScl+ control littermates (n = 5–7 mice per group). c, Expansion of human CD34+ cord blood HPC transduced with NGFR (NGFRhu) or BRAFV600E (BRAFV600Ehu) lentiviral constructs and cultured in stem-cell media. Data are representative of at least 3 experiments (n = 3 donors). d, Proliferation capacity of NGFRhu and BRAFV600Ehu HPC analyzed by Cell Trace Violet dilution, 92 hours after staining. e, Forward scatter measurement of NGFRhu and BRAFV600Ehu HPC (n = 3 different donors) f, Heat map representation of SASP genes analyzed by microarray expression profiling of BRAFV600E+ GFP+ HPC and NGFR+ GFP+ HPC 7 days after transduction (n = 4 different donors). g-h, Frozen or FFPE tissue sections isolated from humanized mice reconstituted with BRAFV600Ehu and NGFRhu HPC and stained for g, SAβGal activity or (h) p16INK4a. Graph shows the number of positive cells per mm2. Data are represented as mean ± s.e.m; *p < 0.05; **p < 0.01; ***p < 0.001; ****p < 0.0001 (unpaired two-sided t-tests, two-way ANOVA test for Extended Data Fig. 2c).
Extended Data Fig. 4 |
Extended Data Fig. 4 |. Human LCH lesions show features of senescence.
a, Heat map representation of SASP associated gene expression measured by RNA sequencing in purified CD34+ BM cells isolated from three LCH patients and one age-matched healthy donor (performed as duplicates). b, Skin from LCH patient and healthy age-matched donor were stained for CD207 and p16INK4a by immunohistochemistry. c, SAβGal activity of human tissues and LCH lesions. One representative image of healthy skin, naevus and LCH lesion are shown. Graph shows the number of SAβGal positive cells per mm2 in healthy skins (n = 3), naevus (n = 1) and LCH lesions (n = 3). d, Autopsy brain sections from a patient with neurodegenerative-LCH and circulating BRAFV600E+ peripheral blood cells. The H&E image shows a temporal lobe white matter injury with increased numbers of infiltrating plump cells. The immunohistochemical characterization of the enlarged plump cells shows a positivity for CD163, CD33, CD14, BRAFVE1 and p16INK4a. (*indicates perivascular space). e, Control tissue with rare p16INK4a positivity by immunohistochemistry in meningioma and no appreciable staining in human brain (non-diseased from autopsy). f, Brain section from human patient with neurodegenerative-LCH (see Fig. 4g) dual-stained for P2RY12 (green) and CD163 (red). Spindled P2RY12+ microglial cells surround the aggregates of plump activated CD163+ macrophages. There is no dual staining. There is diminished P2RY12 staining within the CD163+ macrophage rich aggregate. Image courtesy of Dr. Julia Kofler, MD UPMC Division of Neuropathology. Data are represented as mean ± s.e.m; statistical significance analyzed by an unpaired two-sided t-test is indicated by *p < 0.05; **p < 0.01; ***p < 0.001; ****p < 0.0001.
Extended Data Fig. 5 |
Extended Data Fig. 5 |. Rapamycin and senolytic treatments improve LCH outcome.
a, Human CD34+ cord blood HPC were transduced with BRAFV600E (BRAFV600Ehu) or NGFR control (NGFRhu) lentiviral vectors, cultured in stem-cell media and analyzed for gene expression of PI3K pathway genes using microarray expression profiling 7 days after transduction (n = 4 donors); b-c, BRAFV600EScl+ mice and BRAFwtScl+ control littermates were treated with rapamycin (0.5 mg/ kg body weight/ day) or DMSO for 10 days. b, Cartoon shows the experimental design to test the clinical benefit of rapamycin on LCH in mice. b, Graph shows the percentage of RosaYFP+ cells among CD45+ BM cells (n = 3–4 mice per group). d, BRAFV600EScl+ ATTAC+ mice and BRAFwtScl+ ATTAC+ control littermates were treated by tamoxifen for five days. Following tamoxifen injections, BRAFV600EScl+ ATTAC+ mice and BRAFwtScl+ ATTAC+ control littermates were treated by AP or vehicle during three weeks and sacrificed 4 weeks after tamoxifen injections. Representative flow plot showing the percentage of GFP+ cells among CD45+ live cells in the bone marrow from BRAFV600EScl+ ATTAC+ mice and BRAFwtScl+ ATTAC+ control littermates. e-h, BRAFV600EScl+ mice and BRAFwtScl+ control littermates were treated with ABT-263 (50 mg/ kg body weight/ day) or diluent for 21 days. e, Cartoon shows the experimental design to test the clinical benefit of ABT-263 on LCH in mice. f, Graph shows the absolute numbers of bone marrow RosaYFP+ cells (n = 2–3) g, Spleen weight and (h) lung infiltrating CD207+ cells isolated from mice treated with ABT-263 or diluent (n = 3–4) with representative images of lung tissue sections isolated from mice treated with ABT-263 or diluent and stained with CD207. Data are representative of 2 experiments (n = 3–4). Data are represented as mean ± s.e.m; statistical significance analyzed by an unpaired two-sided t-test is indicated by *p < 0.05; **p < 0.01; ***p < 0.001; ****p < 0.0001.
Fig. 1 |
Fig. 1 |. Expression of the BRAFV600E mutation in mouse and human multipotent HPCs is sufficient to lead to LCH lesions.
a, Cartoon shows the experimental breeding scheme used to generate BRAF-V600EScl+ mice and control littermates. d1–5 indicates day 1–5. b, Percentage of RosaYFP+ cells among purified hematopoietic progenitors in BRAF-WTScl+ mice 4 weeks after tamoxifen injections (n = 5 mice). CMP, common myeloid progenitor; MEP, megakaryocytic erythroid progenitor. c, Representative computerized tomography image of a femur from a BRAF-V600EScl+ animal. The red arrow shows a pathognomonic granuloma. d, H&E staining and CD207 immunohistochemistry staining of tissues isolated from BRAF-V600EScl+ mice. We note the presence of multinucleated giant cells and granuloma-like lesions. The graph represents the number of CD207+ cells per mm2 in tissue sections isolated from animals (n = 3 mice per group). e, Percentage of the CD11c+MHCII+ MNP population among RosaYFP+ cells in organs of BRAF-V600EScl+ mice and control littermates. Data are representative of three experiments (n = 7 mice). f, Absolute numbers of total CD45+ immune cells and CD11c+MHCII+ MNPs that populate the lung and the skin of BRAF-V600EScl+ mice and control littermates. Data are representative of three experiments (n = 3–7 mice). NS, not significant. g, Cartoon shows the scheme used to generate the humanized LCH mouse. h, Liver, lung and spleen tissue sections isolated from humanized mice reconstituted with BRAF-V600Ehu HPCs were stained with anti-CD207 and anti-CD1a antibodies. Graphs represent the number of CD207+ or CD1a+ cells per mm2 in tissue sections isolated from animals (n = 3–4 mice). Data are represented as mean ± s.e.m.; statistical significance was analyzed by unpaired two-sided t-tests and is indicated by *P < 0.05, **P < 0.01, ***P < 0.001 and ****P < 0.0001. These data are representative of three independent experiments.
Fig. 2 |
Fig. 2 |. Expression of the BRAFV600E mutation in multipotent hematopoietic progenitors enforces their differentiation toward the MNP lineage.
ac, BRAF-V600EScl+ mice were generated as described in Fig. 1a, and, in these mice, RosaYFP+ cells mark BRAF-V600E+ cells, while RosaYFP− cells mark BRAF-V600E cells. In BRAF-WTScl+ control littermates, RosaYFP+ cells mark those that underwent a Cre recombination as well. a, Graphs show the percentage of HSCs, MPPs, common myeloid progenitors, granulocytic myeloid progenitors and megakaryocytic erythroid progenitors among RosaYFP+ cells in the BM of BRAF-V600EScl+ mice and BRAF-WTScl+ control littermates (n = 6–7 mice). b, Percentages of neutrophils, Ly6Chi monocytes (mono), macrophages and dendritic cells among RosaYFP+ cells in the BM of BRAF-V600EScl+ mice and BRAF-WTScl+ control littermates (n = 4–6 mice). c, CFU assays were performed on purified lineage-negative BM cells isolated from BRAF-V600EScl+ mice or BRAF-WTScl+ control littermates (n = 3 mice) cultured in the presence of methylcellulose, with representative phase contrast photomicrographs of colonies. GEMM, granulocytes, erythrocytes, megakaryocytes, monocytes, megakaryocytes. df, Purified CD34+ HPCs transduced with BRAFV600E (BRAF-V600Ehu) or NGFR control (NGFRhu) lentiviral vectors were cultured in stem cell medium for 8 d. d, Graphs show the percentages of GMPs (defined as CD34+CD38+CD10CD123hi/intCD45RA+/−) and the percentages of MNPs (defined as CD66bCD11c+MHCII+) among live cells (n = 3 donors). e, CFU assays in methylcellulose performed on purified BRAF-V600EGFP and BRAF-V600E+GFP+ cells isolated from HPCs transduced with the BRAFV600E lentiviral vector or purified NGFR+GFP+ or NGFRGFP cells isolated from HPCs transduced with the NGFR lentiviral vector as described in Extended Data Fig. 3 (n = 6 donors). Representative phase contrast photomicrographs of colonies are shown. f, Human CD34+ HPCs transduced with BRAFV600E or the control NGFR lentiviral vector were cultured for 7 d in stem cell medium and analyzed using microarray sequencing. Heatmap representation of genes involved in granulopoiesis and the macrophage–dendritic cell (DC) lineage is shown (n = 4 independent donors per group). g, Purified CD34+ BM cells were isolated from a healthy pediatric donor (in duplicate) and from three patients with LCH and BM mononuclear cells known to be BRAF-V600E+, and these cells were analyzed using bulk RNA-seq. Heatmap representation of genes involved in granulopoiesis and the macrophage–dendritic cell lineage is shown. h,i, BRAF-V600EScl+ mice and BRAF-WTScl+ control littermates were generated as described in Fig. 1a. The percentages of GMPs (h), neutrophils, Ly6Chi monocytes, macrophages and dendritic cells (i) among BRAFWT;RosaYFP− cells in the BM of BRAF-V600EScl+ mice and BRAF-WTScl+ control littermates is shown. j, Human CD34+ HPCs were transduced with BRAFV600E or NGFR lentiviral constructs and cultured in stem cell medium. Seven days later, the percentages of CD11c+ and/or CD14+ MNP cells among BRAFV600E (GFP+) or BRAFWT (GFP) cells were measured by flow cytometry. Because the transduction efficiency was around 40% for both vectors, GFP+ cells mark BRAF-V600E+ or NGFR+ cells, while GFP cells mark BRAFWT or NGFR cells among HPCs transduced with the BRAFV600E or NGFR lentiviral construct, respectively (n = 8 independent donors). k, Healthy human CD34+ cord blood HPCs were cultured in stem cell medium (concentration is represented by the white triangle) in addition to supernatant isolated from HPCs transduced with the BRAFV600E lentiviral construct or the NGFR control (concentration is represented by the black triangle). The graph shows the percentage of HPC differentiation into CD14+ MNPs analyzed by flow cytometry after 5 d of culture (n = 4 independent donors), analyzed by paired t-tests. Data are represented as mean ± s.e.m.; *P < 0.05, **P < 0.01, ***P < 0.001, ****P < 0.0001 (unpaired two-sided t-tests, two-way ANOVA test for d and paired two-sided t-tests for j,k). Data are representative of at least three independent experiments.
Fig. 3 |
Fig. 3 |. The BRAFV600E mutation drives mouse and human hematopoietic progenitors into senescence.
a, Lineage-negative BM cells isolated from either BRAF-V600EScl+CD45.2+ or BRAF-WTScl+CD45.2+ mice were injected intravenously together with lineage-negative CD45.1+ BM cells into lethally irradiated CD45.1+ mice at a 2:1 ratio (CD45.2+:CD45.1+). Graph shows the ratio of CD45.2+:CD45.1+ cells circulating in the blood in each group, measured 4 weeks after transplantation using flow cytometry (n = 8 animals). be, BM cells were isolated from BRAF-V600EScl+ and BRAF-WTScl+ control littermates and analyzed for the percentage of BrdU expression in lineage-negative Sca-1+c-Kit+ cells (LSK), megakaryocytic erythroid progenitors, common myeloid progenitors and GMPs after seven daily BrdU injections (1 mg per day) (n = 3–4 mice) (b); Cdkn2a expression from purified lineage-negative BM cells measured by quantitative PCR with reverse transcription (RT–qPCR) (normalized to actin expression) (n = 8 mice) (c); and SAβGal activity of purified lineage-negative BM cells (d). The graph shows the percentage of SAβGal+ cells among total cells (n = 3 mice per group). e, IL-1α, IL-1β and IL-6 protein levels in the BM supernatant, detected by ELISA, are shown (n = 4–6 mice per group). fi, Liver tissue sections were obtained from BRAF-V600EScl+ and BRAF-WTScl+ control littermates and analyzed for Ki-67+ (violet) cells among liver infiltrating CD207+ LCH cells (red) (f). Graphs show the percentage of Ki-67+ cells among CD207+ cells in liver sections (n = 3 mice per group), Cdkn2a expression by RT–qPCR (normalized to actin expression) (n = 3–5 mice per group) (g) and SAβGal activity (h). i, Graph shows the number of SAβGal+ cells per mm2 in liver sections (n = 3 mice per group) and expression of Il1a, Il1b, Il6 and Mmp13 by RT–qPCR normalized to actin expression (n = 3–5 per group). jn, Human CD34+ cord blood HPCs were transduced with BRAFV600E (BRAF-V600Ehu) or NGFR control (NGFRhu) lentiviral vectors, cultured in stem cell medium and analyzed for BrdU expression after daily pulses of BrdU from day 10 to day 13 (n = 4 different donors) (j), gene expression of senescence-associated genes using microarray expression profiling 7 d after transduction (n = 4 donors) (k) and SAβGal activity 9 d after transduction (l). l, The percentage of SAβGal+ cells among total cells is indicated (n = 4 donors). m, Trimethylation at lysine 9 of histone 3 (H3K9me3) and 4,6-diamidino-2-phenylindole (DAPI) immunofluorescence co-staining of NGFRhu and BRAF-V600Ehu HPCs 9 d after transduction; images are representative of senescence-associated-heterochromatin foci. n, IL-1α, IL-1β, IL-6 and IL-8 levels in the culture supernatant 7 d after HPC transduction (n = 4–6 donors). Data are represented as mean ± s.e.m.; statistical significance analyzed by unpaired and paired (for j,n) two-sided t-tests is indicated by *P < 0.05, **P < 0.01, ***P < 0.001 and ****P < 0.0001. Data are representative of at least two independent experiments.
Fig. 4 |
Fig. 4 |. The BRAFV600E mutation induces a senescence program in human LCH lesions.
a, Heatmap representation of senescence-associated gene expression, measured by RNA-seq in purified CD34+ BM cells isolated from three patients with LCH and one pediatric healthy donor (performed in duplicate). b, Skin CD207+ cells were isolated from healthy skin (n = 3 patients), CD3+ and CD207+ cells were purified from LCH lesions (n = 11 patients), and circulating CD14+ cells were isolated from three healthy pediatric donors, and these cells were analyzed for gene expression profiles using microarrays. The expression profile of CDKN2A, CDKN2B, CDKN2C, MMP1, MMP3, MMP9 and MMP13 is shown. c, FFPE sections of LCH lymph node lesions from three different patients were immunostained for CD207 and Ki-67, and FFPE lung cancer sections (n = 2 patients) were immunostained for cytokeratin and Ki-67. Images at the top show the high proliferation index of lung cancer. Images at the bottom show the same LCH donor with LCH in a lymph node. The middle panel shows a low proliferative index of the LCH as compared to that in the bottom panel of an uninvolved lymphoid follicle with its typical proliferative activity in the polarized germinal center. The graph represents the percent of Ki-67+ cells among CD207+ cells in LCH tissue or among cytokeratin-positive cells in lung cancers. d, Skin tissue sections isolated from patients with LCH and healthy age-matched donors were stained for CD207 and p16INK4a using immunohistochemistry. One representative image is shown. The graph shows the percentage of p16INK4a-positive cells among CD207+ cells (n = 3 patients for each group). e, SAβGal activity in human LCH lesions. CD207+ cells and CD3+ cells were sorted from LCH lesions (n = 5 patients), healthy skin and healthy tonsils, and these cells were stained for SAβGal activity. The graph shows the percent of SAβGal+ cells among CD207+ cells and CD3+ cells, highlighting that the staining occurred mostly in LCH cells. f, Graphs show IL-6 and IL-8 protein levels in the plasma of patients with LCH and age-matched healthy donors (n = 24 patients with multisystem LCH, n = 89 healthy pediatric donors). Data are represented as mean ± s.e.m.; statistical significance analyzed by unpaired two-sided t-tests is indicated by *P < 0.05, **P < 0.01, ***P < 0.001 and ****P < 0.0001.
Fig. 5 |
Fig. 5 |. SASP inhibition and eradication of senescent cells improve LCH outcome.
a,b, BRAF-V600Ehu-transduced CD34+ HPCs were cultured in stem cell medium and treated at day 1 and day 4 with rapamycin (10 nM) or dimethylsulfoxide (DMSO). a, Graphs show IL-1α and IL-1β protein levels in the supernatant of CD34+ HPCs 7 d after transduction (n = 4–5 independent donors). b, Percentages of MNPs (CD11c+ and/or CD14+) among total GFP+BRAF-V600E+ cells and among total GFPBRAF-V600E cells within cultures of BRAFV600E-transduced HPCs (BRAF-V600Ehu) that were treated with rapamycin or DMSO diluent were quantified by flow cytometry after 7 d of culture (n = 7 donors). ce, BRAF-V600EScl+ mice were treated with rapamycin (0.5 mg per kg of body weight per day) or vehicle control for 10 d. Percentage of GMPs (defined as DAPIlineagec-Kit+ScaCD16/CD32+CD34hi/int) among lineage-negative BM cells (c) and percentages of dendritic cells, macrophages and neutrophils among total CD45+ BM cells were measured using flow cytometry (n = 3–4 mice) (d). e, Liver weight in each group (n = 3–4 mice). Data are representative of two experiments. f, The percentage of tissue infiltration in the liver and lung is shown with representative images of H&E staining of tissues isolated from BRAF-V600EScl+ mice. g, Cartoon shows the experimental breeding scheme and treatment strategy used to generate BRAF-V600EScl+;ATTAC+ mice and control littermates. h,i, BRAF-V600EScl+;ATTAC+ mice and BRAF-WTScl+;ATTAC+ control littermates were treated with tamoxifen for 5 d and sacrificed 4 weeks later. h, The percentage of senescent p16INK4a-overexpressing cells was assessed by flow cytometry in the BM from BRAF-V600EScl+;ATTAC+ mice and control mice (n = 5–6 mice). Graphs show the percentage of GFP+ cells among live cells and among CD45+ cells, suggesting that senescent cells were exclusively hematopoietic cells. i, The nature of senescent p16INK4a-positive cells was assessed by flow cytometry. Graphs show the percentage of CD11b+ myeloid cells among GFP+ senescent cells and the percentage of macrophages, dendritic cells and neutrophils among GFP+CD11b+ myeloid senescent cells in BRAF-V600EScl+;ATTAC+ mice and control animals, highlighting that senescent cells in BRAF-V600EScl+;ATTAC+ mice are almost exclusively myeloid cells and that among them there is an accumulation of macrophages and dendritic cells, rather than neutrophils (n = 5–6 mice). jl, Following tamoxifen injections, BRAF-V600EScl+;ATTAC+ mice and BRAF-WTScl+;ATTAC+ control littermates were treated with AP or vehicle for 3 weeks and sacrificed 4 weeks after tamoxifen injections. j, The percentage of senescent p16INK4a-overexpressing cells in the BM from untreated and treated BRAF-V600EScl+;ATTAC+ mice (n = 5) was assessed by flow cytometry. The graph shows the percentage of GFP+ cells among CD45+ cells. k, Liver weight in each group (n = 8). l, Percentages of tissue infiltration in the liver and lung are shown with representative images of H&E staining of tissues isolated from untreated and treated BRAF-V600EScl+;ATTAC+ mice (n = 8). Data are representative of three experiments and are represented as mean ± s.e.m.; statistical significance analyzed by unpaired and paired (for a,b) two-sided t-tests is indicated by *P < 0.05, **P < 0.01, ***P < 0.001 and ****P < 0.0001. Data are representative of at least two independent experiments.

Similar articles

Cited by

References

    1. Merad M, Ginhoux F & Collin M Origin, homeostasis and function of Langerhans cells and other langerin-expressing dendritic cells. Nat. Rev. Immunol 8, 935–947 (2008). - PubMed
    1. Stålemark H et al. Incidence of Langerhans cell histiocytosis in children: a population-based study. Pediatr. Blood Cancer 51, 76–81 (2008). - PubMed
    1. Allen CE, Merad M & McClain KL Langerhans-cell histiocytosis. N. Engl. J. Med 379, 856–868 (2018). - PMC - PubMed
    1. Badalian-Very G et al. Recurrent BRAF mutations in Langerhans cell histiocytosis. Blood 116, 1919–1923 (2010). - PMC - PubMed
    1. Chakraborty R et al. Mutually exclusive recurrent somatic mutations in MAP2K1 and BRAF support a central role for ERK activation in LCH pathogenesis. Blood 124, 3007–3015 (2014). - PMC - PubMed

Publication types

MeSH terms