Observational Study
. 2021 Jun;24(6):799-809.
doi: 10.1038/s41593-021-00847-z. Epub 2021 May 6.

Brain gene co-expression networks link complement signaling with convergent synaptic pathology in schizophrenia

Affiliations
Observational Study

Brain gene co-expression networks link complement signaling with convergent synaptic pathology in schizophrenia

Minsoo Kim et al. Nat Neurosci. 2021 Jun.

Abstract

The most significant common variant association for schizophrenia (SCZ) reflects increased expression of the complement component 4A (C4A). Yet, it remains unclear how C4A interacts with other SCZ risk genes or whether the complement system more broadly is implicated in SCZ pathogenesis. Here, we integrate several existing, large-scale genetic and transcriptomic datasets to interrogate the functional role of the complement system and C4A in the human brain. Unexpectedly, we find no significant genetic enrichment among known complement system genes for SCZ. Conversely, brain co-expression network analyses using C4A as a seed gene reveal that genes downregulated when C4A expression increases exhibit strong and specific genetic enrichment for SCZ risk. This convergent genomic signal reflects synaptic processes, is sexually dimorphic and most prominent in frontal cortical brain regions, and is accentuated by smoking. Overall, these results indicate that synaptic pathways-rather than the complement system-are the driving force conferring SCZ risk.


Conflict of interest statement

Competing interests

The authors declare no competing interests.

Figures

Extended Data Fig. 1
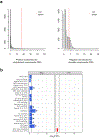
Extended Data Fig. 1. Ancestry of PsychENCODE subjects
Principal component analysis was performed using PLINK after merging the PsychENCODE genotype data with the 1000 Genomes Project reference panel. The PsychENCODE genotype data was available for a total 1,864 subjects to begin with. Each point represents an individual and points are color-coded by corresponding ethnicity. Global ancestry was inferred by k-nearest neighbors algorithm with the first five principal components. Downstream analyses were restricted to samples of European ancestry (N = 812).
Extended Data Fig. 2
Extended Data Fig. 2. Number of PsychENCODE samples with high-quality C4 imputation
Total 552 samples had average imputed probabilistic dosage > 0.7. These samples were subsequently used to generate C4A-seeded networks.
Extended Data Fig. 3
Extended Data Fig. 3. Replication of PsychENCODE seeded network in GTEx
a, Shown are Venn diagrams of the number of overlapping C4A-positive and C4A-negative genes in PsychENCODE and GTEx (OR’s = 19 and 16, P’s < 10−16, respectively). These networks were constructed from frontal cortex samples of non-psychiatric controls with C4A CN = 2. b, Shown is correlation of effect sizes (i.e. PCC) of each gene that is shared between the two networks (R = 0.68, two-sided P < 10−16).
Extended Data Fig. 4
Extended Data Fig. 4. Enrichment for complement components among C4A-positive genes and synaptic components as well as neurodevelopmental risk genes among C4A-negative genes
a, Seed genes were permuted 10,000 times and corresponding seeded networks were tested for enrichment of the complement system (n = 57 genes) and synaptic components (n = 1,103 genes) from SynGo. Shown is distribution of the odds ratio from Fisher’s exact test. b, C4A-positive and C4A-negative genes at FDR < 0.05 from the meta-analysis of PsychENCODE and GTEx were used for rare variant analyses (logistic regression with significance assessed through likelihood ratio test). The dotted line denotes FDR-adjusted P value at 0.05
Extended Data Fig. 5
Extended Data Fig. 5. Relationship between C4 structural variation and C4 gene expression
Residualized C4 gene expression (i.e. normalized and corrected for all known biological and technical covariates except the diagnosis status) was associated strongly with corresponding gene copy number (total N = 812; N = 20, 114, 367, and 311 for ASD, BD, CTL, and SCZ samples, respectively). Adjusted R2 values are shown for significant correlations. Of note, the best linear models for C4A and C4B expression explained up to 22% and 2.7% of variation in expression, respectively. All boxplots show median and interquartile range (IQR) with whiskers denoting 1.5 × IQR.
Extended Data Fig. 6
Extended Data Fig. 6. Larger number of C4A-positive and C4A-negative genes with increased C4A copy number
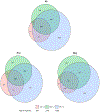
Shown are Venn diagrams of the number of overlapping C4A-positive and C4A-negative genes across three CNV groups. Note that the sum of positive and negative genes is equal to the total number of co-expressed genes. The size of the circle is approximately proportional to the number of genes.
Extended Data Fig. 7
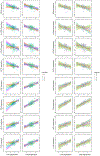
Extended Data Fig. 7. C4A-specific interaction with C4A copy number
Multiple regression was performed with interaction terms between C4 copy numbers and C4 gene expression. Significant interaction effect was present only between C4A copy number and C4A expression. Several genes are highlighted to demonstrate this interaction. Also shown are fitted linear models with 95% confidence bands.
Extended Data Fig. 8
Extended Data Fig. 8. Sex and spatiotemporal differences in C4A co-expression
a, Three different thresholds were tested, namely the number of total co-expressed genes at PCC > 0.4 and the number of C4A-positive and C4A-negative genes at FDR < 0.05. Males had more co-expressed genes than females regardless of the threshold metric used (N = 36, 38, 45, 47, 39, 45, 39, and 45 for frontal cortex, anterior cingulate cortex, hippocampus, caudate, putamen, cerebellum, hypothalamus, and nucleus accumbens, respectively; permutation test, P < 10−5). b, Similarly, frontal and anterior cingulate cortex were the two most connected regions for C4A regardless of the threshold metric used (N = 36, 38, 45, 47, 39, 45, 39, and 45 for frontal cortex, anterior cingulate cortex, hippocampus, caudate, putamen, cerebellum, hypothalamus, and nucleus accumbens, respectively; permutation test, P < 10−5). c, Leftward shift in co-expression peak was observed in SCZ cases compared to neurotypical controls across different threshold metrics (N = 30, 42, 57, 68, 47, and 32 for control samples in each age bin; N = 36, 46, 55, 45, and 47 for SCZ samples). All boxplots show median and interquartile range (IQR) with whiskers denoting 1.5 × IQR.
Extended Data Fig. 9
Extended Data Fig. 9. Pathways exhibiting differential co-expression in males and females
Shown are GSEA enrichments for C4A compared to 10,000 random seed genes. Genes were ranked by the magnitude of co-expression in male and female networks separately, and the corresponding gene list was used for GSEA. Several pathways showed the opposite direction of effect.
Extended Data Fig. 10
Extended Data Fig. 10. Differential gene expression of the complement system in SCZ and BD
Differential expression (DE) for brain-expressed complement system genes (n = 42) was assessed in SCZ (N = 531) and BD (N = 217) compared to controls (N = 895). DE was repeated for SCZ after randomly downsampling to match the sample size of BD. DE was also repeated for SCZ while adjusting for C4A expression and/or C4A copy number. Since C4A copy number was only imputed for samples of European ancestry, a subset of PsychENCODE samples was used for such conditional analyses (N = 311 and 367 for SCZ and controls, respectively). Text shows log2FC. Asterisks denote significance at FDR < 0.1.
Fig. 1.
Fig. 1.. Limited evidence for broad genetic enrichment within the complement system.
a, The complement system is composed of 57 genes which function together in a cascade to clear cellular debris, opsonize microbes, and mediate synaptic pruning. Here, we plot genes annotated within the complement system and corresponding evidence for SCZ genetic association,, based on proximity to GWAS loci, support from SMR (summary-data-based Mendelian randomization), and Hi-C interactions in fetal and adult brain. No enrichment of SCZ GWAS signals was observed for the complement system or an expanded annotation including high-confidence PPIs (InWeb3; n = 545 genes), using b, sLDSC or c, MAGMA with varying window sizes around each gene. All error bars denote standard errors of estimates of heritability enrichment, where the enrichment is defined as the proportion of SNP-based heritability over proportion of SNPs. d, The complement system did not show enrichment for SCZ risk genes from rare variant studies.
Fig. 2.
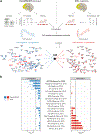
Fig. 2.. C4A-seeded co-expression networks capture convergent genetic risk for SCZ.
a, Overview of the generation of C4A-seeded networks, using control samples from PsychENCODE and GTEx. Node size is proportional to |correlation| with C4A expression and edges represent gene-gene co-expression. Shown in red labels are SCZ risk genes from SCHEMA reaching FDR or exome-wide (bold) significance. b, C4A-positive and C4A-negative genes showed enrichment for distinct GWAS signals, where C4A-negative, but not C4A-positive, genes showed enrichment for SNP-based heritability in SCZ. Results replicated in the independent GTEx dataset. The black line denotes Bonferroni-adjusted P value at 0.05/80. ADHD (attention-deficit/hyperactivity disorder), ALS (amyotrophic lateral sclerosis), ALZ (Alzheimer disease), AMD (age-related macular degeneration), ASD (autism spectrum disorder), BD (bipolar disorder), EA (educational attainment), IBD (inflammatory bowel disease), MDD (major depressive disorder), MS (multiple sclerosis), OCD (obsessive-compulsive disorder), PD (Parkinson’s disease), RA (rheumatoid arthritis), SLE (systemic lupus erythematosus), SWB (subjective well-being), T2D (type 2 diabetes).
Fig. 3.
Fig. 3.. Strong network expansion with increased C4A copy number.
a, C4A-seeded co-expression networks were generated following stratification of the PsychENCODE dataset by imputed C4A copy number. A substantial network expansion was observed with increased C4A copy number. Each network was generated via bootstrap (100 samples, 10,000 iterations) for robustness. Edges represent Pearson’s correlation coefficient (PCC) > 0.5 and edge weights represent the strength of the correlation. Probable SCZ risk genes implicated by common or rare variant studies are highlighted in bold. b, C4A-seeded networks expanded in size regardless of the applied PCC threshold. c, The nonlinear network expansion was specific to C4A as a seed gene, and not observed for C4B. Two genes, GRIA3 and MVP, are shown to illustrate this specificity. Shown are fitted linear models with 95% confidence bands.
Fig. 4.
Fig. 4.. C4A-seeded co-expression networks identify transcriptional correlates of synaptic pruning.
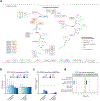
a, The top C4A-positive and C4A-negative genes showed distinct enrichments for neurobiological pathways and cell-types. With increasing C4A copy number, C4A-positive genes showed greater enrichment for microglia and NFkB pathways, while C4A-negative genes showed greater enrichment for neuron- and synapse-related modules. OR = odds ratio from two-sided Fisher’s exact test. Asterisks denote significance at Bonferroni-corrected P < 0.05. b, C4A-positive and C4A-negative genes were enriched for differentially expressed genes in SCZ brain from PsychENCODE and LIBD BrainSeq. Asterisks denote significance from Fisher’s exact test at nominal P < 0.05. c, C4A-positive and C4A-negative genes were expressed in distinct cell-types. Expression-weighted cell-type enrichment (EWCE) was performed using mouse cortical/subcortical single-cell RNA-seq data and human cortical single-nucleus RNA-seq data. Asterisks denote significance at FDR < 0.05. C4A-positive and C4A-negative genes are shown in red and blue, respectively.
Fig. 5.
Fig. 5.. Sex differences in C4A co-expression highlight male-accentuated effects on mTOR signaling and neuronal cilia.
a, Overall expression levels of C4A did not differ between sexes in PsychENCODE (N = 98 and 37 for male and female samples, respectively; two-sided Welch’s t-test, P = 0.42). b, Conversely, C4A co-expression network size was much larger in males (N = 98, 37 for males and females; permutation test, P < 10−5). Bootstrapped distributions were generated to match for sample size between sexes. c, To identify biological pathways and cell-types reflected by these sex-specific C4A co-expression patterns, we performed gene set enrichment analysis (GSEA). Genes were ranked by their C4A co-expression magnitude in male and female networks separately, and resulting enrichments were compared. Left, sex-concordant terms included positively associated complement activation. Right, sex-discordant terms included lipid and mTOR signaling genes as well as excitatory neuron markers and cilia-related pathways. Enrichment differences that were significant when compared to a null distribution of 10,000 random seed genes are highlighted in red. All boxplots show median and interquartile range (IQR) with whiskers denoting 1.5 × IQR.
Fig. 6.
Fig. 6.. Spatiotemporal patterns of C4A co-expression implicate frontal cortical regions and early adult timepoints in SCZ.
a, C4A exhibited the greatest degree of co-expression in frontal cortical brain areas. The plot shows the bootstrapped distribution of the number of co-expressed genes with C4A at FDR < 0.05 across eight different brain regions in GTEx (N = 36, 38, 45, 47, 39, 45, 39, and 45 for frontal cortex, anterior cingulate cortex, hippocampus, caudate, putamen, cerebellum, hypothalamus, and nucleus accumbens, respectively ). All pairwise comparisons were statistically significant (permutation test, P < 10−5). b, In contrast with co-expression patterns, frontal cortical regions did not show greater C4A expression. The plot shows C4A expression in GTEx samples used for the bootstrap (N = 36, 38, 45, 47, 39, 45, 39, and 45 for frontal cortex, anterior cingulate cortex, hippocampus, caudate, putamen, cerebellum, hypothalamus, and nucleus accumbens, respectively). c, The temporal peak of C4A co-expression was earlier in SCZ cases (30- to 60-year-old window) compared to controls (50- to 80-year-old window). Bootstrapped distributions were generated across overlapping time windows using samples from PsychENCODE (N = 30, 42, 57, 68, 47, and 32 for control samples in each age bin; N = 36, 46, 55, 45, and 47 for SCZ samples). Asterisks denote significant differences in the network size between SCZ cases and controls (permutation test, P < 10−5). d, In contrast with co-expression patterns, C4A showed monotonically increasing expression across age in frontal cortex samples from PsychENCODE (N = 1730). Shown is a LOESS smooth curve with 95% confidence bands. All boxplots show median and interquartile range (IQR) with whiskers denoting 1.5 × IQR.
Fig. 7.
Fig. 7.. Broad, bimodal differential expression of genes within the classical complement pathway in postmortem brains from individuals with SCZ.
a, Differential gene expression (DGE) in SCZ is shown for genes within the classical complement pathway. Early components were mostly up-regulated, whereas late components were down-regulated in SCZ. Genes are colored by DGE t-statistic on the left and t-statistic obtained while adjusting for C4A copy number on the right. Asterisks denote significance at FDR < 0.1. Bottom, cell-type specificity of complement receptors was calculated using snRNA-seq data from ref.. Oligo (oligodendrocyte), OPC (oligodendrocyte progenitor cell), Astro (astrocyte), Endo (endothelial), Micro (microglia), GABA (interneuron), Ex (excitatory neuron). b, In GTEx, we characterized the effect of documented medical comorbidities and other relevant biological covariates on brain C4A expression. In addition to C4A copy number, age, smoking, and a history of liver disease showed significant positive associations (one-sided likelihood ratio test).
Fig. 8.
Fig. 8.. A model of the functional role of C4A in SCZ pathogenesis.
mCNV of C4 genes as well non-genetic factors such as smoking influence C4A expression. C4A expression is positively associated with glial and inflammatory processes and negatively associated with neuronal and synaptic processes, which in turn are enriched for SCZ genetic signals.

Similar articles

Cited by

References

    1. Sullivan PF, Kendler KS & Neale MC Schizophrenia as a complex trait: evidence from a meta-analysis of twin studies. Arch. Gen. Psychiatry 60, 1187–1192 (2003). - PubMed
    1. Gandal MJ, Leppa V, Won H, Parikshak NN & Geschwind DH The road to precision psychiatry: translating genetics into disease mechanisms. Nat. Neurosci 19, 1397–1407 (2016). - PMC - PubMed
    1. Visscher PM et al. 10 Years of GWAS Discovery: Biology, Function, and Translation. Am. J. Hum. Genet 101, 5–22 (2017). - PMC - PubMed
    1. Schizophrenia Working Group of the Psychiatric Genomics Consortium. Biological insights from 108 schizophrenia-associated genetic loci. Nature 511, 421–427 (2014). - PMC - PubMed
    1. Pardiñas AF et al. Common schizophrenia alleles are enriched in mutation-intolerant genes and in regions under strong background selection. Nat. Genet 50, 381–389 (2018). - PMC - PubMed

Publication types

Grants and funding