. 2021 Jun;24(6):786-798.
doi: 10.1038/s41593-021-00851-3. Epub 2021 May 6.

Neuronal ApoE upregulates MHC-I expression to drive selective neurodegeneration in Alzheimer's disease

Affiliations

Neuronal ApoE upregulates MHC-I expression to drive selective neurodegeneration in Alzheimer's disease

Kelly A Zalocusky et al. Nat Neurosci. 2021 Jun.

Abstract

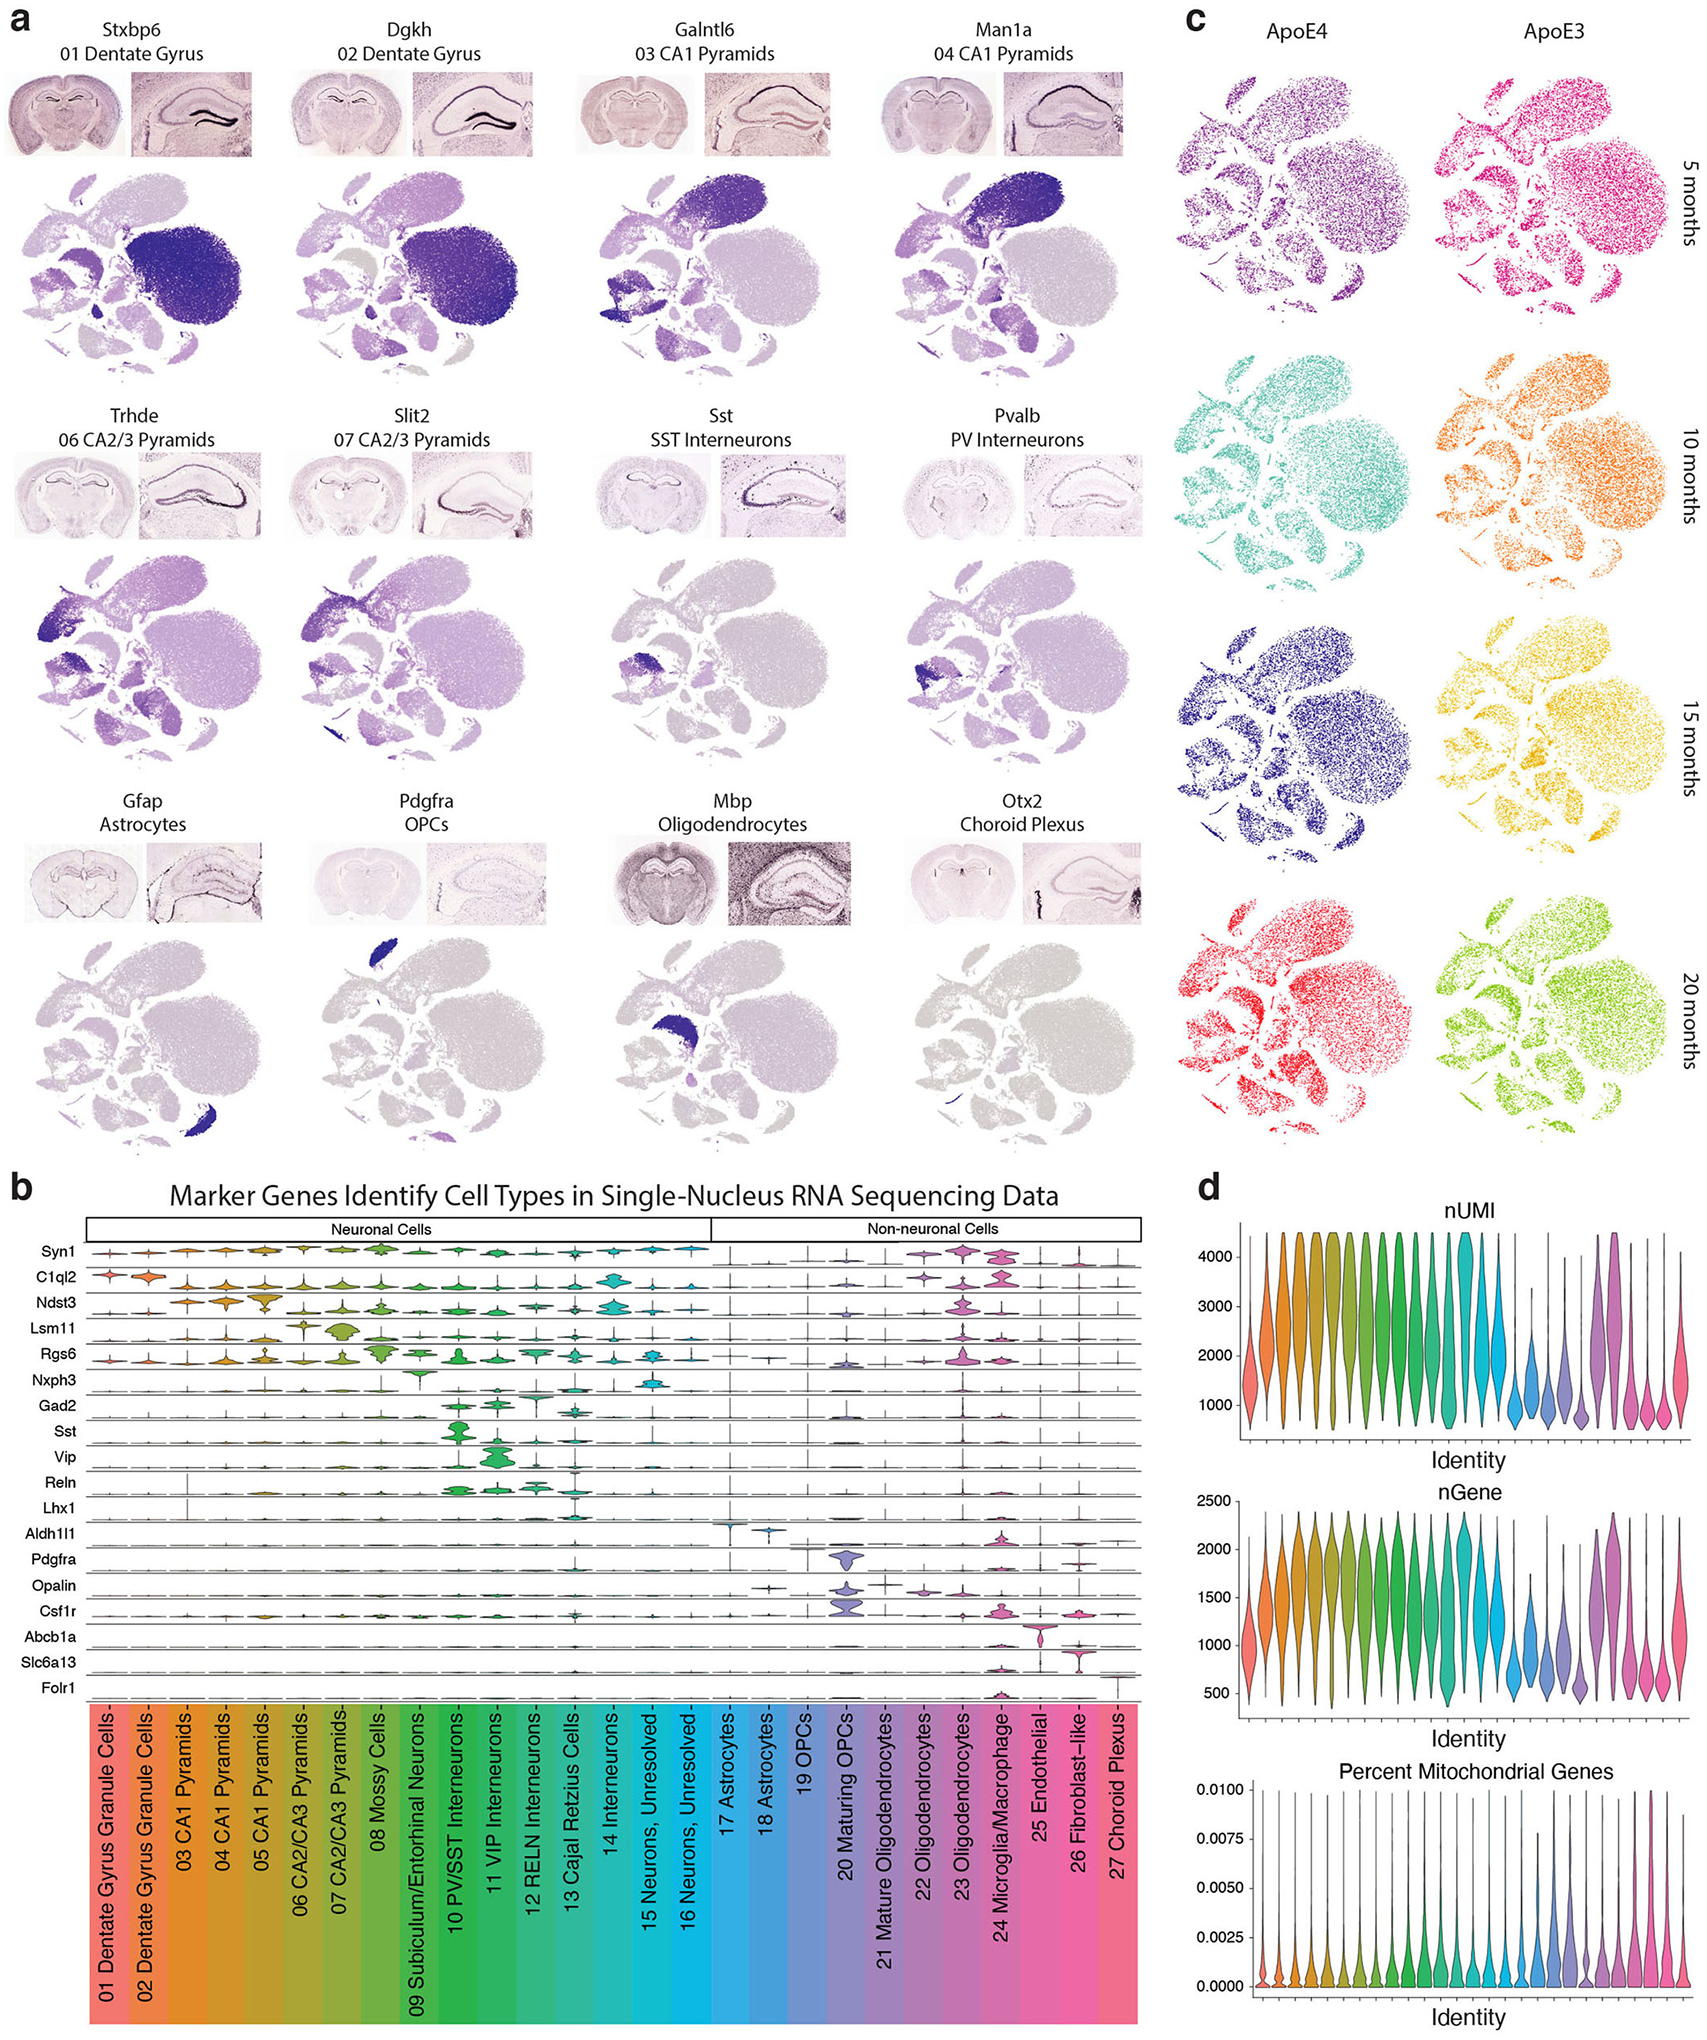
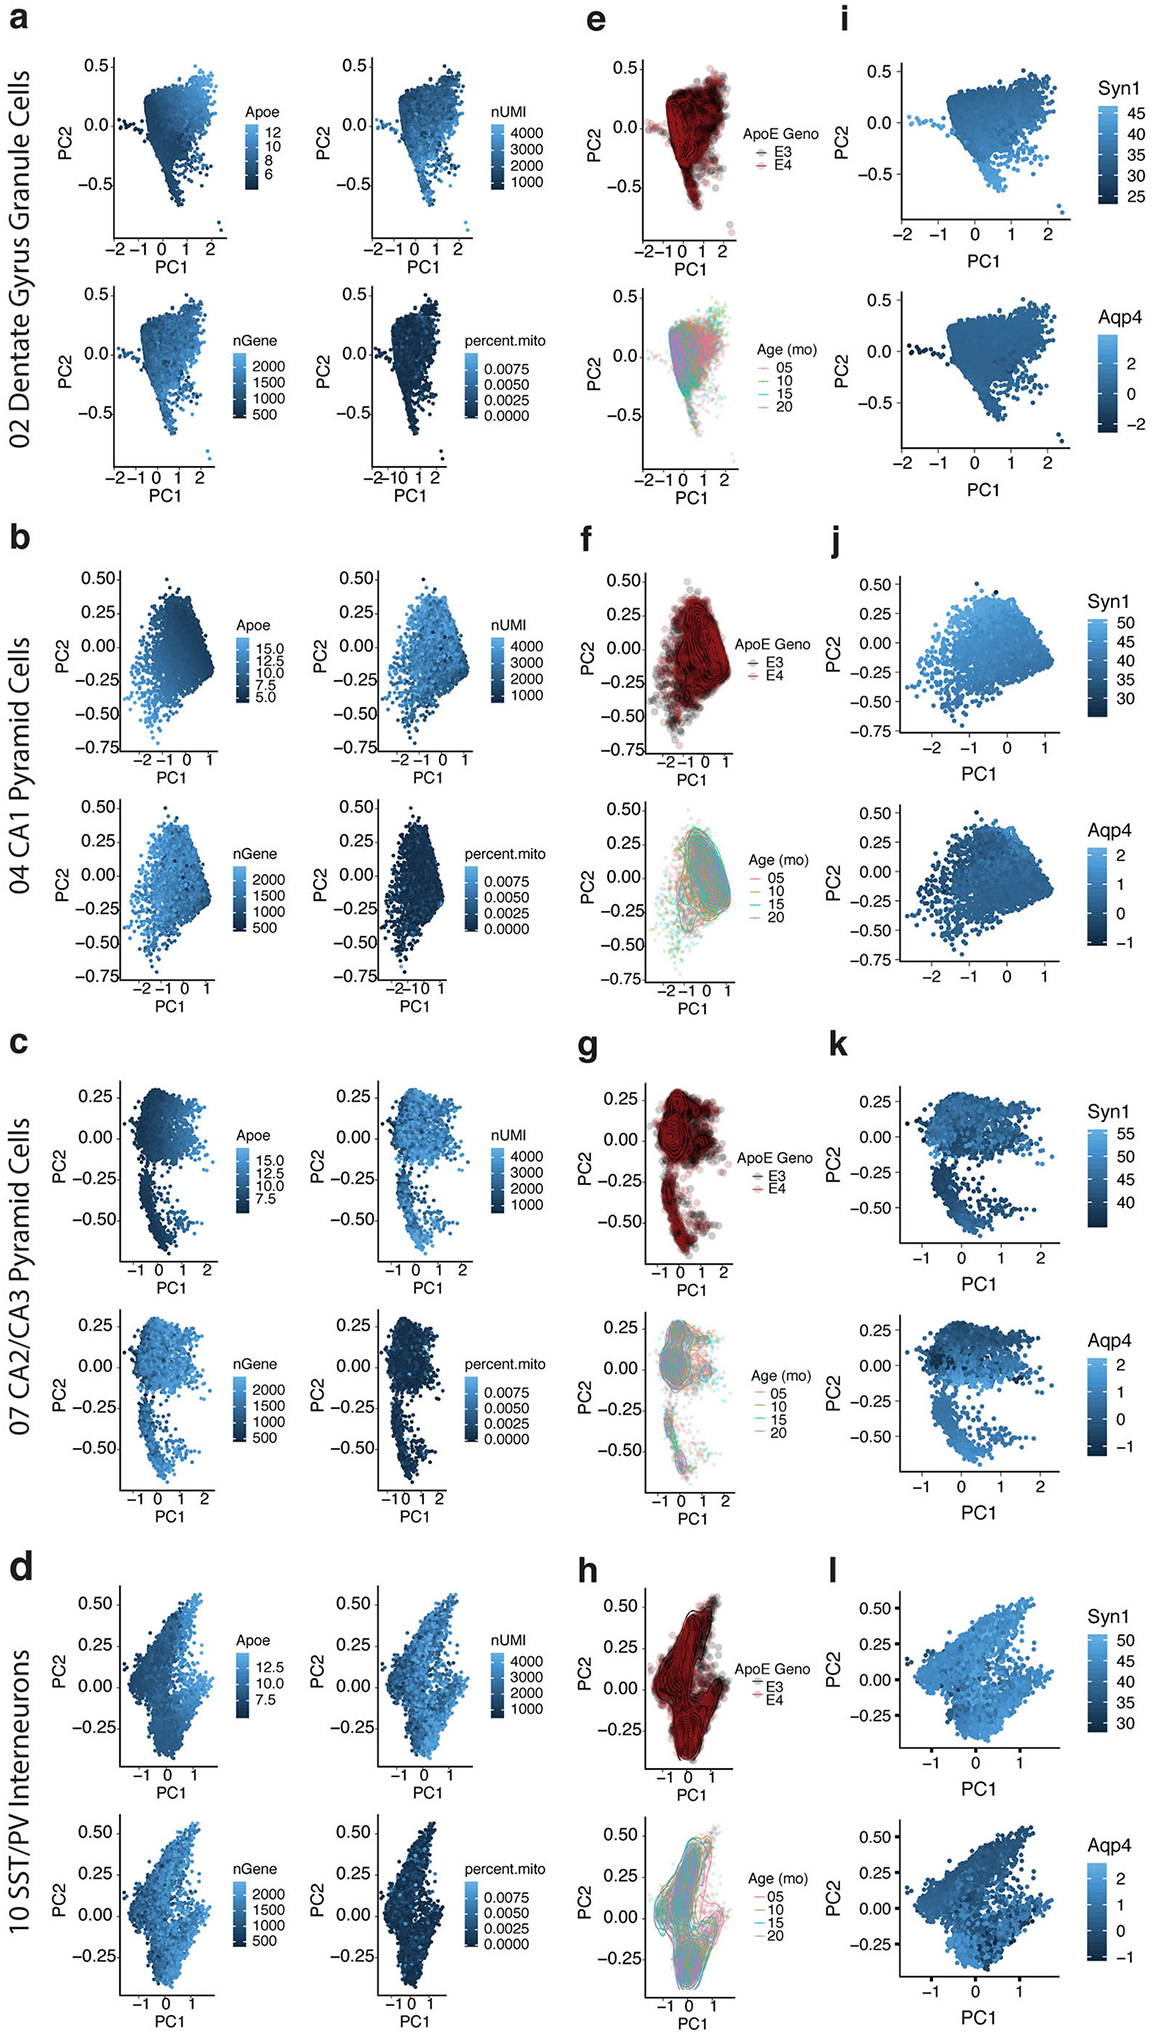
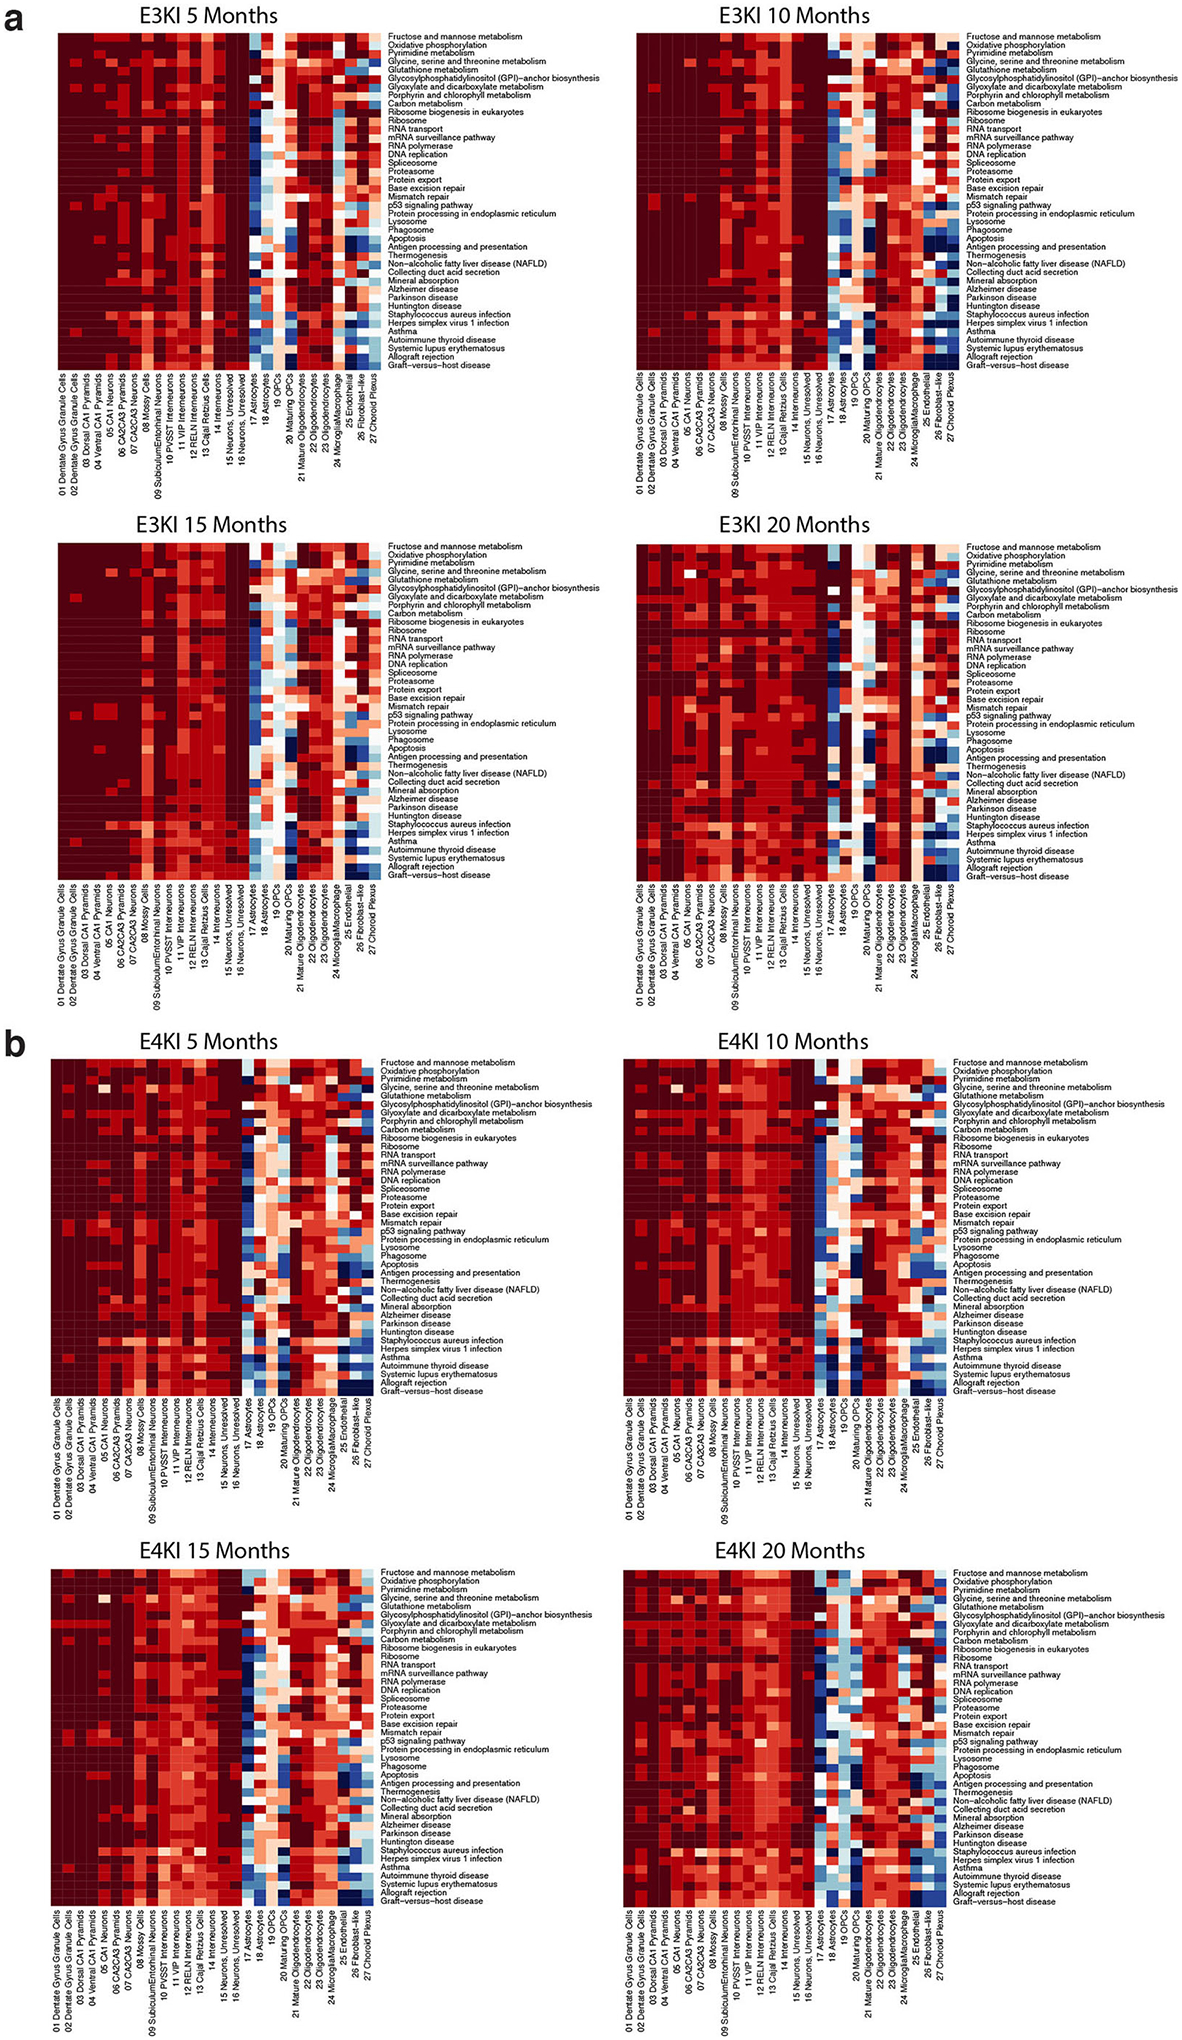
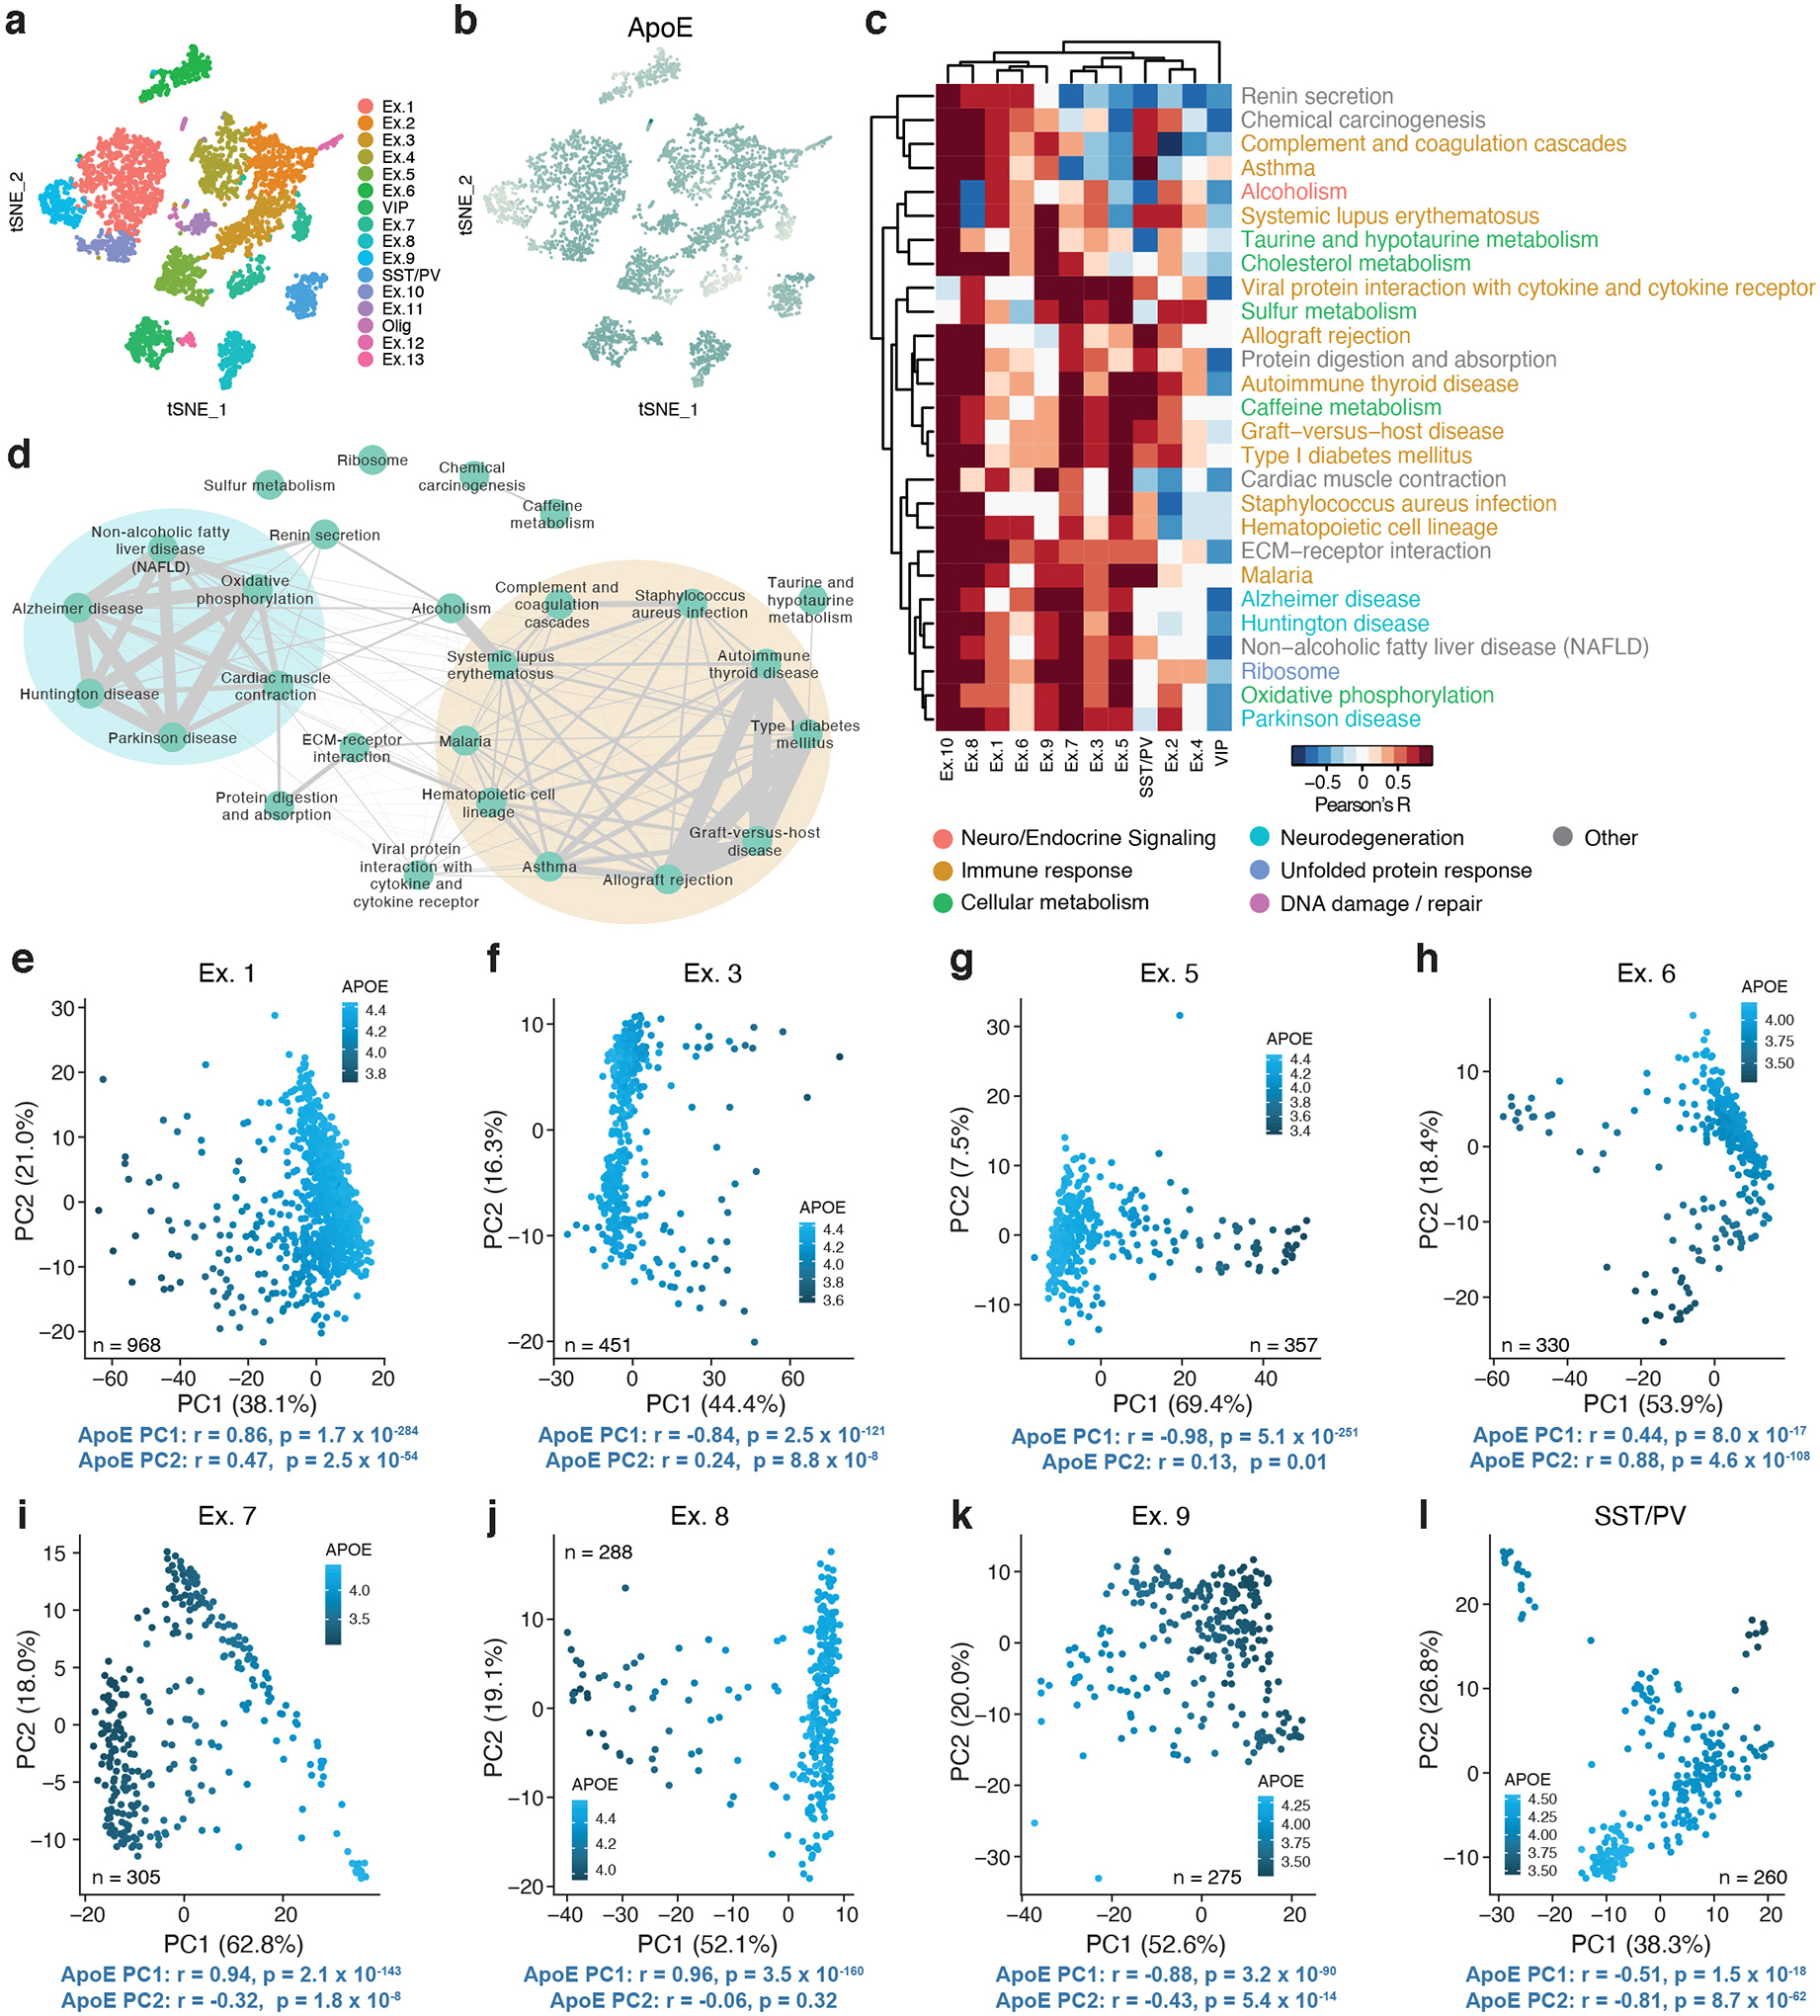
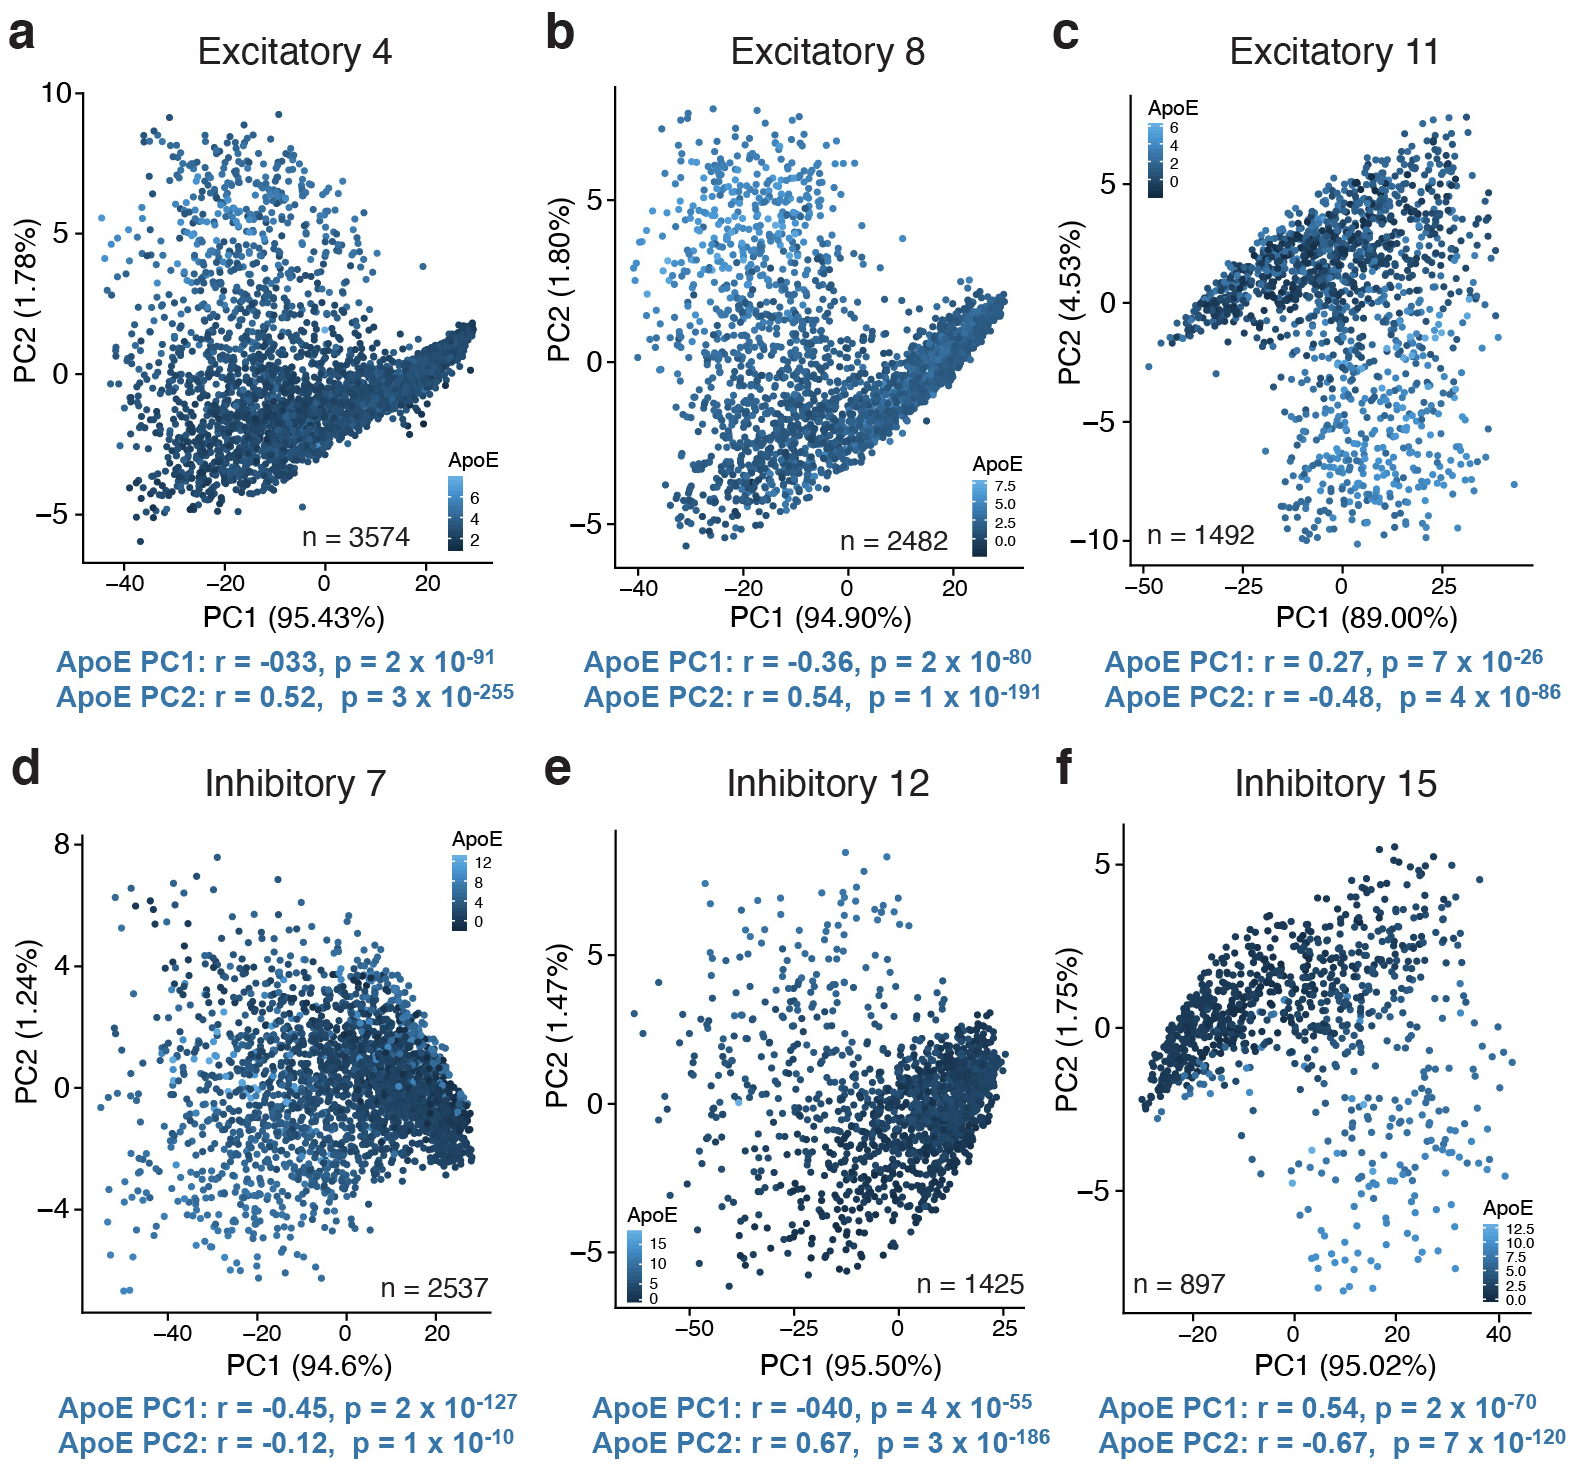
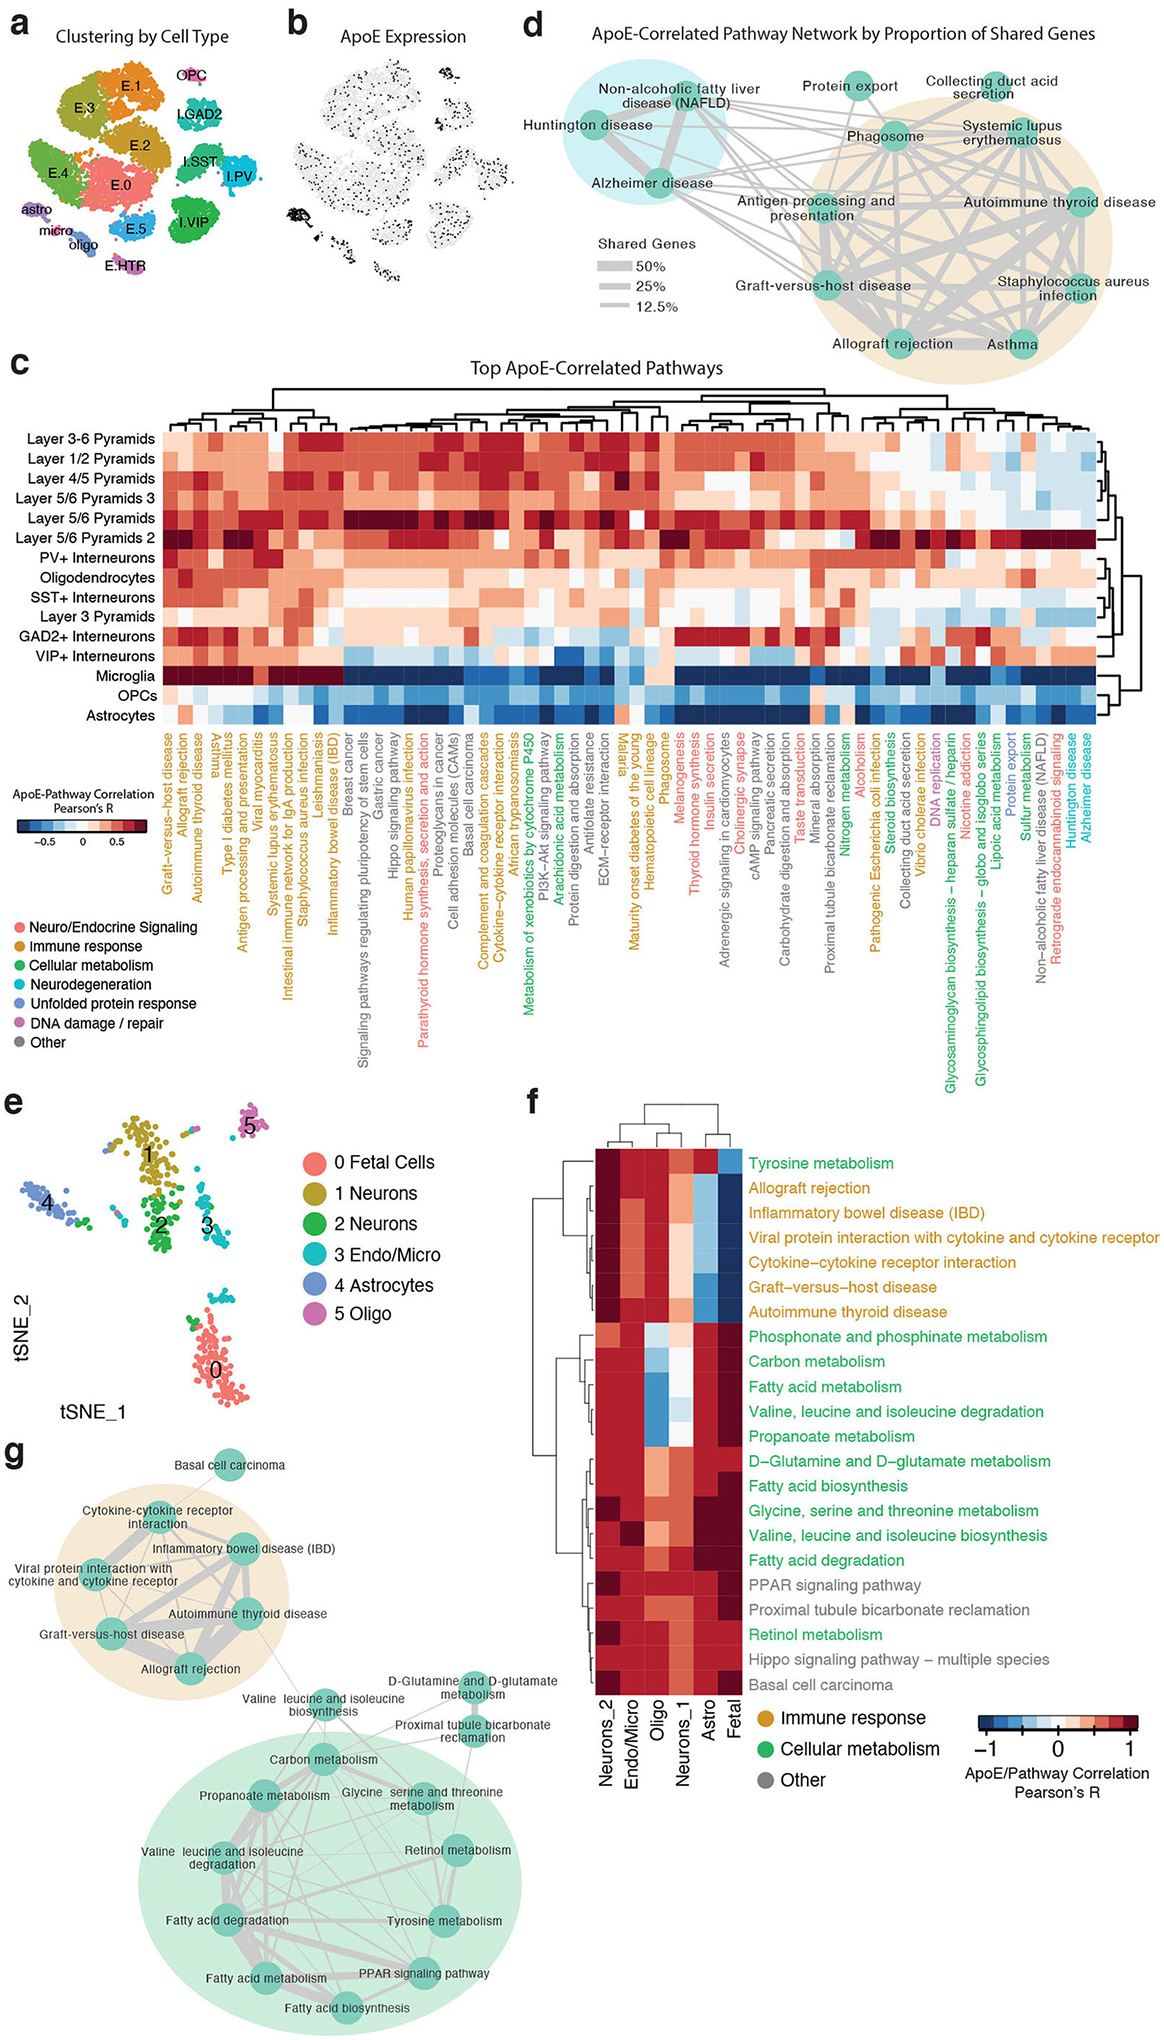
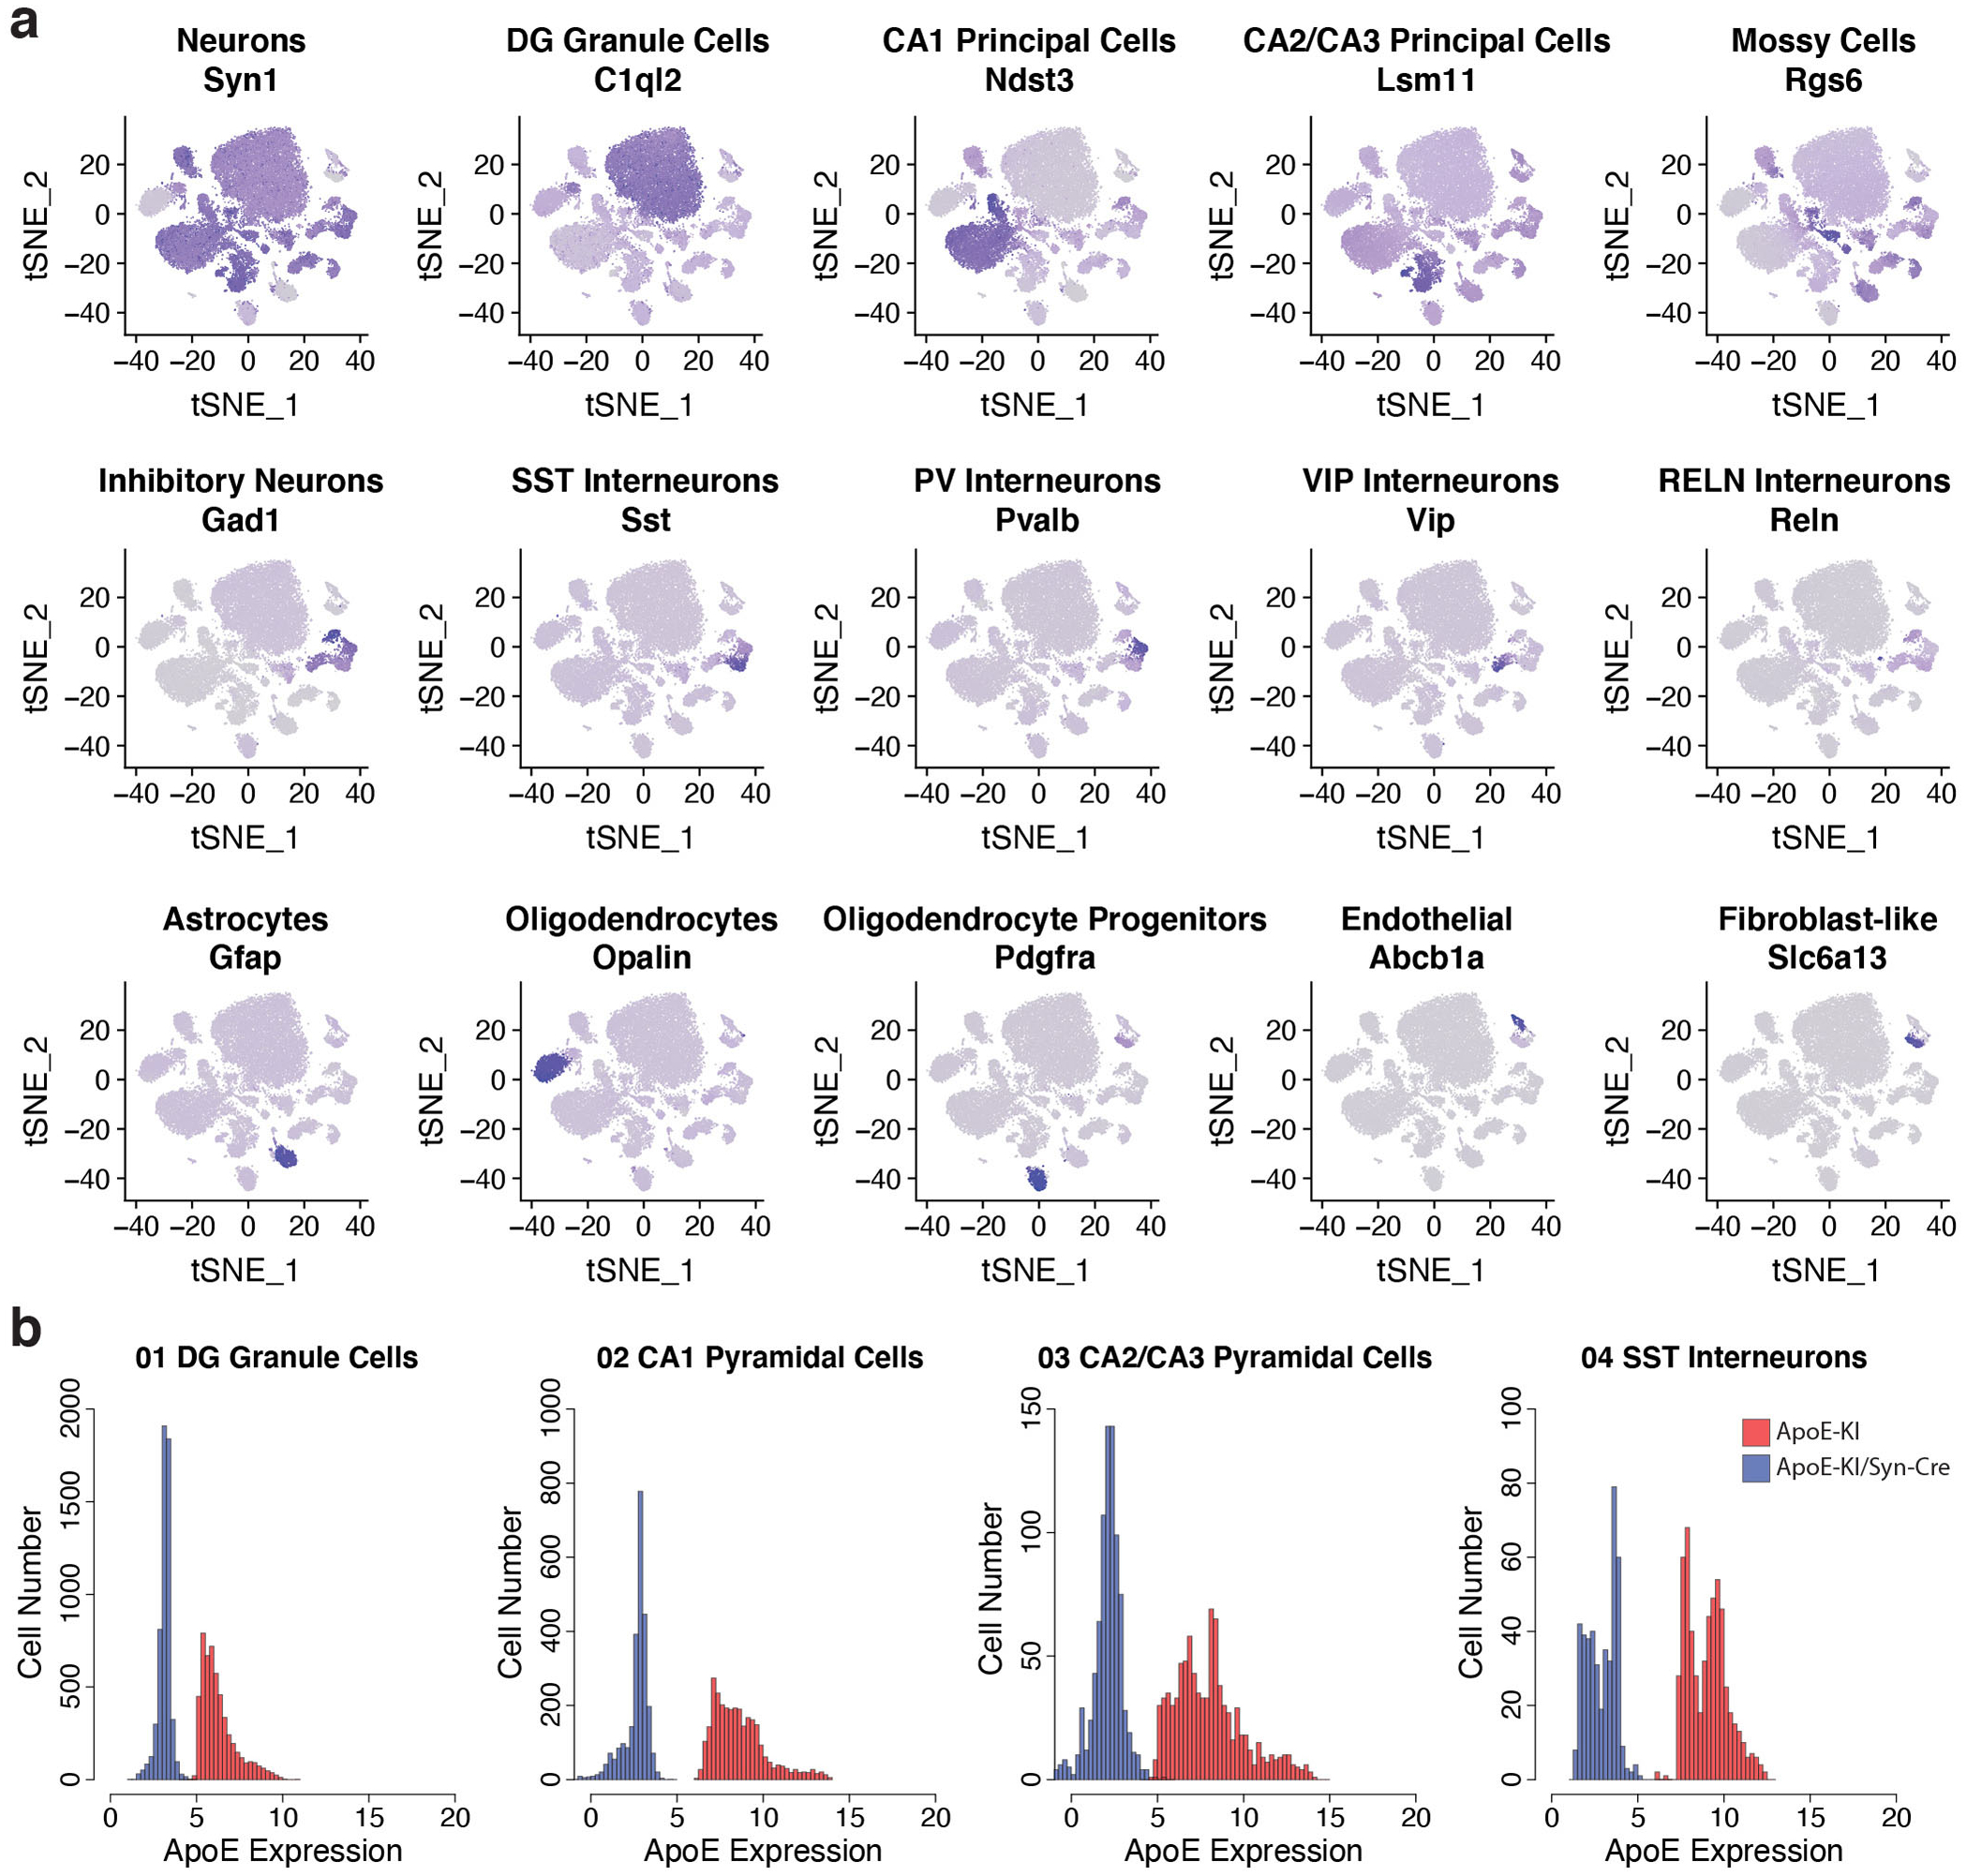
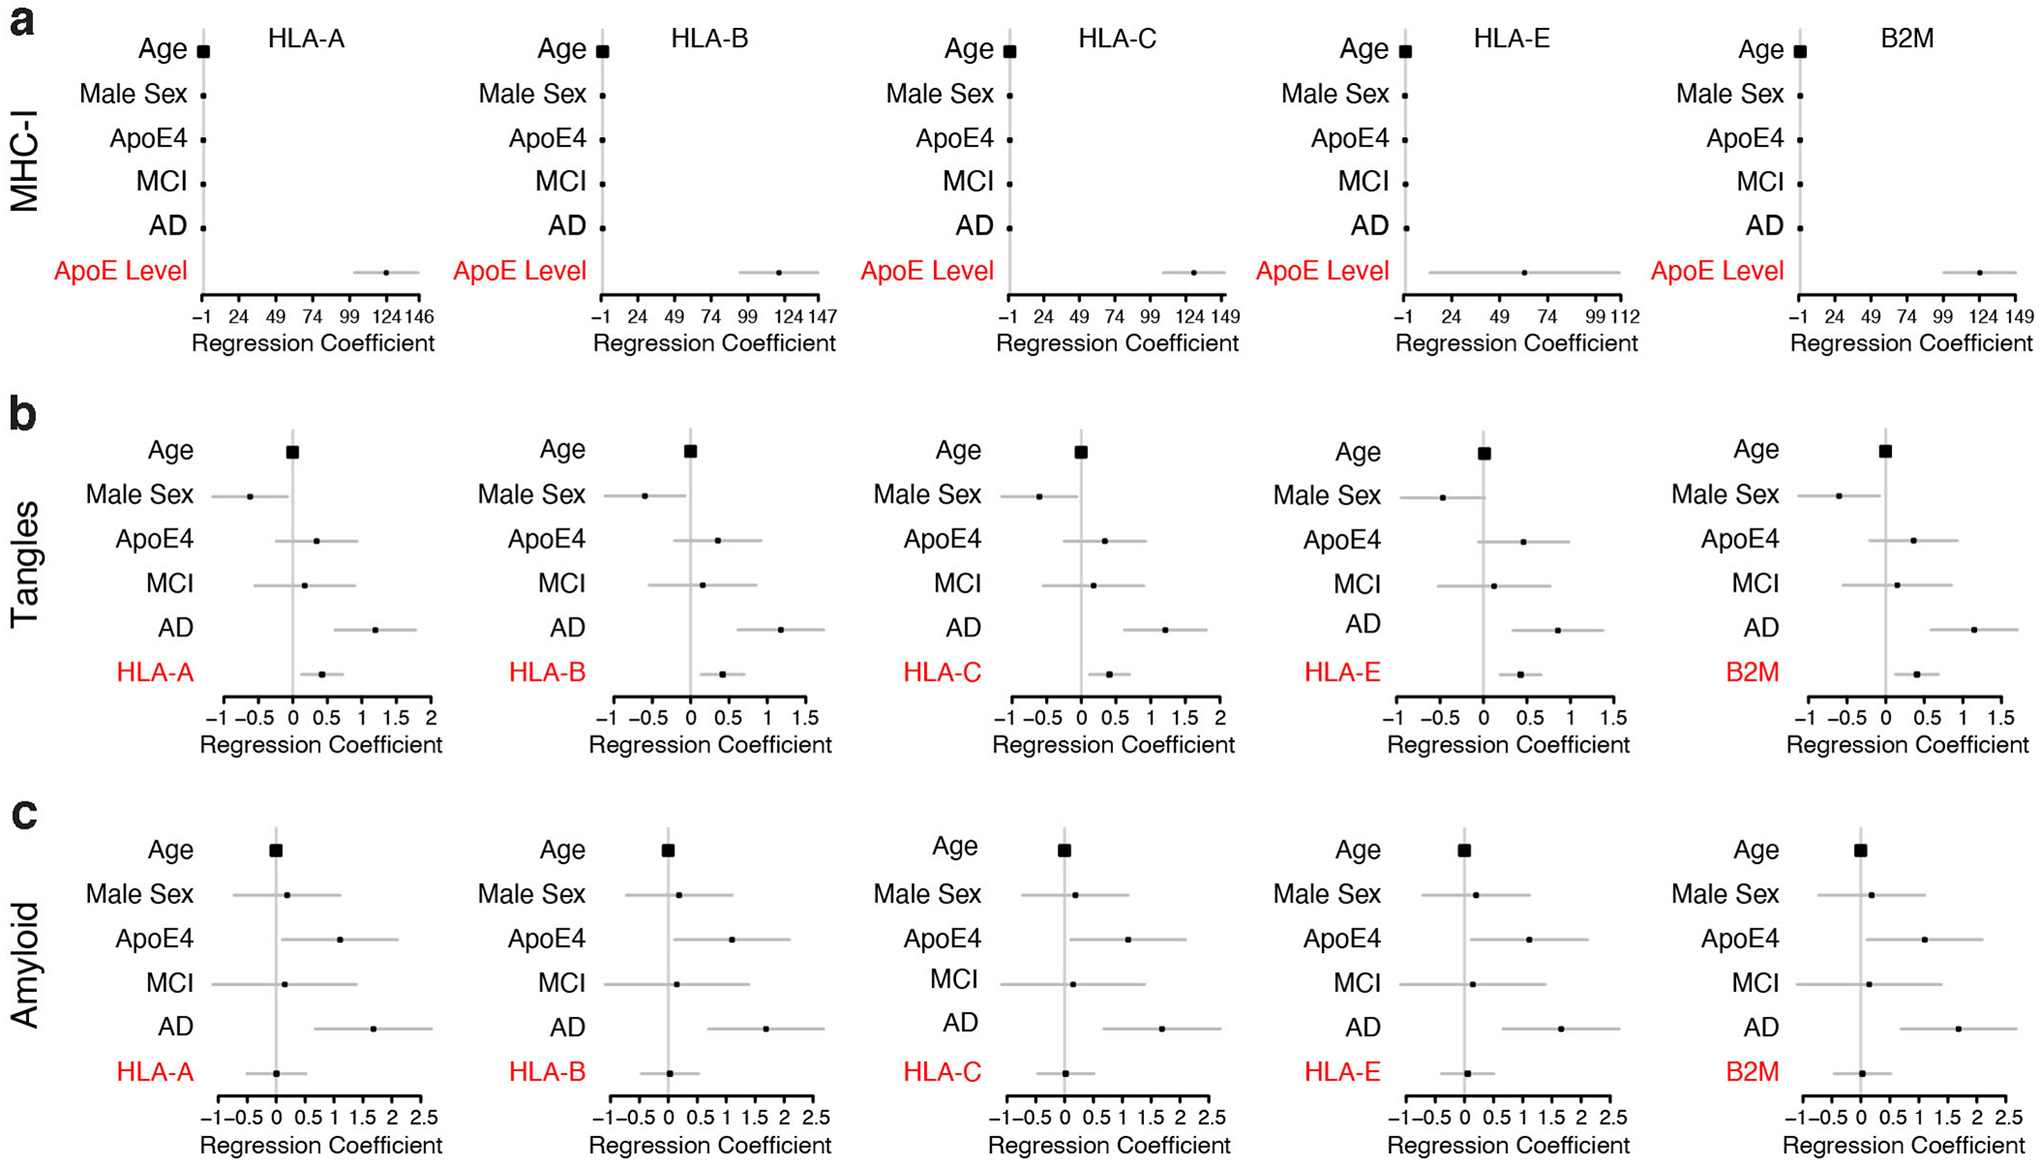
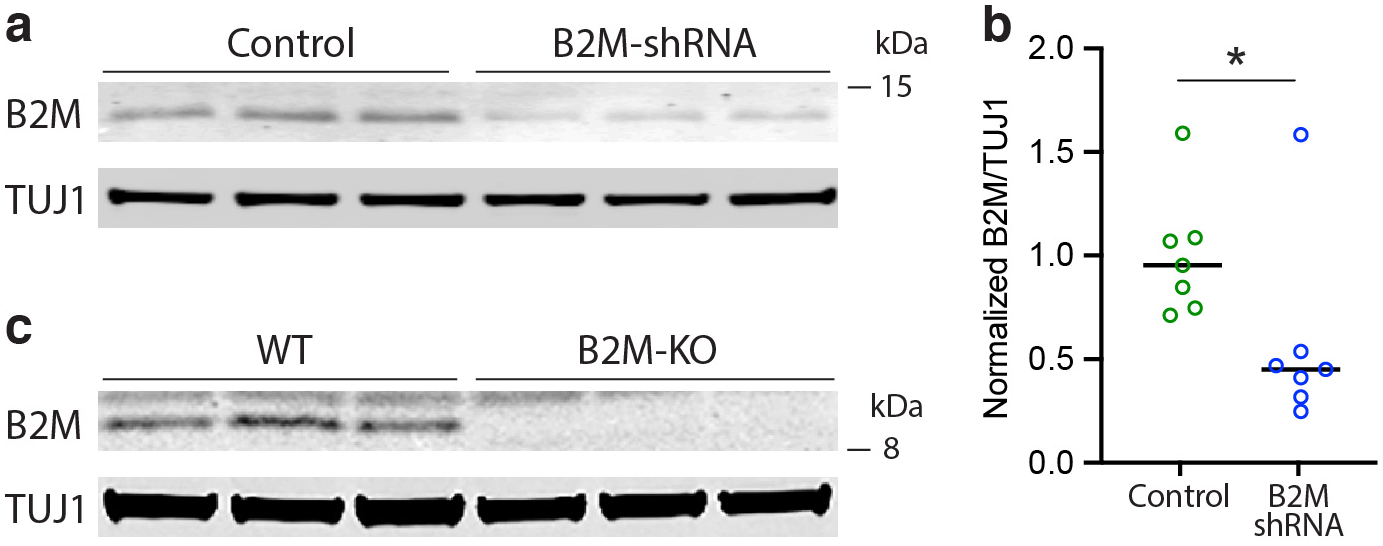
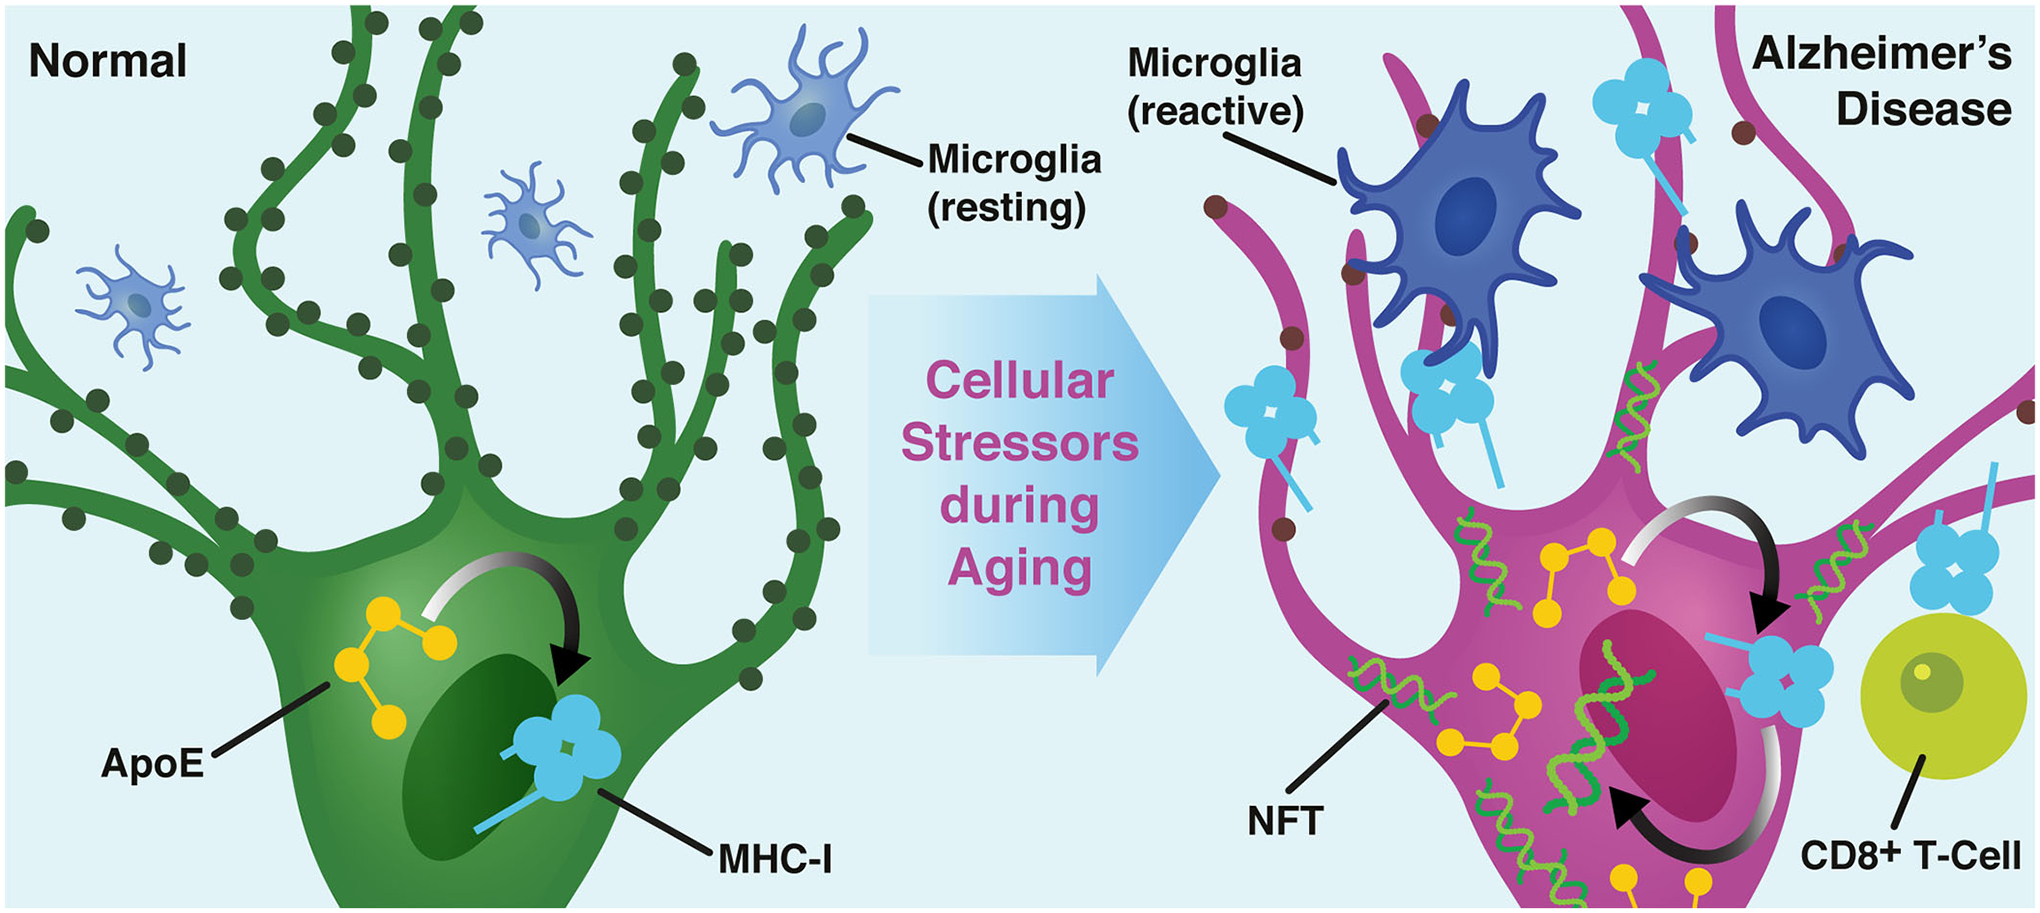
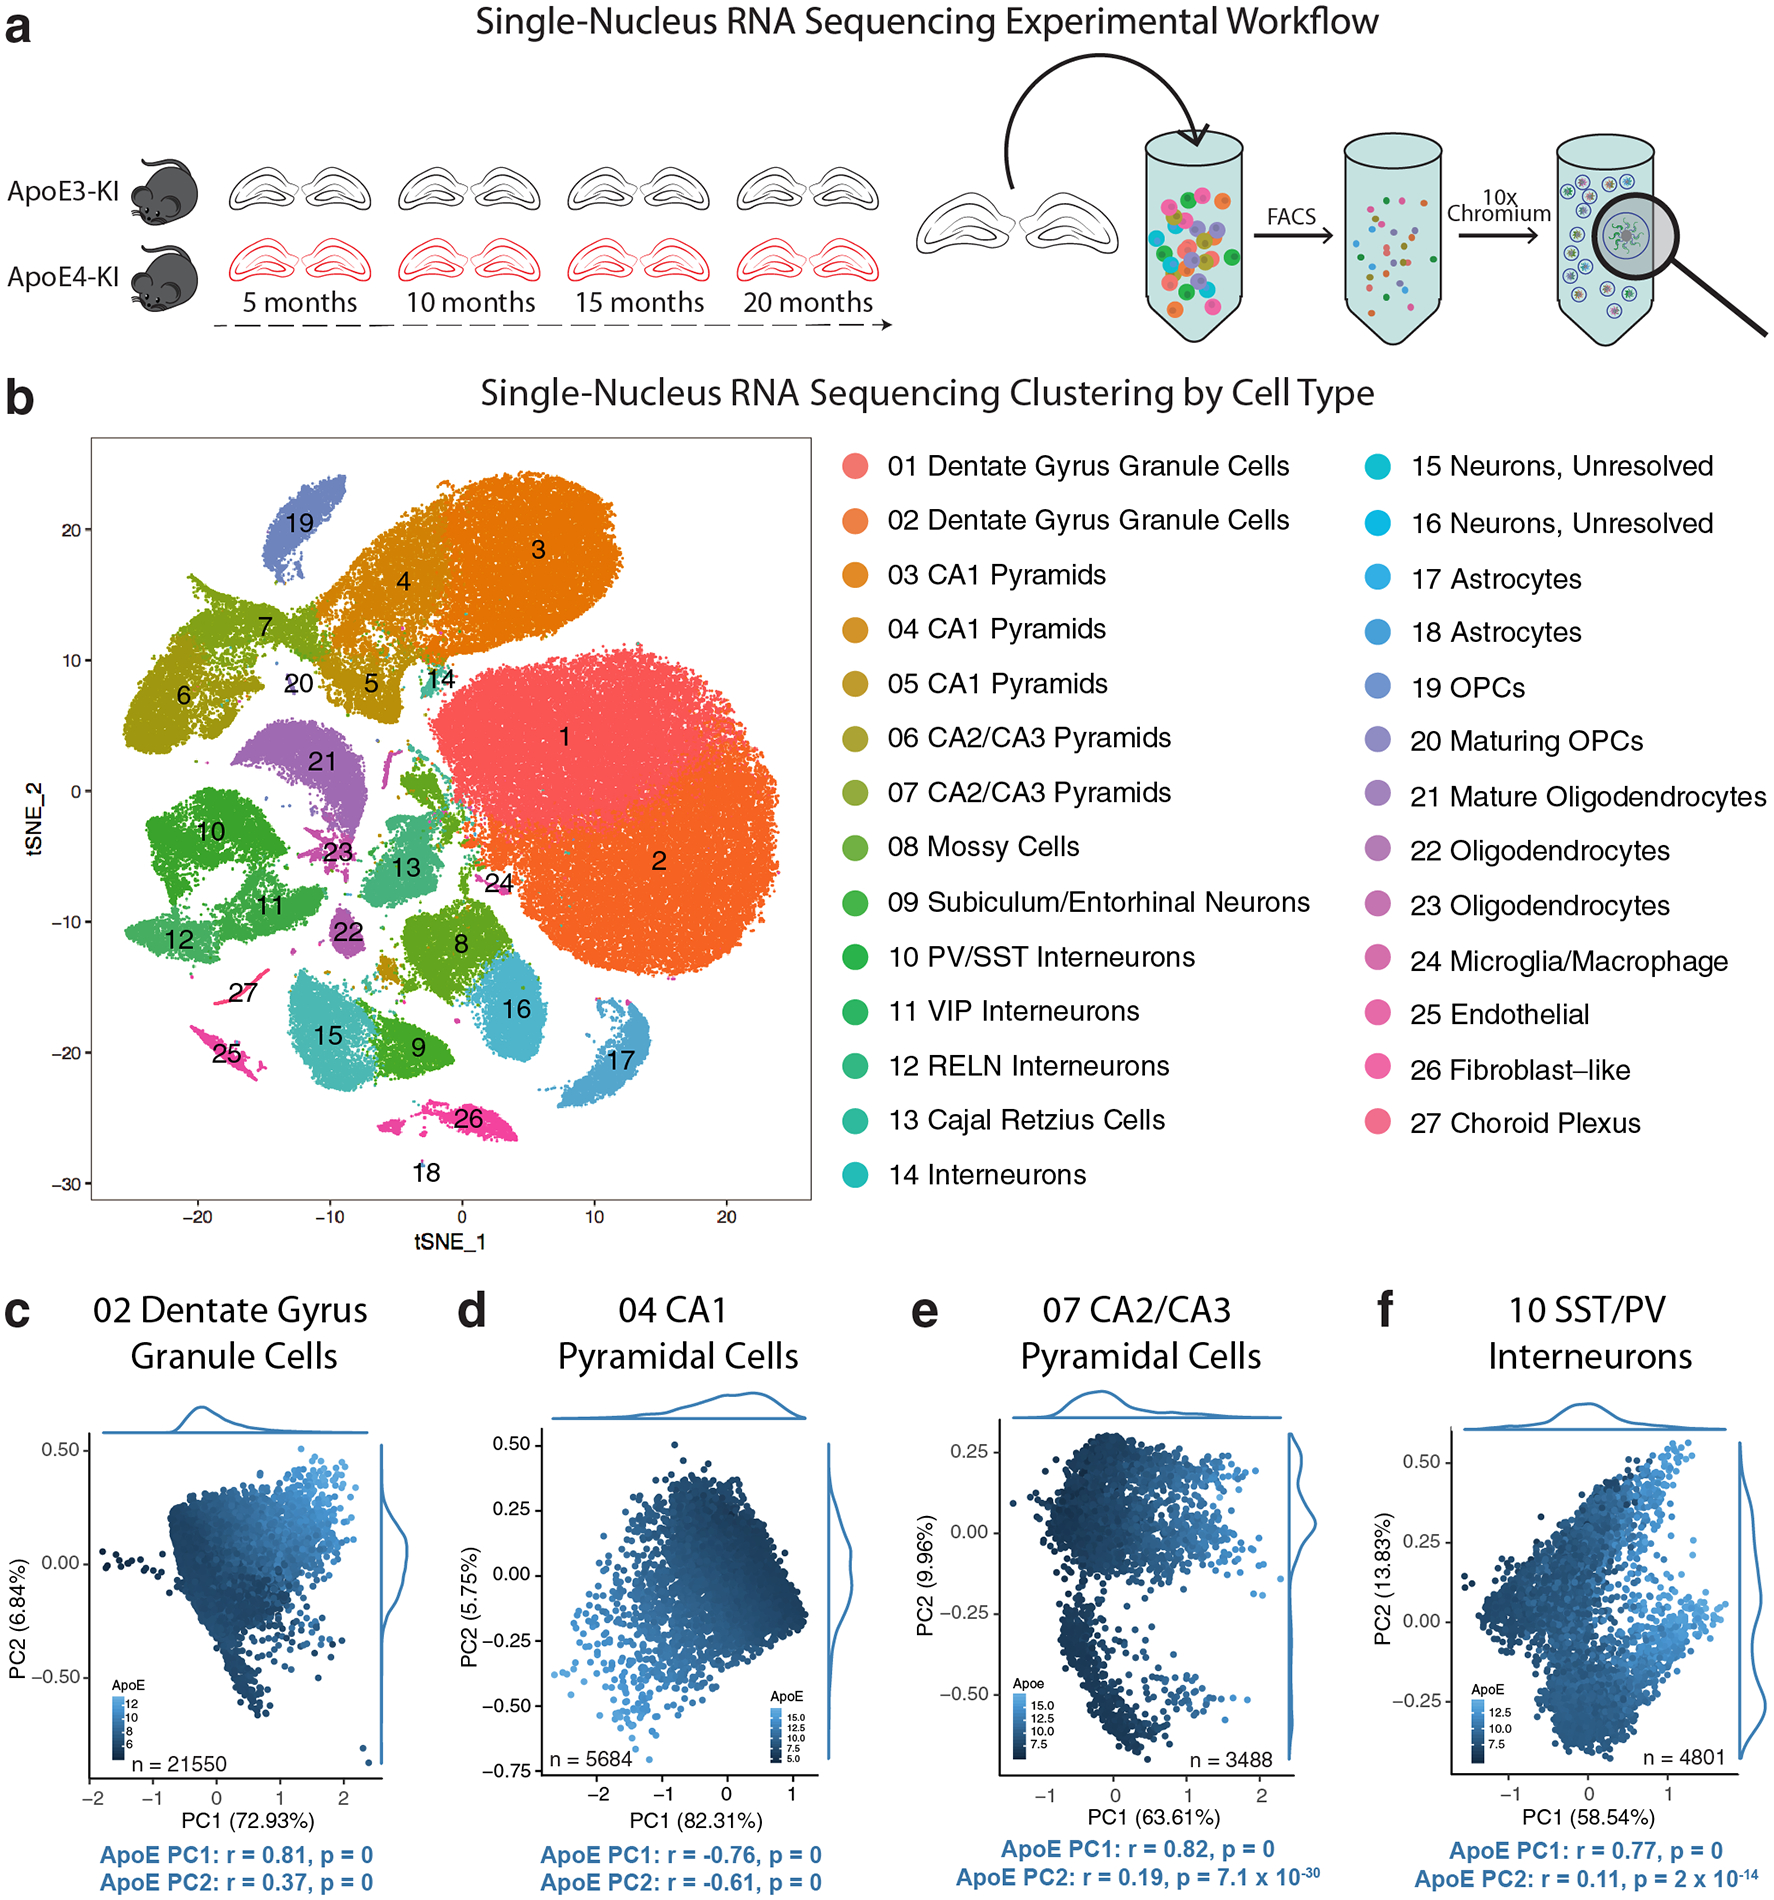
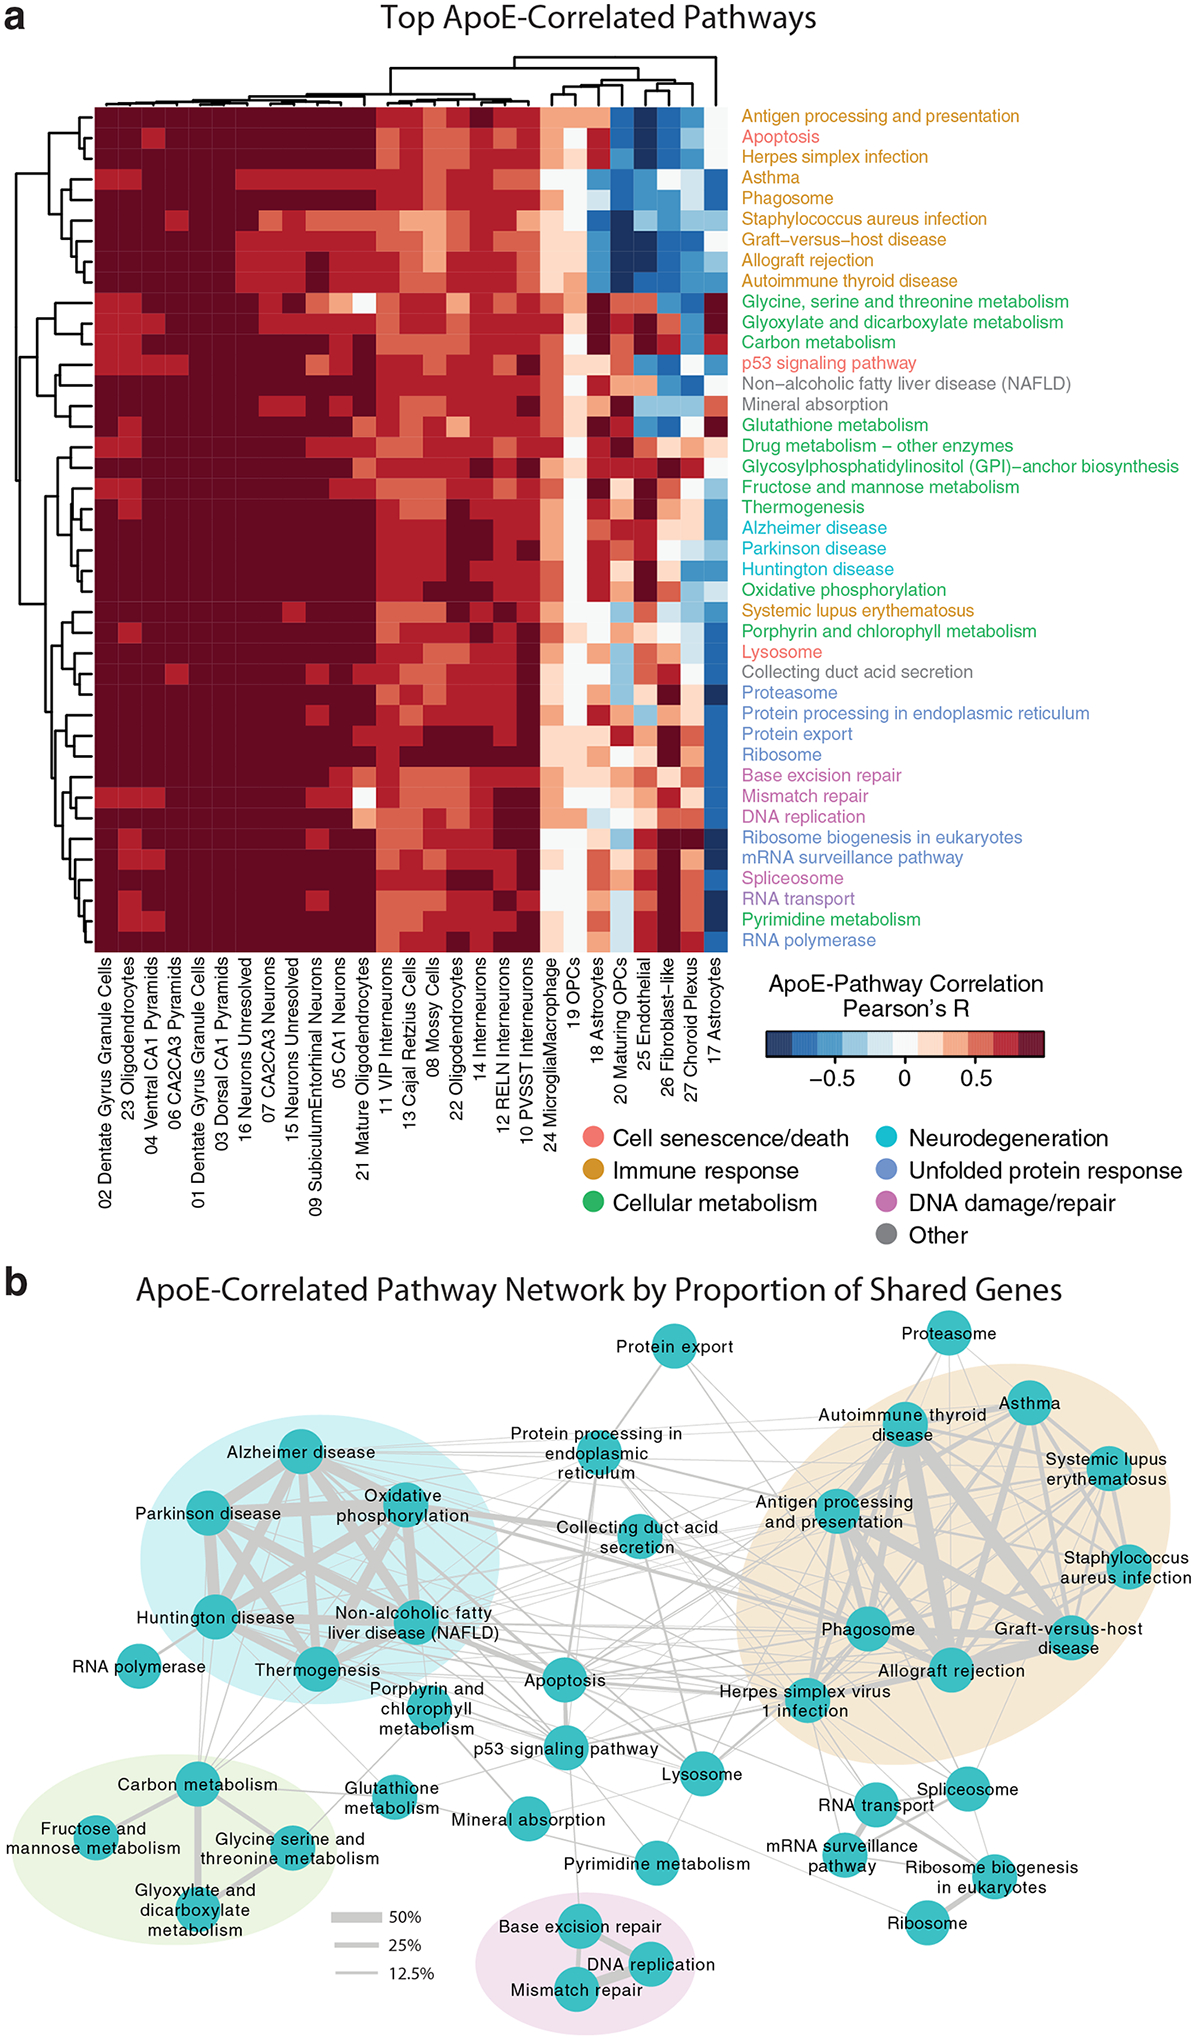
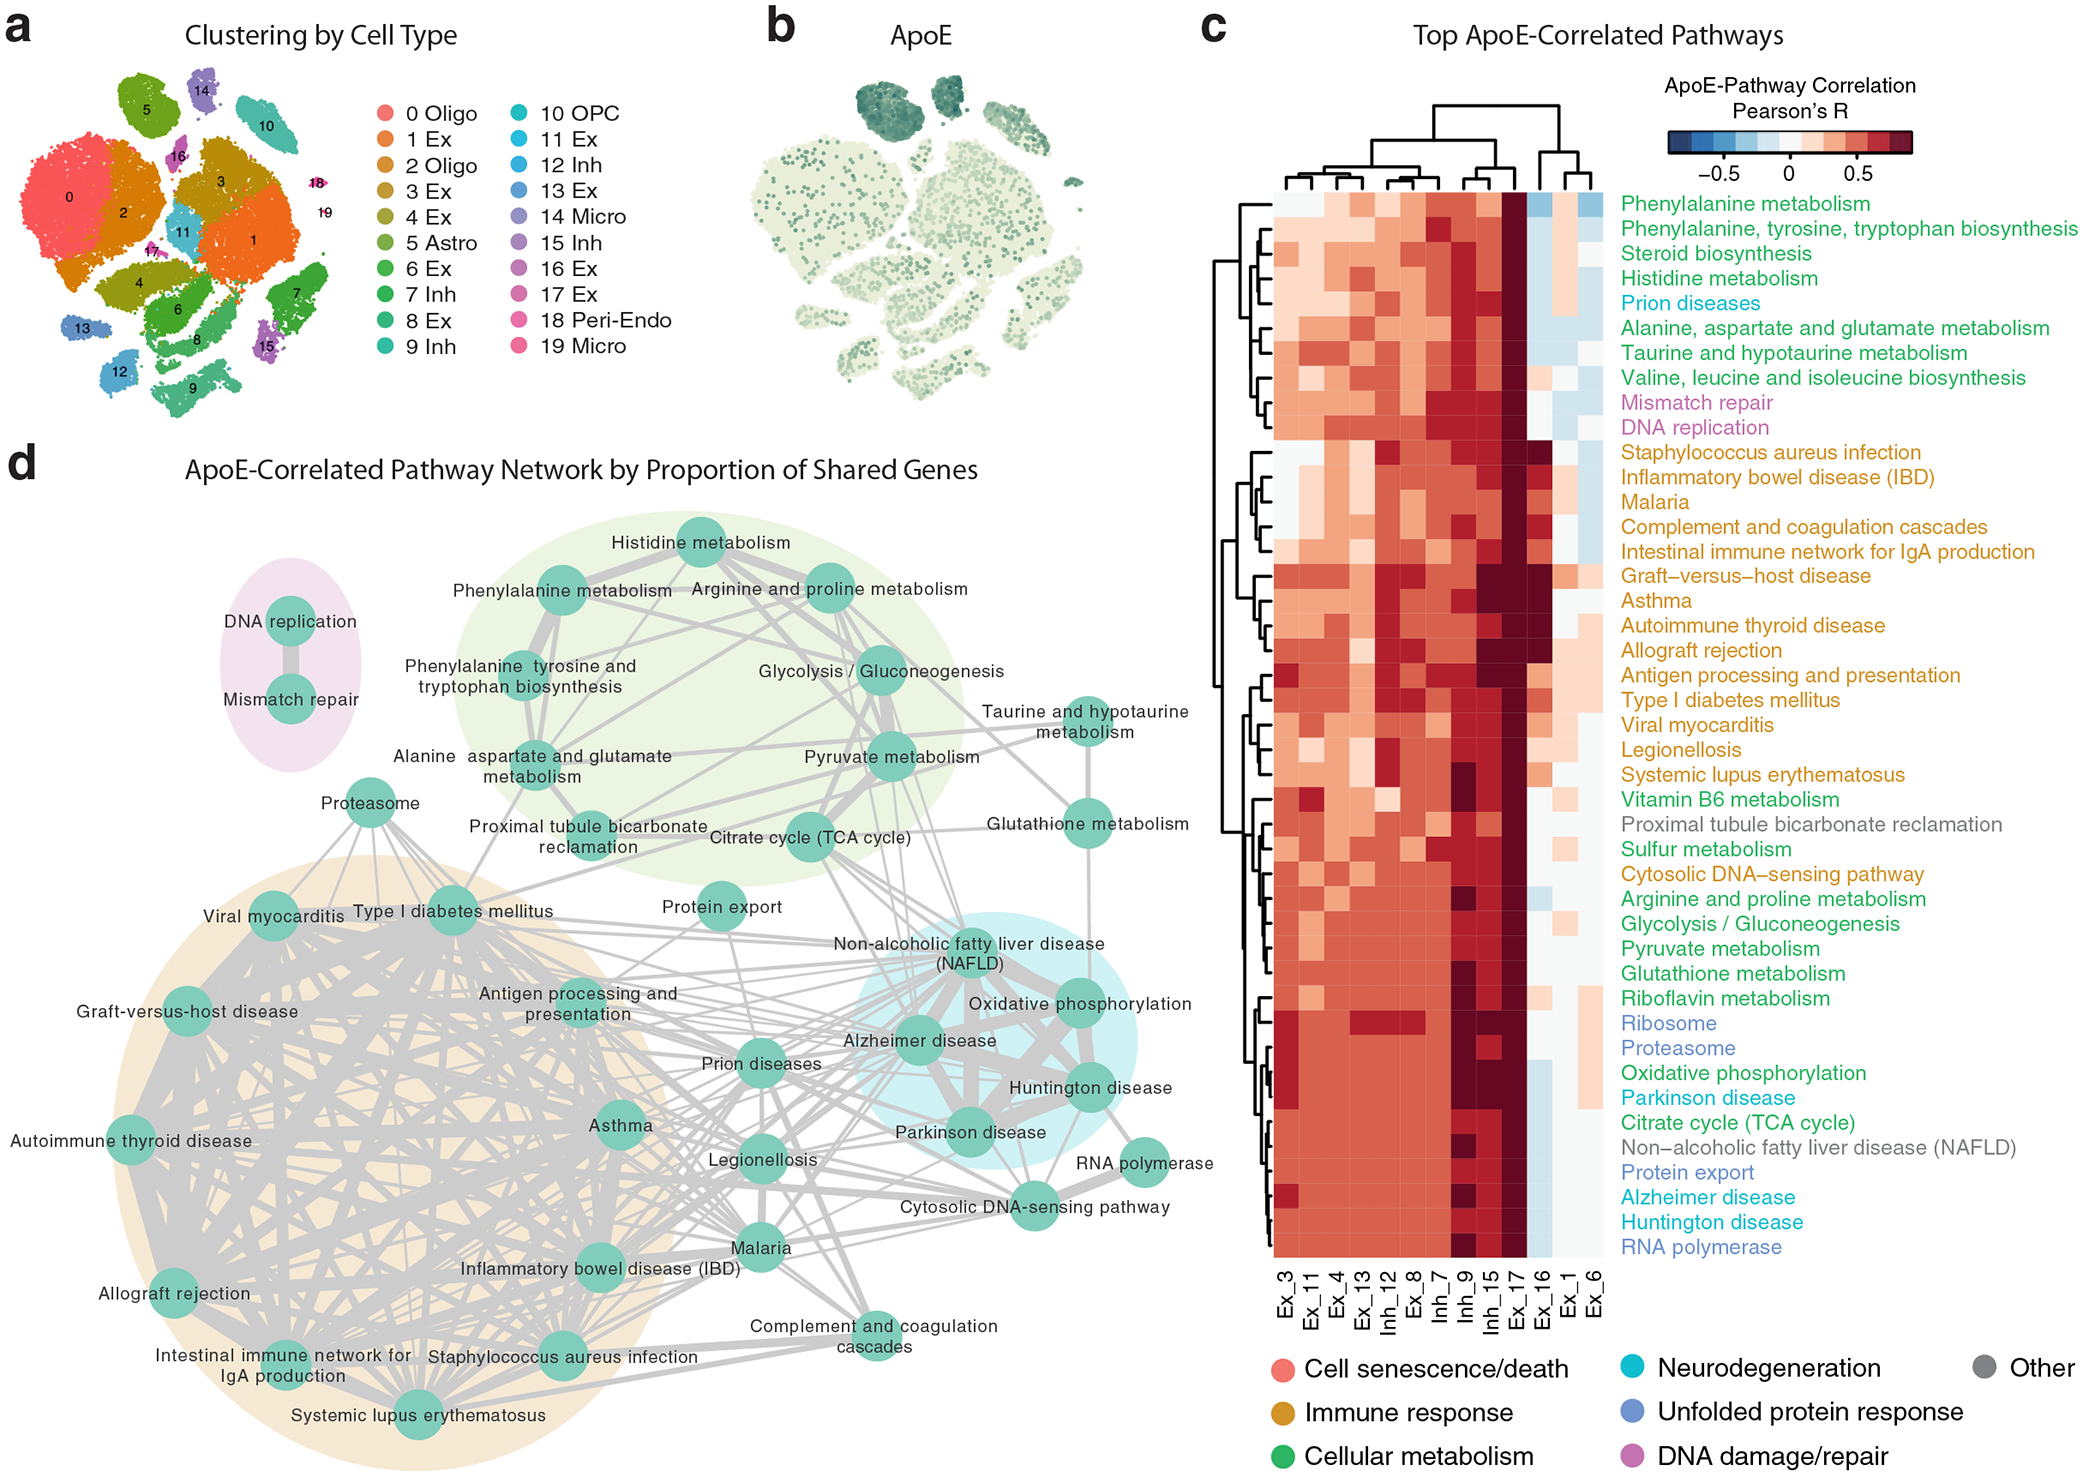
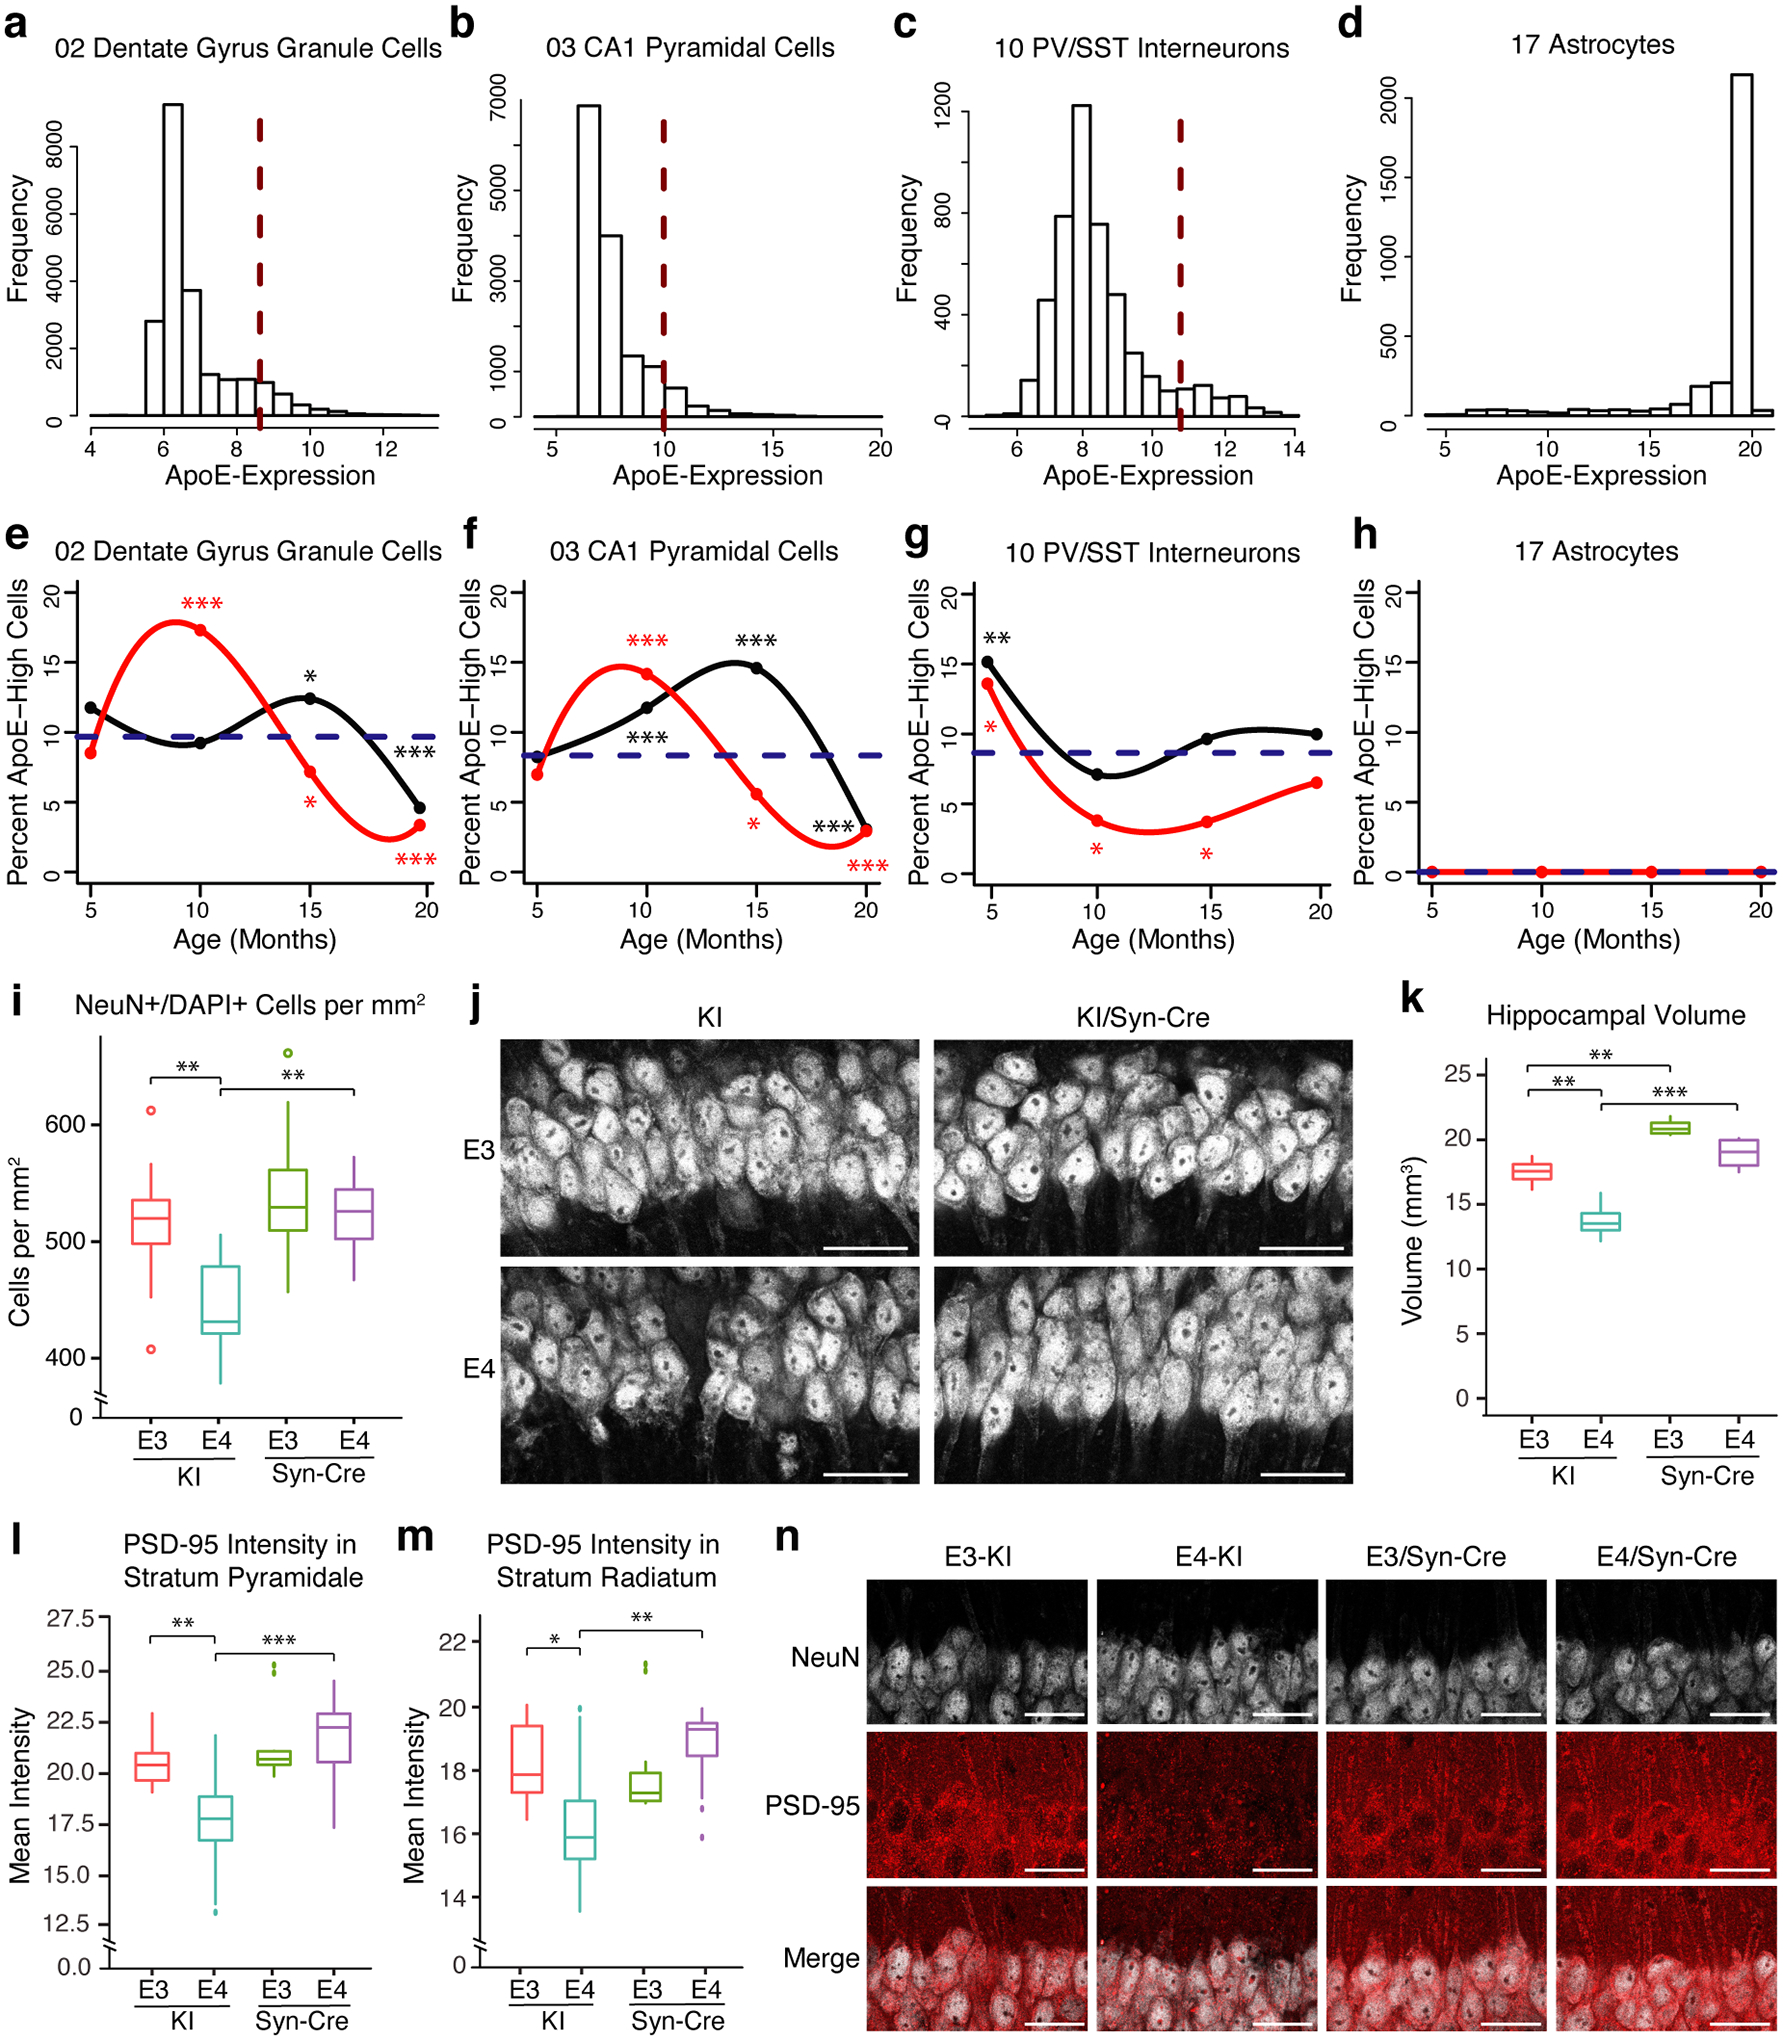
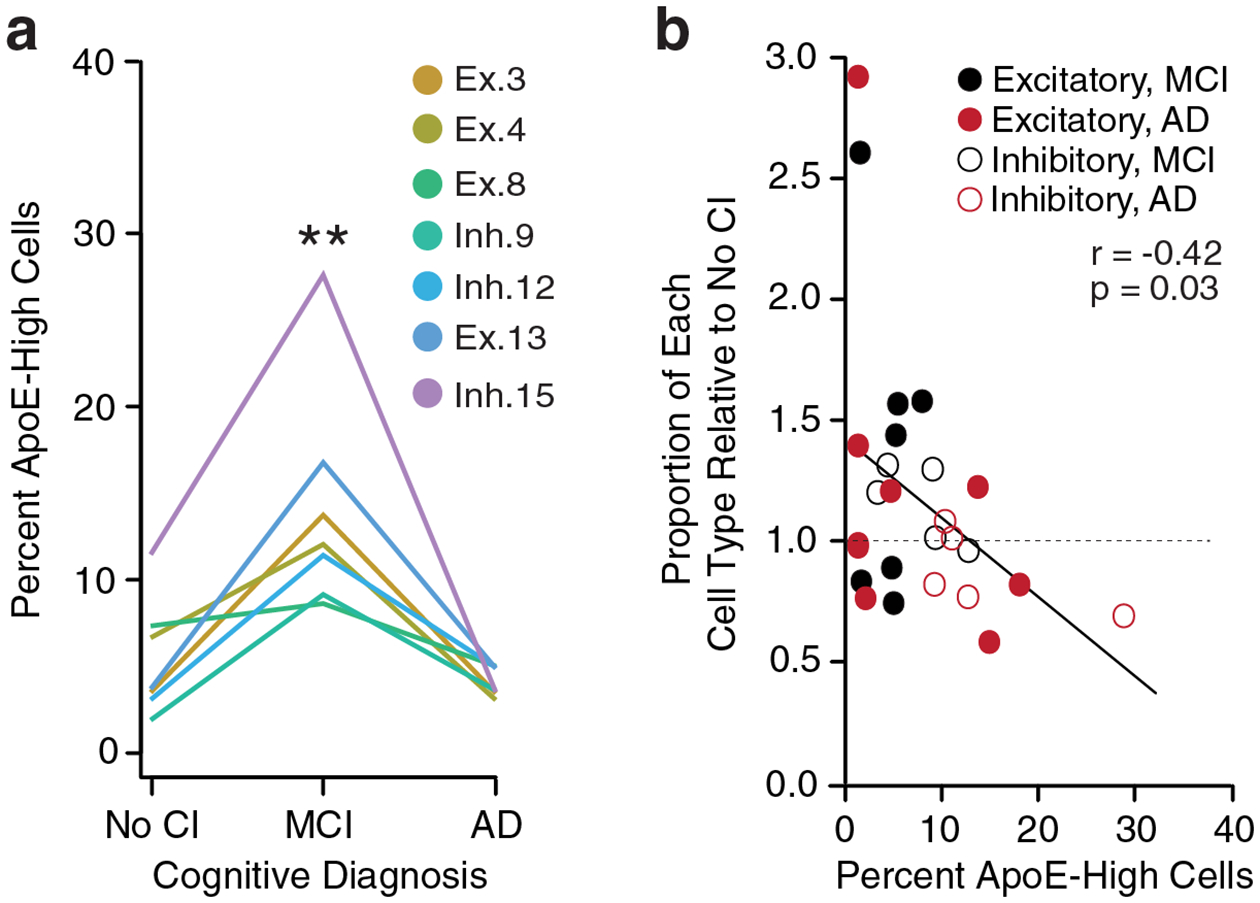
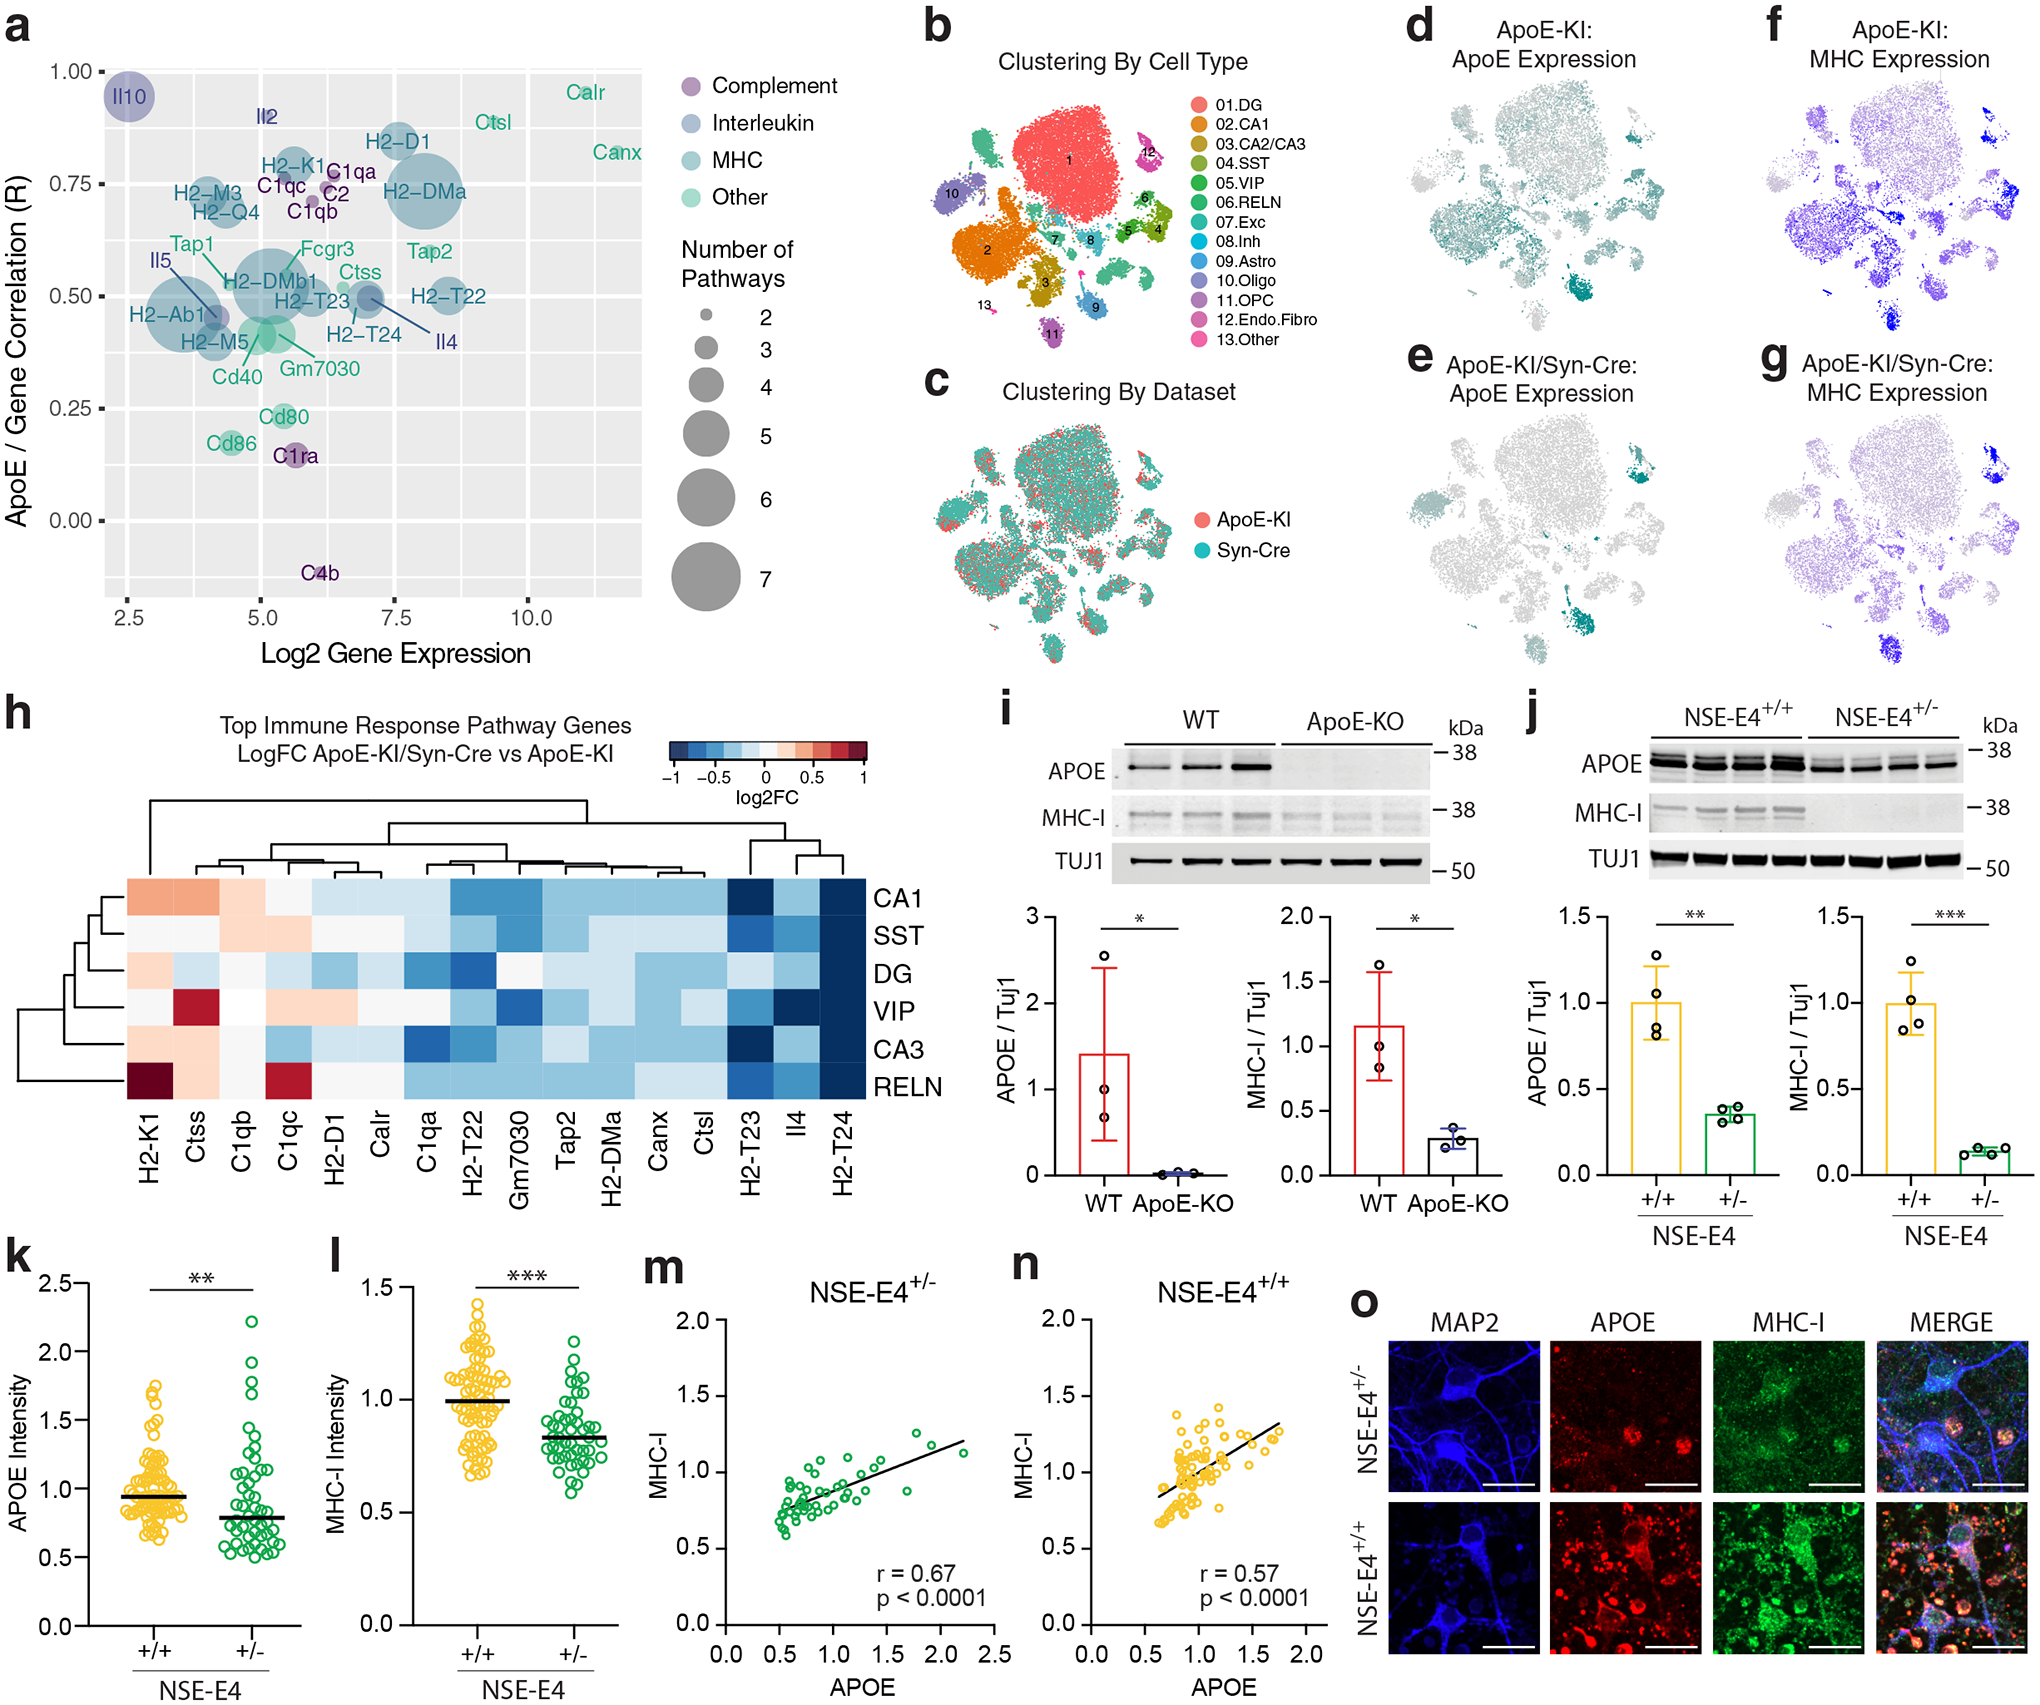
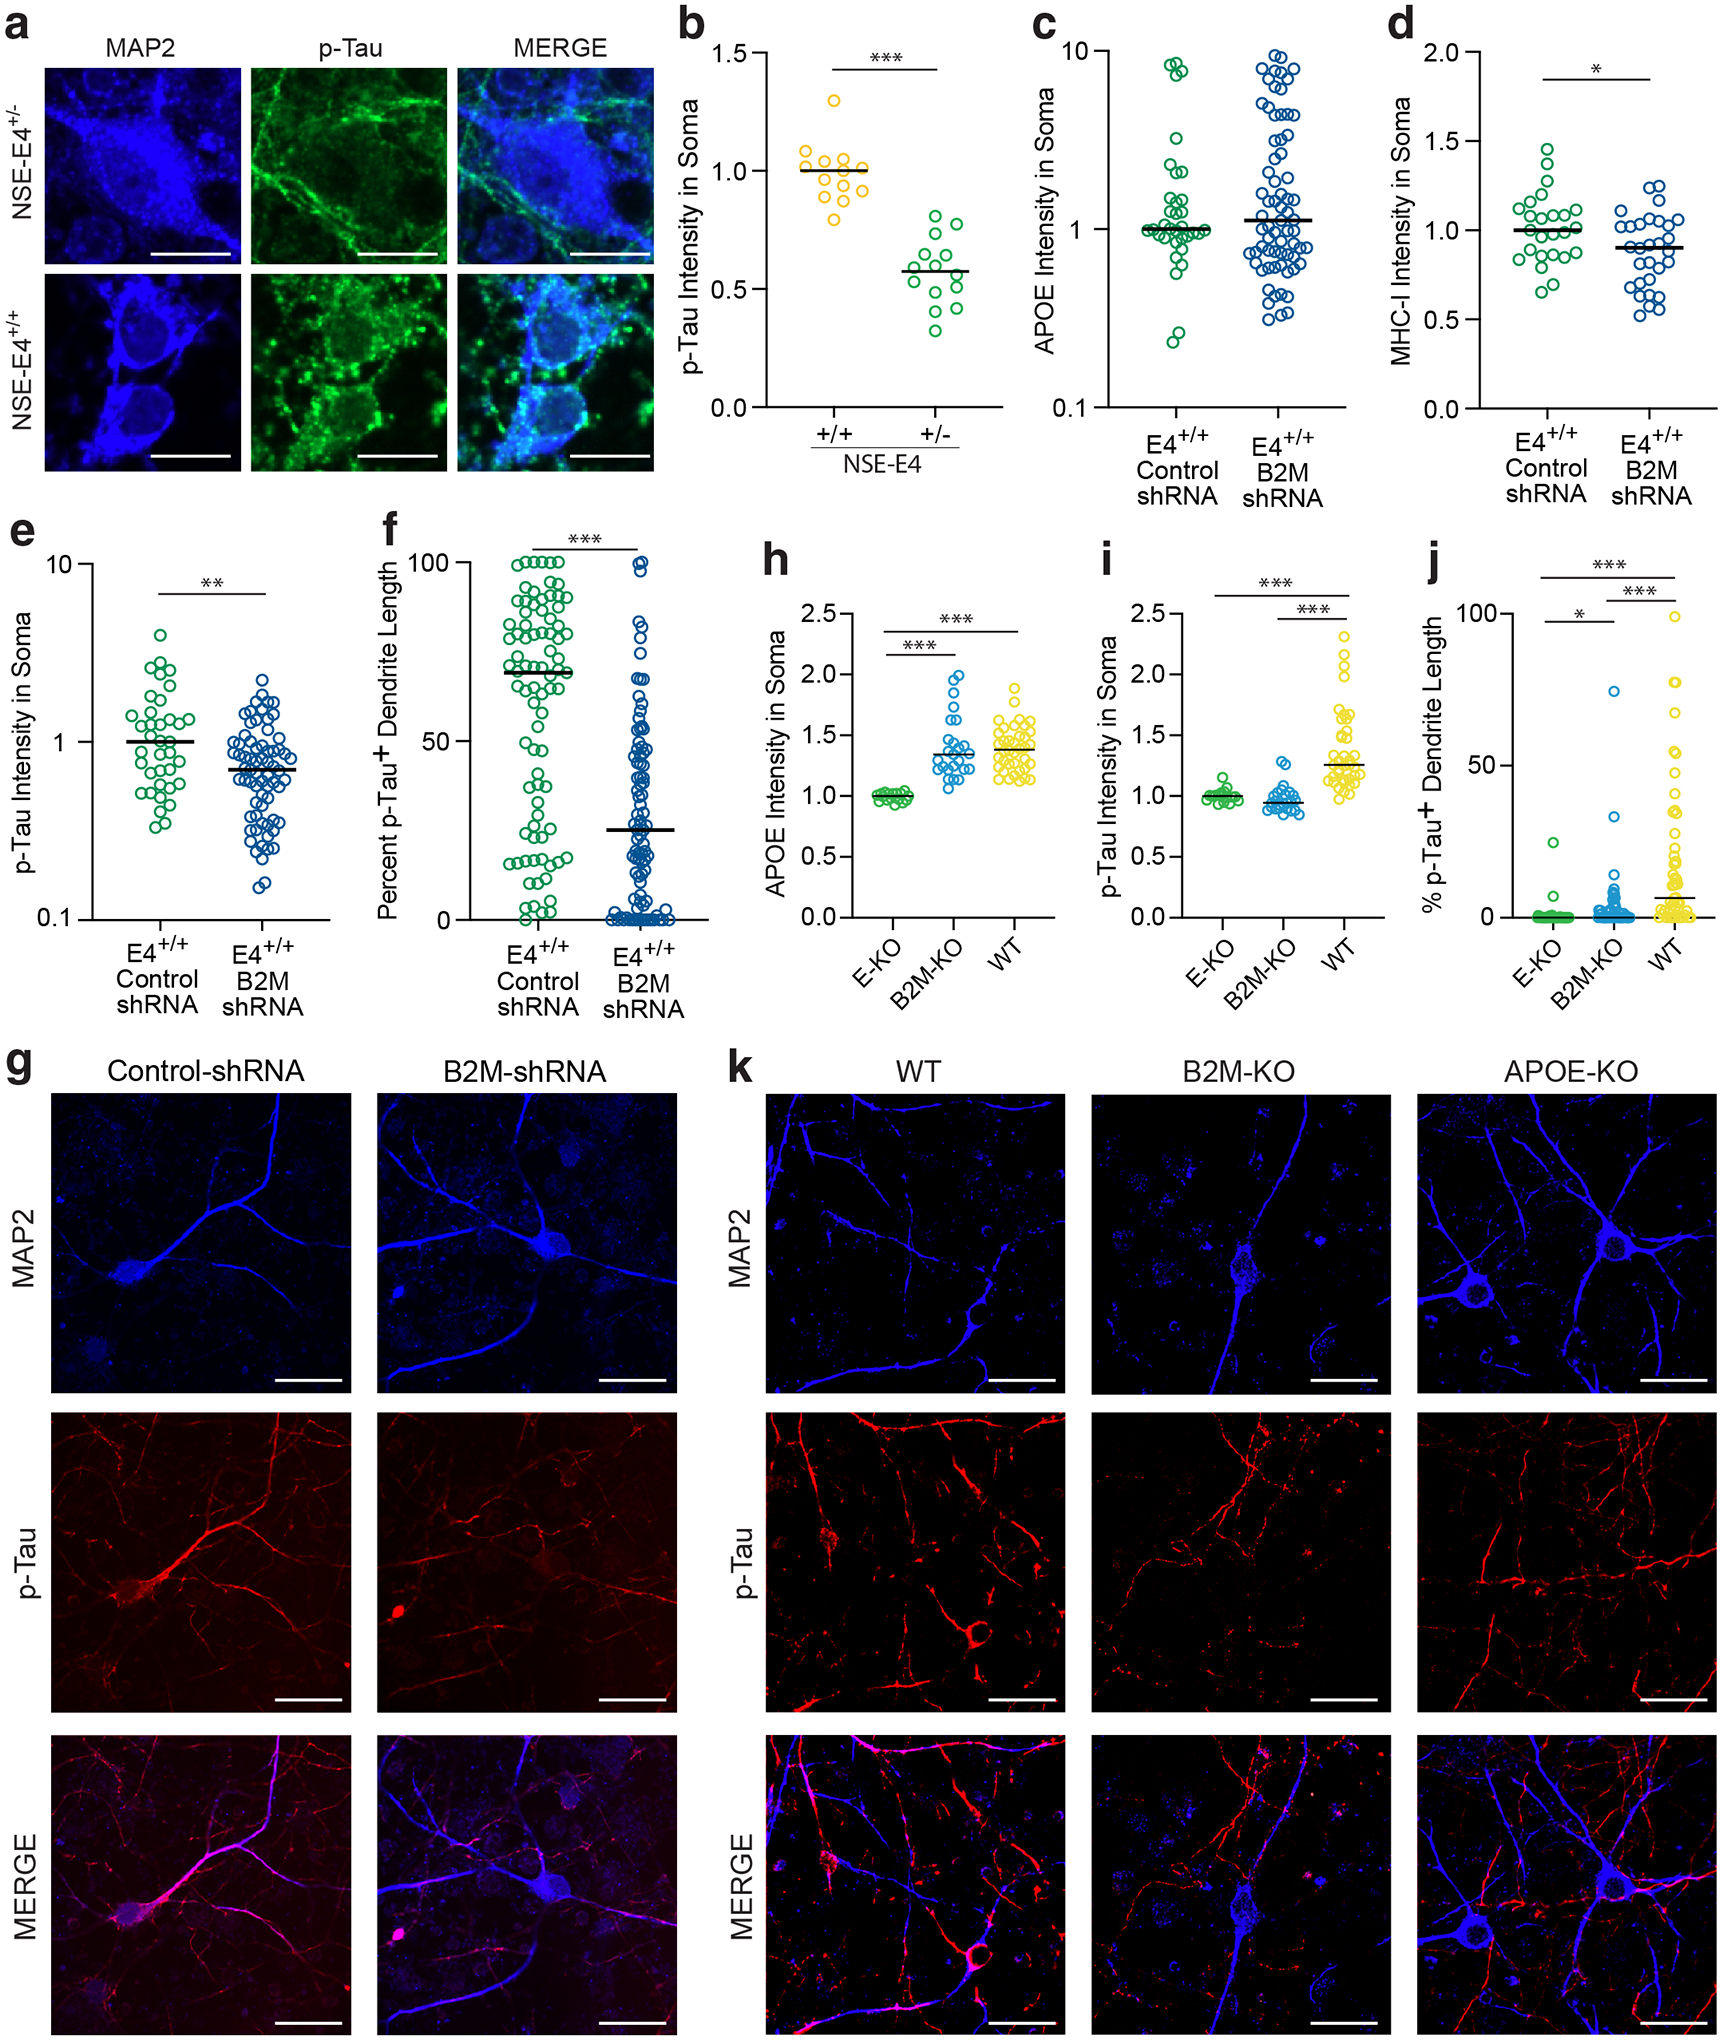
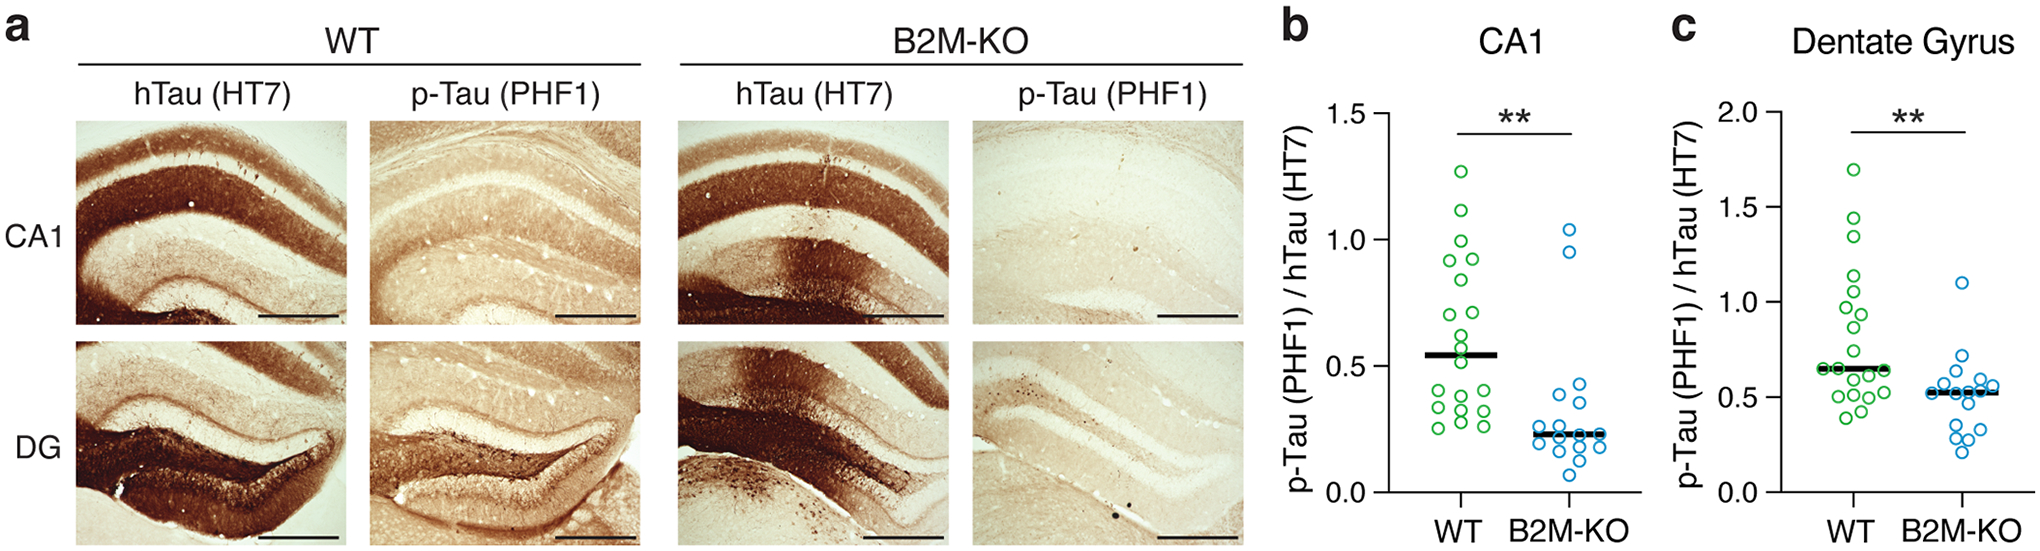
Selective neurodegeneration is a critical causal factor in Alzheimer's disease (AD); however, the mechanisms that lead some neurons to perish, whereas others remain resilient, are unknown. We sought potential drivers of this selective vulnerability using single-nucleus RNA sequencing and discovered that ApoE expression level is a substantial driver of neuronal variability. Strikingly, neuronal expression of ApoE-which has a robust genetic linkage to AD-correlated strongly, on a cell-by-cell basis, with immune response pathways in neurons in the brains of wild-type mice, human ApoE knock-in mice and humans with or without AD. Elimination or over-expression of neuronal ApoE revealed a causal relationship among ApoE expression, neuronal MHC-I expression, tau pathology and neurodegeneration. Functional reduction of MHC-I ameliorated tau pathology in ApoE4-expressing primary neurons and in mouse hippocampi expressing pathological tau. These findings suggest a mechanism linking neuronal ApoE expression to MHC-I expression and, subsequently, to tau pathology and selective neurodegeneration.


Conflict of interest statement

Competing Interests Statement

Y.H. is a co-founder and scientific advisory board member of E-Scape Bio, Inc., GABAeron, Inc., and Mederon Bio, LLC. Other authors declare no competing financial interests.

Figures

Extended Data Fig. 1
Extended Data Fig. 1. Cell cluster identification and quality control measures in snRNA-seq analysis of apoE-KI mice.
a, Feature plots of imputed expression of marker genes for major cell type clusters, as well as matched whole-brain and hippocampal expression of that marker gene in the Allen Institute for Brain Science Mouse ISH Atlas. b, Violin plot depicting marker genes for larger cell classes (such as Syn1 for neurons) as well as marker genes for individual clusters, such as C1ql2 for dentate gyrus granule cells, Pdgfra for OPCs, and Folr1 for choroid plexus. c, tSNE plots of all the nuclei broken out by apoE genotype (columns) and mouse age (rows) showing a lack of batch effect by sample and representation of all major cell types in both genotypes at all ages. d, Quality control measures: number of UMIs, number of genes, and percent mitochondrial reads from each cluster.
Extended Data Fig. 2
Extended Data Fig. 2. ApoE correlation with the first two PCs is not driven by age, genotype, cell type markers, or quality control markers.
a–d, PCA plots demonstrating that the correlation between apoE gene expression and the first 2 principal components (PC1 and PC2) across neuronal cell types is not driven by measures of quality control or read depth, such as number of UMIs, number of genes, or percent mitochondrial reads. e–h, Neither is the apoE expression gradient driven by apoE genotype or mouse age. i–l, Additionally, this apoE expression gradient is not explained by differences in cell type marker expression, such as Syn1 for neurons or Aqp4 for astrocytes (i–l), indicating that the apoE-expression-high cells are not misclassified neuron/astrocyte doublets.
Extended Data Fig. 3
Extended Data Fig. 3. ApoE and pathway correlations are highly similar across apoE genotype and age.
a,b, Heatmaps showing apoE and pathway correlation across cell types for the top 10 apoE-correlated pathways for each neuronal subtype, broken out by apoE genotype and mouse age, demonstrating a strong conservation of apoE and pathway relationships across apoE genotypes and ages.
Extended Data Fig. 4
Extended Data Fig. 4. Principal components analysis (PCA) of snRNA-seq data reveals the most prominent sources of cell-by-cell variation within each neuronal type in wildtype (WT) mouse cortex and the top correlates of neuronal apoE expression are enriched for cellular stress and immune response pathways in WT mouse cortical neurons.
a, Clustering using the Seurat package revealed 16 distinct cellular populations in WT mouse cortex where neurons were purposefully enriched. Marker gene analysis led to the identification of 15 neuronal clusters and one cluster of oligodendrocytes. b, ApoE expression across cell types, demonstrating expression of apoE across neuronal types. c, Heatmap illustrating the correlation between apoE expression and KEGG pathway expression scores for the top 10 apoE expression-correlated pathways from each subset of neurons. d, Network visualization of the proportion of shared genes amongst the pathways represented in c. There are two main modules of inter-related pathways. The blue module is related to neurodegenerative disease and includes the Alzheimer disease, Huntington disease, and Parkinson disease pathways. The orange module, consisting of ten apoE-correlated pathways, relates to immune response. e, In Cluster Ex. 1 cells, apoE expression is strongly correlated with PC1 (Pearson’s correlation coefficient; r = 0.86, p = 1.7 × 10−284) and PC2 (Pearson’s correlation coefficient; r = 0.47, p = 2.5 × 10−54). f, In Cluster Ex.3 cells, apoE expression is strongly correlated with PC1 (Pearson’s correlation coefficient; r = −0.84, p = 2.5 × 10−121) and PC2 (Pearson’s correlation coefficient; r = 0.24, p = 8.8 × 10⁻⁸). g, In Cluster Ex.5 cells, apoE expression is strongly correlated with PC1 (Pearson’s correlation coefficient; r = −0.98, p = 5.1 × 10−251) and PC2 (Pearson’s correlation coefficient; r = 0.13, p = 0.01). h, In Cluster Ex. 6 cells, apoE expression is strongly correlated with PC1 (Pearson’s correlation coefficient; r = 0.44, p = 8.0 × 10⁻¹⁷) and PC2 (Pearson’s correlation coefficient; r = 0.88, p = 4.6 × 10−108). i, In Cluster Ex. 7 cells, apoE expression is strongly correlated with PC1 (Pearson’s correlation coefficient; r = 0.94, p = 2.1 × 10−143) and PC2 (Pearson’s correlation coefficient; r = −0.32, p = 1.8 × 10⁻⁸). j, In Cluster Ex. 8 cells, apoE expression is strongly correlated with PC1 (Pearson’s correlation coefficient; r = 0.96, p = 3.5 × 10−160). k, In Cluster Ex. 9 cells, apoE expression is strongly correlated with PC1 (Pearson’s correlation coefficient; r = −0.88, p = 3.2 × 10−90) and PC2 (Pearson’s correlation coefficient; r = −0.43, p = 5.4 × 10⁻¹⁴). l, In SST Interneurons, apoE expression is strongly correlated with PC1 (Pearson’s correlation coefficient; r = −0.51, p = 1.5 × 10⁻¹⁸) and PC2 (Pearson’s correlation coefficient; r = −0.81, p = 8.7 × 10−62).
Extended Data Fig. 5
Extended Data Fig. 5. Principal components analysis (PCA) reveals the most prominent sources of cell-by-cell variation across neuronal types in the ROSMAP dataset.
Across multiple human neuronal cell types, apoE expression levels correlate with the first two PCs. a, In Cluster 4 Excitatory neurons (n = 3574), apoE expression is correlated with PC1 (Pearson’s correlation coefficient; r = 0.33, p = 2 × 10−91) and PC2 (Pearson’s correlation coefficient; r = 0.52, p = 3 × 10−255). b, In Cluster 8 Excitatory neurons (n = 2482), apoE expression is correlated with PC1 (Pearson’s correlation coefficient; r = −0.36, p = 2 × 10−80) and PC2 (Pearson’s correlation coefficient; r = 0.54, p = 1 × 10−191). c, In Cluster 11 Excitatory neurons (n = 1492), apoE expression is correlated with PC1 (Pearson’s correlation coefficient; r = 0.27, p = 7 × 10⁻²⁶) and PC2 (Pearson’s correlation coefficient; r = −0.48, p = 4 × 10−86). d, In Cluster 7 Inhibitory neurons (n = 2537), apoE expression is correlated with PC1 (Pearson’s correlation coefficient; r = −0.45, p = 2 × 10−127) and PC2 (Pearson’s correlation coefficient; r = −0.12, p = 1 × 10⁻¹⁰). e, In Cluster 12 Inhibitory neurons (n = 1425), apoE expression is correlated with PC1 (Pearson’s correlation coefficient; r = −0.40, p = 4 × 10−55) and PC2 (Pearson’s correlation coefficient; r = 0.67, p = 3 × 10−186). f, In Cluster 15 Inhibitory neurons (n = 897), apoE expression is correlated with PC1 (Pearson’s correlation coefficient; r = 0.54, p = 2 × 10−70) and PC2 (Pearson’s correlation coefficient; r = −0.67, p = 7 × 10−120).
Extended Data Fig. 6
Extended Data Fig. 6. Relationships of neuronal apoE and cellular stress and immune response pathways are replicated in additional human brain snRNA-seq datasets.
a, Clustering of a human brain dataset by cell type (https://portal.brain-map.org/atlases-and-data/rnaseq). b, ApoE expression across cell types, demonstrating expression of apoE across neuronal types. c, Heatmap illustrating the correlation between apoE expression and KEGG pathway expression scores for the top 10 apoE expression-correlated pathways from each subset of neurons. d, Network plot illustrating the proportion of shared genes amongst apoE expression-correlated pathways shared between human and mouse. Edge width represents proportion of shared genes. There are two main modules of inter-related pathways. One (blue) module is related to neurodegenerative disease and includes the Alzheimer disease and Huntington disease. The other (orange) module, consisting of eight apoE-correlated pathways, is related to immune response. e, Clustering of another human dataset by cell type. f, Heatmap illustrating the correlation between apoE expression and KEGG pathway expression scores for the top 10 apoE expression-correlated pathways from each subset of neurons. g, Network plot illustrating the proportion of shared genes amongst apoE expression-correlated pathways. Edge width represents proportion of shared genes. There are two main modules of inter-related pathways. The larger (green) module is related to cellular metabolism. The other (orange) module, consisting of six apoE-correlated pathways, is related to immune response.
Extended Data Fig. 7
Extended Data Fig. 7. Cell cluster identification and apoE expression in the combined set of apoE-KI and apoE-KI/Syn-Cre data.
a, Feature plots of marker genes for major cell types in the combined apoE-KI and apoE-KI/Syn-Cre cell clustering. b, Histograms of apoE expression levels in the combined apoE-KI and apoE-KI/Syn-Cre cohort, showing that even the low levels of apoE expression measured in apoE-KI neurons are true expression, fully separated from the noise levels in apoE-KI/Syn-Cre neurons.
Extended Data Fig. 8
Extended Data Fig. 8. Neuronal expression of apoE predicts neuronal expression of MHC-I genes, and neuronal expression of MHC-I genes predicts Tau tangle, but not β-amyloid, pathology across patients with MCI or AD.
a, Linear regression coefficients (± 95% confidence intervals) for age, sex, apoE4 genotype, clinical diagnosis (MCI or AD relative to control) and average apoE expression level in neurons in predicting the expression of MHC-I genes and B2M gene in neurons of patients from the ROSMAP snRNA-seq cohort depicted in Figure 3. b, Linear regression coefficients (± 95% confidence intervals) for age, sex, apoE4 genotype, clinical diagnosis (MCI or AD relative to control), and MHC-I genes and B2M gene expression in predicting tau tangle pathology in patients from the ROSMAP snRNA-seq cohort depicted in Figure 3. c, Linear regression coefficients (± 95% confidence intervals) for age, sex, apoE4 genotype, clinical diagnosis (MCI or AD relative to control), and MHC-I genes and B2M gene expression in predicting β-amyloid pathology in participants from the ROSMAP snRNA-seq cohort depicted in Figure 3.
Extended Data Fig. 9
Extended Data Fig. 9. Quantification of B2M protein in B2M-shRNA-treated NSE-E4+/+ mouse primary neurons and B2M-KO mouse primary neurons.
a, Western blot of B2M and TUJ1 protein in NSE-E4+/+ mouse primary neurons treated with Lenti-B2M-shRNA or Lenti-scrambled-shRNA control. Data are representative of two primary neuron culture experiments. b, Quantification of B2M/TUJ1 ratio from western blots. B2M protein is significantly reduced in B2M-shRNA-treated neurons as compared to control shRNA-treated neurons (two-sided t-test, p = 0.017, n = 7 per group). c, Western blot of B2M and TUJ1 protein in lysates of WT and B2M-KO mouse primary neurons, showing elimination of B2M in the B2M-KO neurons. The experiment was performed once.
Extended Data Fig. 10
Extended Data Fig. 10. Model of apoE upregulation of MHC-I driving Tau pathology and selective neuronal and synaptic degeneration/loss.
In response to various cellular stressors during aging, increase in neuronal apoE expression, as a molecular switch, triggers aberrant upregulation of neuronal MHC-I, driving Tau pathology and the selective destruction of individual synapses and neurons, potentially (as a hypothesis) by reactive microglia and/or, MHC’s classical partner, CD8+ T-cells. In the AD context, apoE4 exacerbates this process.
Figure 1.
Figure 1.. Principal components analysis (PCA) reveals the most prominent sources of cell-by-cell variation within each cell type in human apoE-KI mouse hippocampus.
a, Experimental design. Hippocampi were extracted from female apoE3-KI and apoE4-KI mice at 5, 10, 15, and 20 months of age (N = 4 per genotype and age). The hippocampi were dissociated, nuclei were labeled with DAPI and isolated using flow cytometry before processing using the 10x Chromium v2 system for snRNA-seq. b, Clustering using the Seurat package revealed 27 distinct cellular populations. Marker gene analysis led to the identification of 16 neuronal clusters (Clusters 1–16) and 11 non-neuronal clusters (Clusters 17–27). c, In Cluster 2 DG cells (n = 21550), apoE expression is strongly correlated with PC1 (Pearson’s correlation coefficient; r = 0.81, p = 0) and PC2 (Pearson’s correlation coefficient; r = 0.37, p = 0). d, In Cluster 4 CA1 Pyramid cells (n = 5684), apoE expression is strongly correlated with PC1 (Pearson’s correlation coefficient; r = −0.76, p = 0) and PC2 (Pearson’s correlation coefficient; r = −0.61, p = 0). e, In Cluster 4 CA2/CA3 Pyramid cells (n = 3488), apoE expression is strongly correlated with PC1 (Pearson’s correlation coefficient; r = 0.82, p = 0) and PC2 (Pearson’s correlation coefficient; r = 0.19, p = 7.1 × 10⁻³⁰). f, In Cluster 10 SST/PV interneurons (n = 4801), apoE expression is strongly correlated with PC1 (Pearson’s correlation coefficient; r = 0.77, p = 0) and PC2 (Pearson’s correlation coefficient; r = 0.11, p = 2.0 × 10⁻¹⁴).
Figure 2.
Figure 2.. The top correlates of neuronal apoE expression in human apoE-KI mouse hippocampus are enriched for cellular stress and immune response pathways.
a, A direct examination of the 10 pathways most correlated with apoE expression in each neuronal cell type reveals pathways related to cellular metabolism, cell death, neurodegeneration, unfolded protein response, DNA damage and repair, and immune response. Color scale represents Pearson’s correlation coefficient; r between apoE expression and expression of each pathway for each cluster of cells. b, Network visualization of the proportion of shared genes amongst the pathways represented in a. There are four main modules of inter-related pathways. The blue module is related to neurodegenerative disease and includes the Alzheimer disease, Huntington disease, and Parkinson disease pathways. The green module relates to cellular metabolism, and the pink module relates to DNA replication and repair. The largest module, consisting of nine apoE-correlated pathways, relates to immune response (orange).
Figure 3.
Figure 3.. Neuronal apoE expression correlates with cellular stress and immune response pathways in brains of persons with MCI or AD.
a, tSNE clustering, showing 9 clusters of excitatory neurons, 4 clusters of inhibitory neurons, two clusters of oligodendrocytes, and clusters consisting of astrocytes, microglia, OPCs, pericytes, and endothelial cells. N = 48 human subjects from ROSMAP. b, Feature plot illustrating relative levels of apoE expression across all cells. Up to 28% of neurons, depending on neuronal subtype and disease status, express apoE at a high level. c, Heatmap illustrating the correlation between apoE expression and KEGG pathway expression scores for the top 10 apoE expression-correlated pathways from each subset of neurons. Color scale represents Pearson’s correlation coefficient; r. d, Network plot illustrating the proportion of shared genes amongst apoE expression-correlated pathways. Edge width represents proportion of shared genes. There are four main modules of inter-related pathways. These include neurodegenerative disease (blue), cellular metabolism (green), DNA damage and repair (pink), and immune response (orange).
Figure 4.
Figure 4.. Neuron-specific knockout of the apoE gene protects from apoE4-induced neuronal, synaptic, and hippocampal volume loss in aged apoE-KI mice (15 months).
a–d, Differences in both the median gene expression and the distribution of apoE expression across hippocampal cell types. Red dashed lines indicate two standard deviations (SD) above the median apoE expression for each cell type, the threshold for apoE-expression-high cells. e–g, Neurons are defined as apoE-expression-high if they express apoE mRNA at more than 2 SD above the median expression (dashed red lines in a–c) for that cell type. The proportion of apoE-expression-high cells varies by age and genotype (apoE3 in black, apoE4 in red). The blue dashed line indicates the expected proportion of apoE-expression-high cells if age and genotype had no effect on this proportion. In e, Chi-square test of independence by age and genotype, n = 21550, p = 1.5 × 10−129; comparing the observed number of apoE-expression-high cells to the number expected if age and genotype had no effect (df = 7; * p < 0.05, *** p < 0.001; Bonferroni-adjusted p-values for individual post-hoc tests are displayed in Supplemental Table 2). h, Astrocytes have no cells more than 2 SD above the median apoE expression. i, j, Aged apoE4-KI mice have a significantly lower density of NeuN/DAPI double-positive cells in CA1, as compared to apoE3-KI mice (two-way ANOVA with Tukey’s HSD, p = 0.003). Neuron-specific apoE-KO rescues neuronal density in CA1 to apoE3-KI levels (p = 0.001). n = 12 apoE3-KI, 11 apoE3-KI/Syn-Cre, 12 apoE4-KI, 12 apoE4-KI/Syn-Cre. Scale bars = 30μm. k, Hippocampal volume is significantly lower in apoE4-KI mice as compared to apoE3-KI mice (two-way ANOVA with Tukey’s HSD, p = 0.004). ApoE4-KI hippocampal volume loss is significantly rescued by the neuron-specific knockout of apoE (p = 0.0002). ApoE3-KI hippocampal volume is also enhanced by the neuron-specific knockout of apoE (p = 0.006). n = 4 per group. l, PSD-95 intensity in CA1 cell bodies is significantly lower in apoE4-KI than in apoE3-KI (two-way ANOVA, Tukey’s HSD post-hoc test, p = 0.007) or apoE4-KI/Syn-Cre (p < 0.001) mice. n = 12 per group. m, PSD-95 intensity in CA1 dendrites is significantly lower in apoE4-KI than in apoE3-KI (two-way ANOVA, Tukey’s HSD post-hoc test, p = 0.039) or apoE4-KI/Syn-Cre (p = 0.006) mice. n = 12 per group. In i, k–m, boxplot central line represents the median, hinges represent the 25th and 75th percentile of the data. Whiskers extend to the farthest data point that does not exceed 1.5x the interquartile range. Data points outside that range are plotted individually. * p < 0.05, ** p < 0.01, *** p < 0.001. n, Representative images of NeuN and PSD-95 immunostaining of CA1 cell bodies and dendrites in the hippocampus of apoE3-KI, apoE4-KI, apoE3-KI/Syn-Cre, and apoE4-KI/Syn-Cre mice. Many similar images were collected from 12 mice per group in one experiment. Scale bars = 30μm.
Figure 5.
Figure 5.. The proportion of apoE-expression-high neuronal cells tracks disease progression in patients with MCI or AD.
a, The percent apoE-expression-high (>2 SD above the median) population in 7 neuron clusters from patients with MCI or AD by clinical diagnosis, showing that these 7 of the 13 neuronal clusters exhibit an increase in apoE-expression-high cells from no cognitive impairment (No CI) to MCI and a decrease from MCI to AD. The percent apoE-expression-high cells is significantly higher in MCI as compared to other stages (Repeated-measures one-way ANOVA with Geisser-Greenhouse correction, n = 13, F = 8.211, p = 0.0082). b, The percent apoE-expression-high cells at one stage of disease predicts the proportion of each cell type relative to its initial frequency at no cognitive impairment (Pearson’s correlation coefficient; r = −0.42, p = 0.03). Solid black dots reflect excitatory neuron clusters’ percent apoE-expression-high cells at No CI and relative proportion at MCI (where a value of 1 is no change). Solid red dots reflect excitatory neuron clusters’ percent apoE-expression-high cells at MCI and cell type proportions at AD. Open circles reflect the same calculations for inhibitory neuron clusters.
Figure 6.
Figure 6.. Neuron-specific knockout of the apoE gene reduces MHC pathway gene, especially MHC-I gene, expression in hippocampal neurons in apoE-KI mice and in primary neurons of WT mice.
a, Bubble plot representing average gene expression, apoE-gene correlation, and pathway representation among the genes represented in at least two of the top apoE-correlated immune-response pathways. b, Clustering of the combined data from hippocampal snRNA-seq of 15-month-old apoE-KI/Syn-Cre mice and 15-months-old apoE-KI mice, clustered by cell type. c, The datasets were successfully combined using CCA for batch correction. d–g, ApoE expression is abolished specifically in neurons in apoE-KI/Syn-Cre mice (e) relative to apoE-KI mice (d). MHC expression score is substantially reduced across neuronal clusters in apoE-KI/Syn-Cre mice (g) relative to apoE-KI mice (f). h, Genes from the immune response pathway that are differentially expressed in apoE-KI/Syn-Cre neurons relative to apoE-KI neurons. Color indicates log2 fold change. Significance is BH-corrected q < 0.05 by the non-parametric two-sided Wilcoxon rank-sum test. Only genes that are significantly differentially expressed in at least one cell type are shown. i, Western blot analysis of apoE and MHC-I expression in primary neurons from WT versus apoE-KO mice reveals a significant decrease in both apoE (one-sided t-test, t = 2.39, p = 0.038, n = 3 per group) and MHC-I (two-sided t-test, t = 3.53, p = 0.024, n = 3 per group) expression in apoE-KO as compared to WT neurons. Bars represent mean ± SD. j, Western blot analysis of apoE and MHC-I expression in primary neurons from NSE-E4+/− versus NSE-E4+/+ mice reveals a significant decrease in both apoE (two-tailed t-test, t = 5.95, p = 0.001, n = 4 per group) and MHC-I (two-tailed t-test, t = 9.40, p < 0.0001, n = 4 per group) expression in NSE-E4+/− as compared to NSE-E4+/+ neurons. Bars represent mean ± SD. k, l, Immunohistochemical analysis of apoE (k) and MHC-I (l) expression in primary neurons from NSE-E4+/− versus NSE-E4+/+ mice reveals a significant decrease in both apoE (two-sided Mann-Whitney test, U = 1439, p = 0.006, n = 132) and MHC-I (two-sided Mann-Whitney test, U = 1084, p < 0.0001, n = 132) expression in NSE-E4+/− as compared to NSE-E4+/+ neurons. m, n, Immunohistochemical analysis reveals a significant positive cell-by-cell association between apoE and MHC-I expression in both NSE-E4+/− (m, Pearson’s correlation coefficient; r = 0.67, p = 2.5 × 10⁻⁷, n = 48) and NSE-E4+/+ (n, Pearson’s correlation coefficient; r = 0.57, p = 1.5 × 10⁻⁸, n = 84) primary neurons. o, Representative images showing immunostained MAP2, apoE, and MHC-I in NSE-E4+/− and NSE-E4+/+ primary neurons. Many similar images were collected from two primary neuron culture experiments. Scale bars = 20μm. In i–l, * p < 0.05, ** p < 0.01, *** p < 0.001.
Figure 7.
Figure 7.. Reducing or eliminating functional MHC-I decreases or rescues AD-related Tau pathologies in apoE4-overexpressing or WT mouse neurons.
a, Representative immunostaining with MAP2 and p-Tau (PHF1) antibody in primary neurons from NSE-E4+/− and NSE-E4+/+ mice. Many similar images were collected from two primary neuron culture experiments. Scale bars = 10μm. b, p-Tau intensity in neuronal cell bodies is significantly lower in NSE-E4+/− than in NSE-E4+/+ primary neurons (two-sided t-test, t = 8.11, p = 1.8 × 10⁻⁸, n = 27). c, ApoE intensity is unaltered in B2M-shRNA-treated NSE-E4+/+ primary neurons as compared to control shRNA-treated NSE-E4+/+ primary neurons (two-sided Mann-Whitney, U = 1168, p = 0.975, n = 103). d, MHC-I intensity is significantly lower in B2M-shRNA-treated NSE-E4+/+ primary neurons as compared to control shRNA-treated NSE-E4+/+ primary neurons (two-sided Mann-Whitney test, U = 250, p = 0.03, n = 55). e, p-Tau (PHF1) intensity is significantly lower in the soma of B2M-shRNA-treated NSE-E4+/+ primary neurons as compared to control shRNA-treated NSE-E4+/+ primary neurons (two-sided Mann-Whitney test, U = 865, p = 0.006, n = 106). f, Percent of dendrite length positive for p-Tau (PHF1) signal is significantly lowered by B2M-shRNA treatment in NSE-E4+/+ primary neurons (two-sided Mann-Whitney test, U = 1835, p = 1.2 × 10⁻⁸, n = 172). g, Representative images of MAP2 and p-Tau (PHF1) staining in control shRNA-treated and B2M-shRNA-treated NSE-E4+/+ primary neurons. Many similar images were collected from two primary neuron culture experiments. Scale bars = 30μm. h, The intensity of apoE staining is significantly higher in B2M-KO (BH-corrected p = 1.2 × 10⁻¹¹) and WT (BH-corrected p = 8.8 × 10⁻¹⁴) mouse primary neurons as compared to apoE-KO primary neurons (two-sided Kruskal-Wallis test, KW Statistic = 39.78, Dunn’s multiple comparisons correction, n = 80). i, p-Tau intensity is significantly reduced in the soma of primary neurons from apoE-KO (BH-corrected p = 6.4 × 10⁻¹⁰) or B2M-KO (BH-corrected p = 6.0 × 10⁻¹¹) mice as compared to those from WT mice (two-sided Kruskal-Wallis test, KW Statistic = 48.53, Dunn’s multiple comparisons correction, n = 80). j, Percent of dendrite length positive for p-Tau (PHF1) signal is significantly reduced in apoE-KO (BH-corrected p = 1.8 × 10⁻⁹) or B2M-KO (BH-corrected p = 6.2 × 10⁻⁶) primary neurons as compared to WT neurons. B2M-KO primary neurons also have a small but significant increase in dendritic p-Tau as compared to apoE-KO neurons (p = 0.02) (two-sided Kruskal-Wallis test, KW Statistic = 46.91, Dunn’s multiple comparisons correction, n = 149). k, Representative images of MAP2 and p-Tau (PHF1) staining in apoE-KO, B2M-KO, and WT primary neurons. Many similar images were collected from one primary neuron culture experiment. Scale bars = 30μm. In b–j, * p < 0.05, ** p < 0.01, *** p < 0.001.
Figure 8.
Figure 8.. B2M-KO protects from p-Tau pathology in a Tau-P301S overexpression mouse model.
a, Representative DAB-stained images of human tau (hTau), with HT7 antibody, and p-Tau, with PHF1 antibody, from the CA1 and dentate gyrus (DG) of WT and B2M-KO mouse hippocampus 6 weeks after injection with AAV2-Tau-P301S. Even with similar expression of hTau, p-Tau was dramatically reduced in both the CA1 and DG of B2M-KO mouse hippocampus as compared to those of WT mouse hippocampus. Many similar images were collected from different groups of mice in one experiment. Scale bars = 500μm. b, p-Tau/hTau ratio was significantly reduced in CA1 of B2M-KO mouse hippocampus as compared to that of WT mouse hippocampus (two-sided Mann-Whitney Test, p = 0.001, n = 20 WT, 16 B2M-KO. c, p-Tau/hTau ratio was significantly reduced in DG of B2M-KO mouse hippocampus as compared to that of WT mouse hippocampus (two-sided Mann-Whitney Test, p = 0.008, n = 20 WT, 16 B2M-KO).

Comment in

Similar articles

Cited by

References

    1. Fu H, Hardy J & Duff KE Selective vulnerability in neurodegenerative diseases. Nat. Neurosci 21, 1350–1358 (2018). - PMC - PubMed
    1. Andrews-Zwilling Y et al. Apolipoprotein E4 causes age- and tau-dependent impairment of GABAergic interneurons, leading to learning and memory deficits in mice. J. Neurosci 30, 13707–13717 (2010). - PMC - PubMed
    1. Huang Y & Mucke L Alzheimer mechanisms and therapeutic strategies. Cell 148, 1204–1222 (2012). - PMC - PubMed
    1. Najm R, Jones EA & Huang Y Apolipoprotein E4, inhibitory network dysfunction, and Alzheimer’s disease. Mol. Neurodegener 14–24 (2019). - PMC - PubMed
    1. Farrer LA et al. Effects of age, sex, and ethnicity on the association between apolipoprotein E genotype and Alzheimer disease: A meta-analysis. JAMA 278, 1349–1356 (1997). - PubMed

Publication types

MeSH terms

Substances