. 2021 Apr 30:14:1937-1948.
doi: 10.2147/DMSO.S310672. eCollection 2021.

The Relationship Between Hemoglobin Glycation Variation Index and Vitamin D in Type 2 Diabetes Mellitus

Affiliations

The Relationship Between Hemoglobin Glycation Variation Index and Vitamin D in Type 2 Diabetes Mellitus

Zelin Li et al. Diabetes Metab Syndr Obes. .

Abstract

Objective: This study aimed to investigate the relationship between hemoglobin glycation variation index (HGI) and vitamin D in patients with type 2 diabetes mellitus (T2DM).

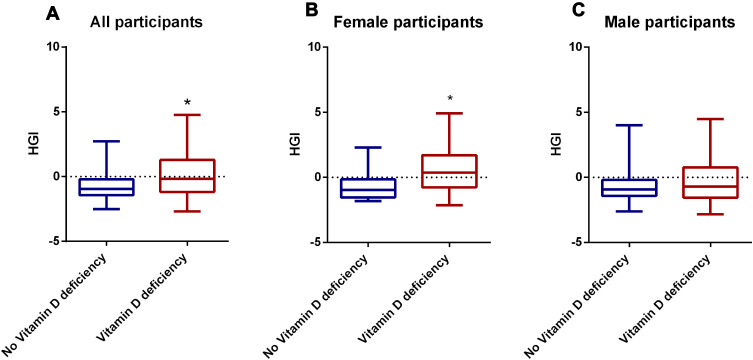
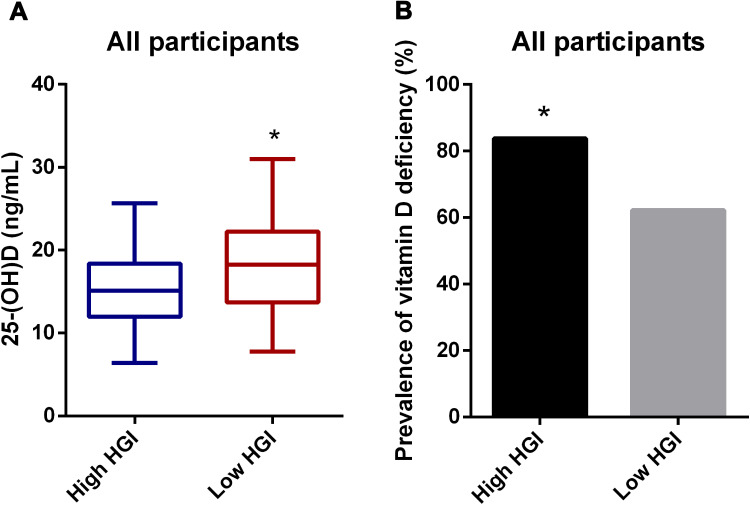
Materials and methods: This is a cross-sectional study that recruited 347 patients with T2DM. The subjects were divided into no vitamin D deficiency group (25(OH)D ≥20 ng/mL) and vitamin D deficiency group (25(OH)D < 20 ng/mL). HGI was calculated as the difference between the measured and predicted values of HbA1c using the linear relationship between HbA1c level and fasting plasma glucose levels. All study participants were divided into high HGI and low HGI groups using the median of HGI as the boundary. At last, the subjects were divided into male group and female group, and these groups were further subdivided into vitamin D deficiency group and no vitamin D deficiency group.

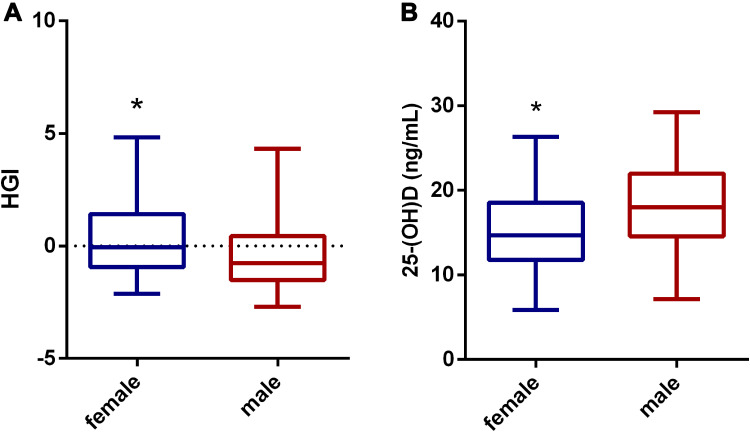
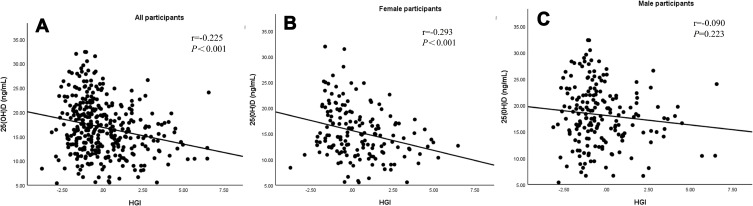
Results: The levels of HGI were significantly higher in the vitamin D deficiency group compared with the no vitamin D deficiency group for all patients. The same was true for female patients but not for male patients. The prevalence of vitamin D deficiency in the high HGI group was higher than that in the low HGI group. The high HGI group had lower vitamin D levels compared to the low HGI group. Compared to the male group, the female group had lower vitamin D levels but higher HGI levels. A negative correlation existed between 25(OH) D and HGI in all subjects, as well as in the female-only subgroups. In the male-only subgroups, there was no correlation between them, and this positive correlation still existed after adjusting for other factors in multilinear regression analysis.

Conclusion: Our study showed for the first time that HGI is inversely associated with vitamin D in all patients with T2DM, and the correlation was also found in female patients, but not in male patients.

Keywords: hemoglobin glycation variation index; type 2 diabetes mellitus; vitamin D.


Conflict of interest statement

The authors report no conflicts of interest in this work.

Figures

Figure 1
Figure 1
Comparisons of HGI in No vitamin D deficiency group and Vitamin D deficiency group.(A) Comparisons of HGI in No vitamin D deficiency group and Vitamin D deficiency group in all participants. (B) Comparisons of HGI No vitamin deficiency group and Vitamin D deficiency group in female participants. (C) Comparisons of HGI in No vitamin deficiency group and Vitamin D deficiency group in male participants. *Denotes significance at a P value of <0.05.
Figure 2
Figure 2
Comparisons of 25(OH)D levels and prevalence of vitamin D deficiency in the High HGI group and Low HGI group for all participants (A). Comparisons of 25(OH)D levels in the High HGI group and Low HGI group for all participants. (B) Comparisons of the prevalence of vitamin D deficiency in the High HGI group and Low HGI group for all participants. *Denotes significance at a P value of <0.05.
Figure 3
Figure 3
Comparisons of HGI levels and 25(OH)D levels in female group and male group for all participants. (A) Comparisons of HGI levels in female group and male group for all participants. (B) Comparisons of the 25(OH)D levels in female group and male group for all participants. *Denotes significance at a P value of <0.05.
Figure 4
Figure 4
The correlation between vitamin D and HGI levels. (A) The correlation between vitamin D and HGI levels in all participants. (B) The correlation between vitamin D and HGI levels in female participants. (C) The correlation between vitamin D and HGI levels in male participants.

Similar articles

Cited by

References

    1. Wang W, Ye S, Qian L, Xing X. Sex-specific association of serum 25-hydroxyvitamin D(3) with insulin resistance in Chinese han patients with newly diagnosed type 2 diabetes mellitus. J Nutr Sci Vitaminol. 2018;64(3):173–178. doi:10.3177/jnsv.64.173 - DOI - PubMed
    1. Zhao H, Zhen Y, Wang Z, et al. The relationship between vitamin D deficiency and glycated hemoglobin levels in patients with type 2 diabetes mellitus. Diabetes Metab Syndr Obes. 2020;13:3899–3907. doi:10.2147/DMSO.S275673 - DOI - PMC - PubMed
    1. Alaei-Shahmiri F, Khamseh ME, Manhoei K, Yadegari H, Kazemi H, Meshkini M. The optimal vitamin D cut-off value associated with hyperglycemia in an Iranian population. J Diabetes Metab Disord. 2020;19(1):5–12. doi:10.1007/s40200-019-00433-y - DOI - PMC - PubMed
    1. Holick MF. Vitamin D: evolutionary, physiological and health perspectives. Curr Drug Res. 2011;12(1):4–18. doi:10.2174/138945011793591635 - DOI - PubMed
    1. Holick MF. Vitamin D deficiency. N Engl J Med. 2007;357(3):266–281. doi:10.1056/NEJMra070553 - DOI - PubMed

LinkOut - more resources