. 2021 Apr 20:15:639527.
doi: 10.3389/fnins.2021.639527. eCollection 2021.

Cell-Type-Specific Gene Modules Related to the Regional Homogeneity of Spontaneous Brain Activity and Their Associations With Common Brain Disorders

Affiliations

Cell-Type-Specific Gene Modules Related to the Regional Homogeneity of Spontaneous Brain Activity and Their Associations With Common Brain Disorders

Junlin Shen et al. Front Neurosci. .

Abstract

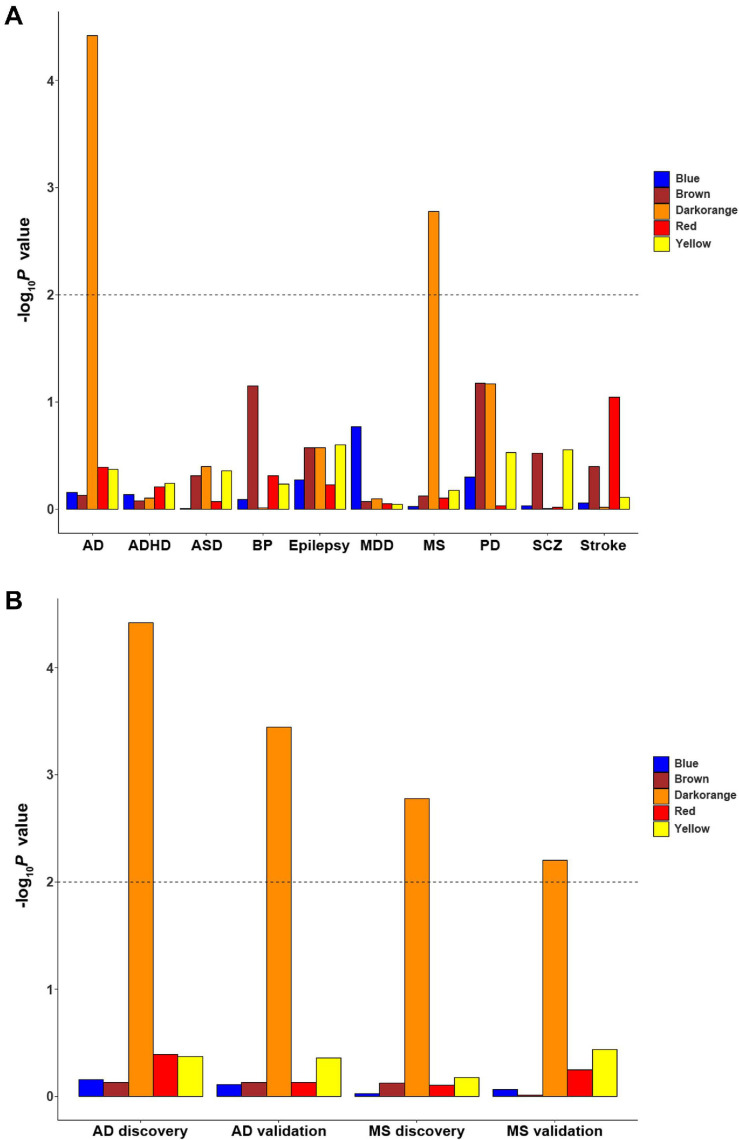
Mapping gene expression profiles to neuroimaging phenotypes in the same anatomical space provides opportunities to discover molecular substrates for human brain functional properties. Here, we aimed to identify cell-type-specific gene modules associated with the regional homogeneity (ReHo) of spontaneous brain activity and their associations with brain disorders. Fourteen gene modules were consistently associated with ReHo in the three datasets, five of which showed cell-type-specific expression (one neuron-endothelial module, one neuron module, one astrocyte module and two microglial modules) in two independent cell series of the human cerebral cortex. The neuron-endothelial module was mainly enriched for transporter complexes, the neuron module for the synaptic membrane, the astrocyte module for amino acid metabolism, and microglial modules for leukocyte activation and ribose phosphate biosynthesis. In enrichment analyses of cell-type-specific modules for 10 common brain disorders, only the microglial module was significantly enriched for genes obtained from genome-wide association studies of multiple sclerosis (MS) and Alzheimer's disease (AD). The ReHo of spontaneous brain activity is associated with the gene expression profiles of neurons, astrocytes, microglia and endothelial cells. The microglia-related genes associated with MS and AD may provide possible molecular substrates for ReHo abnormality in both brain disorders.

Keywords: Allen Human Brain Atlas; cell type; fMRI; gene expression; regional homogeneity.


Conflict of interest statement

The authors declare that the research was conducted in the absence of any commercial or financial relationships that could be construed as a potential conflict of interest.

Figures

FIGURE 1
FIGURE 1
Schematic summary of the study design. This study comprised data preparation, WGCNA, cell-type-specific analysis and enrichment analysis. During data preparation, three mean ReHo maps were obtained from three independent datasets, and a cortical gene transcription matrix was constructed from AHBA. Both ReHo maps and the transcription matrix were assigned to neocortical regions from the HCP Atlas. WGCNA was used to cluster individual genes into gene modules, and spatial correlation was then performed between the ReHo maps and the gene expression profile of each gene module. The significantly correlated gene modules common to the three datasets were considered ReHo-related gene modules. Cell-type-specific analysis was performed for each ReHo-related gene module based on the transcriptomic profiles of neurons, astrocytes, oligodendrocytes, microglia, and endothelial cells from the GSE73721 and GSE67835 series, and the modules that were consistently related to a specific type of neocortical cells in both series were included in the following enrichment analysis. Finally, the identified cell-type-specific modules were annotated by GO and brain disorder enrichment analysis to identify the functions of these modules and to establish their relationships with brain disorders. GO, Gene Ontology; GSE, gene series expression; HCP, Human Connectome Project; ReHo, regional homogeneity; WGCNA, weighted gene coexpression network analysis.
FIGURE 2
FIGURE 2
Identification of ReHo-related gene modules. The original 30 modules in the discovery sample and the two replication samples. Color bar denotes correlation coefficients between ME and zReHo. Warm color represents positive correlations and cold color represents negative correlations with correlation coefficients and Bonferroni-corrected P values listed for each module. ME, module eigengene; zReHo, z transformed regional homogeneity.
FIGURE 3
FIGURE 3
Cell-type-specific analyses for ReHo-related modules in the GSE73721 and GSE67835 series. The size of a given circle corresponds to the cell-type-specific enrichment -log10 Bonferroni-corrected P-values for each module. Solid red indicates significant enrichment in both series, faint red indicates significant enrichment in only one series, and white indicates non-significant in neither series. GSE, gene series expression; ReHo, regional homogeneity.
FIGURE 4
FIGURE 4
The spatial correlation between the ME and zReHo of each cell-type-specific module with the correlation coefficient and Bonferroni-corrected P values. (A) Brown module, (B) blue module, (C) red module, (D) dark orange module, (E) yellow module in the discovery sample. ME, module eigengene; zReHo, z transformed regional homogeneity.
FIGURE 5
FIGURE 5
The top enriched Gene Ontology terms for each cell-type-specific module. (A) neuron (brown) module, (B) neuron-endo (blue) module, (C) astrocyte (red) module and (D,E) microglia (darkorange and yellow) modules. The dashed line indicates the FDR-corrected threshold. Astro, astrocytoma; BP, biological process; CC, cellular component; Endo, endothelium; Micro, microglia; FDR, the corrected P values with the false discovery rate method; MF, molecular function; Neuro, neuron; Oligo, oligodendrocyte.
FIGURE 6
FIGURE 6
The enrichment of cell-type-specific modules in ten common brain disorders. (A) The significant finding is that the microglial module is significantly enriched for MS and AD. (B) The discovery and replication enrichment for MS and AD. The dashed line indicates the Bonferroni-corrected threshold for 5 cell-type-specific modules. AD, Alzheimer’s disease; ADHD, attention deficit hyperactivity disorder; ASD, autism spectrum disorders; BP, bipolar disorder; EP, epilepsy; MDD, major depressive disorder; MS, multiple sclerosis; SCZ, schizophrenia; PD, Parkinson’s disease.

Similar articles

Cited by

References

    1. Ahmad M. H., Fatima M., Mondal A. C. (2019). Influence of microglia and astrocyte activation in the neuroinflammatory pathogenesis of Alzheimer’s disease: rational insights for the therapeutic approaches. J. Clin. Neurosci. 59 6–11. 10.1016/j.jocn.2018.10.034 - DOI - PubMed
    1. Airas L., Rissanen E., Rinne J. O. (2015). Imaging neuroinflammation in multiple sclerosis using TSPO-PET. Clin. Transl. Imaging 3 461–473. 10.1007/s40336-015-0147-6 - DOI - PMC - PubMed
    1. Allen M., Zou F., Chai H. S., Younkin C. S., Crook J., Pankratz V. S., et al. (2012). Novel late-onset Alzheimer disease loci variants associate with brain gene expression. Neurology 79 221–228. 10.1212/WNL.0b013e3182605801 - DOI - PMC - PubMed
    1. Anders S., Pyl P. T., Huber W. (2015). HTSeq–a Python framework to work with high-throughput sequencing data. Bioinformatics 31 166–169. 10.1093/bioinformatics/btu638 - DOI - PMC - PubMed
    1. Arloth J., Bader D. M., Roh S., Altmann A. (2015). Re-annotator: annotation pipeline for microarray probe sequences. PLoS One 10:e0139516. 10.1371/journal.pone.0139516 - DOI - PMC - PubMed

LinkOut - more resources