. 2021 Apr 20:15:652422.
doi: 10.3389/fnana.2021.652422. eCollection 2021.

Application of the Mirror Technique for Three-Dimensional Electron Microscopy of Neurochemically Identified GABA-ergic Dendrites

Affiliations

Application of the Mirror Technique for Three-Dimensional Electron Microscopy of Neurochemically Identified GABA-ergic Dendrites

Petra Talapka et al. Front Neuroanat. .

Abstract

In the nervous system synaptic input arrives chiefly on dendrites and their type and distribution have been assumed pivotal in signal integration. We have developed an immunohistochemistry (IH)-correlated electron microscopy (EM) method - the "mirror" technique - by which synaptic input to entire dendrites of neurochemically identified interneurons (INs) can be mapped due preserving high-fidelity tissue ultrastructure. Hence, this approach allows quantitative assessment of morphometric parameters of synaptic inputs along the whole length of dendrites originating from the parent soma. The method exploits the fact that adjoining sections have truncated or cut cell bodies which appear on the common surfaces in a mirror fashion. In one of the sections the histochemical marker of the GABAergic subtype, calbindin was revealed in cell bodies whereas in the other section the remaining part of the very same cell bodies were subjected to serial section EM to trace and reconstruct the synaptology of entire dendrites. Here, we provide exemplary data on the synaptic coverage of two dendrites belonging to the same calbindin-D28 K immunopositive IN and determine the spatial distribution of asymmetric and symmetric synapses, surface area and volume of the presynaptic boutons, morphometric parameters of synaptic vesicles, and area extent of the active zones.

Keywords: 3D-TEM; GABA interneurons; calbindin; dendritic synaptome; electron microscopy; mirror technique.


Conflict of interest statement

The authors declare that the research was conducted in the absence of any commercial or financial relationships that could be construed as a potential conflict of interest.

Figures

FIGURE 1
FIGURE 1
Workflow of the mirror-technique indicating major steps from identifying immunolabeled neuronal cell bodies (section: Immuno + OsO4) and determining their dendritic synaptome in the adjoining section (section: OsO4). (A) Adjoining sections underwent different procedures, one for revealing a neurochemical for light microscopy, and the other for examining electron microscopic attributes. (B) Neuronal cell bodies cut by the sectioning plane offer correlation between their neurochemically identified nature and synapse distribution of the dendritic processes. (C) Once immunopositive cell bodies have been selected on the section surface the corresponding region of interest (ROI) containing the same cell bodies is determined in the OsO4 section. (D) The ROI is trimmed and re-embedded in a block for EM sectioning. (E) Long series of sections are cut and picked up on Formwar-coated single slot grids. (F) Each section is inspected under TEM and dendrites originating from the selected cell bodies are traced and photographed for quantifying synaptic input distribution. (G) After alignment and segmentation of EM images a three-dimensional reconstruction of the dendrites is generated revealing from synaptic coverage of entire dendrites.
FIGURE 2
FIGURE 2
(A) Adjoining coronal sections were processed for immunostaining, treated with osmium and stained with Nissl, respectively. The primary visual cortex (VISp, asterisks) was determined according to the Allen Brain Atlas. The framed area is shown at higher magnification in panel (B) indicating (yellow rectangle) those layer five calbindin-D28K immuno-positive interneurons which were selected for EM analysis. Scale bars: 1 mm (A); 100 μm (B).
FIGURE 3
FIGURE 3
Light micrographs of adjoining sections viewed from their facing surfaces which represent mirror images. (A) Calbindin-D28K immuno-labeled somata are indicated by the peroxidase reaction end-product (brown). The contour (yellow) of three immunolabeled somata which were cut by the vibratome’s blade is marked (CB + 1–3). (B) Complementary parts of the same somata are seen on the mirror surface of the non-immunolabeled adjoining section. Fiducial landmarks such as cut edges of blood vessels are indicated by green contours. (C,D) Enlarged views of the above three cell bodies (stars) as seen on the mirror surfaces. The silhouette of a nearby astrocyte is indicated by an arrow. Scale bars: 50 μm (A,B); 5 μm (C,D).
FIGURE 4
FIGURE 4
Electron micrographs showing somata (CB + 1–3) in the section processed for immunohistochemistry (Immuno + OsO4) (A) and their complementary parts in the mirror section treated only with OsO4 (B). Representative images of the neuropil in the Immuno + OsO4 (C) and OsO4 alone (D) sections to demonstrate ultrastructural superiority of the latter. The cell membranes are less intact in panel (C) and hence inappropriate for fault-free tracing of small and fast-changing profiles (stars) and unequivocal identification of asymmetric (arrows) and symmetric (arrowheads) synapses. The integrity of membranes in the tissue without immunohistochemistry (D) allows 3D reconstruction of even the smallest structures and a clear identification of symmetric (arrow-head) and asymmetric (arrows) synapses which is rather compromised in panel (C). Broken lines in panel (A) indicate Vibratome chatter whose presence signified section surface. ast = astrocyte; Scale bars: 5 μm (A,B); 1 μm (C,D).
FIGURE 5
FIGURE 5
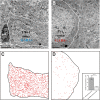
Gamma-aminobutyric acid (GABA) immunohistochemistry using the post-embedding colloidal gold method. Interneuron CB + 1 (A) contained high density of gold particles indicating positive GABA-immunostaining whereas the soma of a pyramidal (Pyr) neuron (B) contained gold particles only at the background level indicating GABA immuno-negativity. (C,D) Schematic figures in order to visualize the presence of nano-gold particles above CB + 1 and Pyr cell bodies (contour lines). Each red dot represents an immuno-gold particle. Note the high density of gold particles in the CB + 1 soma (C) whereas their density reflects background level in the Pyr soma (D). Inset in panel (D) shows statistical comparison between the GABA labeling intensity of cell bodies identified as CB+ and pyramidal shaped, respectively (n indicates the number of TEM micrographs analyzed; data are expressed as mean ± SEM; **** p < 0.0001). Scale bars: 1 μm (A,C); 2 μm (B,D).
FIGURE 6
FIGURE 6
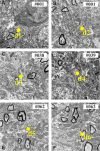
Electron micrographs show the proximal part of dendritic shafts (den1–den6) emerging from the calbindin-D28K (CB + 1) immuno-positive cell body (A–F). Numbers indicate sequential position in the section series. Scale bars: 500 nm.
FIGURE 7
FIGURE 7
(A,B) 3D-rendering of the EM reconstruction of a calbindin-D28K immuno-positive interneuron (CB + 1). Two dendrites (den4 and den6) were reconstructed up to the distal end, while another four dendrites (den1, den2, den3, and den5) and two side branches only partially. For den4 and den6, presumed inhibitory boutons establishing symmetric type of synapse (GABA+) are marked in blue, while presumed excitatory boutons establishing asymmetric type of synapse (GABA−) are marked in red. (C,D) Zoom-on reconstruction of den6 and den4 as delimited by broken lines in panel (B). Scale: 5 μm (A,B); 1 μm (C,D).
FIGURE 8
FIGURE 8
Compression correction of ultrathin sections. (A) Surface view of an EM block (resin-embedded “mirror” section). (B) Photo montage of electron micrographs using ultrathin sections from the surface of the block. The knife edge is indicated by broken lines. Brackets in panels (A) and (B) mark the hight of block surface and that of the sections, respectively, perpendicular to knife edge. Clearly EM sections suffer from considerable (21%) compression. (C,D) One dimensional compression of EM sections needs to be corrected in order to retain due spatial dimensions of the imaged structures. Accordingly, EM images are rotated (STEP 1) in line with the knife edge as exemplified in panel (C) and then expanded (STEP 2) perpendicular to the knife edge (broken line) by an empirically determined compression factor. Note the difference in the shape of the dendritic profile (yellow contours) belonging to the calbindin-D28K immuno-positive interneuron dendrite (CB + 1 den6) before and after correction. Scale bars: 50 μm (A,B).
FIGURE 9
FIGURE 9
Impact of compression correction on the morphometric parameters of presynaptic boutons and synaptic active zones. Changes in morphometric parameters before and after compression corrections are expressed as percentage for individual presynaptic boutons and their active zones. Mean proportional values (%) of surface area/volume ratio of presynaptic boutons (A) and area extent of synaptic active zones (B) are compared between den4 and den6 (n indicates number of boutons and active zones; data area expressed as mean + SD).
FIGURE 10
FIGURE 10
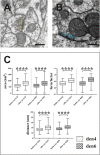
Impact of compression correction on the morphometric parameters of synaptic vesicles. Vesicles located no farther than 50 nm (broken lines) from the active zones of asymmetric [(A), yellow outlines] and symmetric [(B), blue outlines] synapses were included in the statistical analysis (C). Compression gives rise to significant alterations in quantitative measures of area, form factor and spatial separation of synaptic vesicles. ****p < 0.0001; Scale bars: 200 nm.

Similar articles

Cited by

References

    1. Bates A. S., Schlegel P., Roberts R. J. V., Drummond N., Tamimi I. F. M., Turnbul R., et al. (2020). Complete connectomic reconstruction of olfactory projection neurons in the fly brain. Curr. Biol. 30 3183–3199.e6. 10.1016/j.cub.2020.06.042 - DOI - PMC - PubMed
    1. Boey A., Rybakin V., Kalicharan D., Vints K., Gounko N. V. (2019). Gold-substituted silver-intensified peroxidase immunolabeling for FIB-SEM imaging. J. Histochem. Cytochem. 67 351–360. 10.1369/0022155418824335 - DOI - PMC - PubMed
    1. Booker S. A., Gross A., Althof D., Shigemoto R., Bettler B., Frotscher M., et al. (2013). Differential GABAB-receptor-mediated effects in perisomatic- and dendrite-targeting parvalbumin interneurons. J. Neurosci. 33 7961–7974. 10.1523/JNEUROSCI.1186-12.2013 - DOI - PMC - PubMed
    1. Bosch C., Martinez A., Masachs N., Teixeira C. M., Fernaud I., Ulloa F., et al. (2015). FIB/SEM technology and high-throughput 3D reconstruction of dendritic spines and synapses in GFP-labeled adult-generated neurons. Front. Neuroanat. 9:60. 10.3389/fnana.2015.00060 - DOI - PMC - PubMed
    1. Burette A. C., Lesperance T., Crum J., Martone M., Volkmann N., Ellisman M. H., et al. (2012). Electron tomographic analyses of synaptic ultrastructure. J. Comp. Neurol. 520 2697–2711. 10.1002/cne.23067 - DOI - PMC - PubMed

LinkOut - more resources