Review
. 2021 Apr 20:12:572041.
doi: 10.3389/fphys.2021.572041. eCollection 2021.

Does the Brain Function as a Quantum Phase Computer Using Phase Ternary Computation?

Affiliations
Review

Does the Brain Function as a Quantum Phase Computer Using Phase Ternary Computation?

Andrew S Johnson et al. Front Physiol. .

Abstract

Here we provide evidence that the fundamental basis of nervous communication is derived from a pressure pulse/soliton capable of computation with sufficient temporal precision to overcome any processing errors. Signalling and computing within the nervous system are complex and different phenomena. Action potentials are plastic and this makes the action potential peak an inappropriate fixed point for neural computation, but the action potential threshold is suitable for this purpose. Furthermore, neural models timed by spiking neurons operate below the rate necessary to overcome processing error. Using retinal processing as our example, we demonstrate that the contemporary theory of nerve conduction based on cable theory is inappropriate to account for the short computational time necessary for the full functioning of the retina and by implication the rest of the brain. Moreover, cable theory cannot be instrumental in the propagation of the action potential because at the activation-threshold there is insufficient charge at the activation site for successive ion channels to be electrostatically opened. Deconstruction of the brain neural network suggests that it is a member of a group of Quantum phase computers of which the Turing machine is the simplest: the brain is another based upon phase ternary computation. However, attempts to use Turing based mechanisms cannot resolve the coding of the retina or the computation of intelligence, as the technology of Turing based computers is fundamentally different. We demonstrate that that coding in the brain neural network is quantum based, where the quanta have a temporal variable and a phase-base variable enabling phase ternary computation as previously demonstrated in the retina.

Keywords: action potential; error redaction; phase ternary computation; plasticity; quantum phase computation; retinal model; synchronization; timing.


Conflict of interest statement

The authors declare that the research was conducted in the absence of any commercial or financial relationships that could be construed as a potential conflict of interest.

Figures

FIGURE 1
FIGURE 1
The conventional textbook action potential showing the sodium and potassium currents with which it is associated.
FIGURE 2
FIGURE 2
Examples of action potential plasticity from identified neuronal somata of the great pond snail Lymnaea stagnalis (L.) (for locations and properties and functions (where known) of neurons and cell clusters, see Slade et al., 1981; Winlow and Polese, 2014). (A) Action potentials from a fast-adapting pedal I cluster cell, which was normally silent and was activated by a 3 s, 0.4 nA pulse injected into the cell via a bridge balanced recording electrode. The same five spikes are shown in each case: (a) on a slow time base, (b) on a faster time base. The red and green arrows indicate the first and last spikes respectively in each case. Note the temporal variability between spike peaks (previously unpublished data provided from William Winlow’s data bank). (B) Different types of action potentials have different spike shapes (a and c) and trajectories as demonstrated in phase plane portraits (b and d) (a and b) demonstrate the same type 1 action potentials from an RPeF cluster neuron, while (c and d) demonstrate type 2 action potentials from an RPeB cluster neuron (adapted from Winlow et al., 1982 with permission). In the phase plane portraits, the rate of change of voltage (dV/dt) is plotted against voltage itself and the inward depolarizing phase is displayed downward, maintaining the voltage clamp convention. The technique is very useful for determining action potential thresholds (see Holden and Winlow, 1982 for details of the phase plane technique as shown here).
FIGURE 3
FIGURE 3
An example of compartmentalization of axons from a multipolar pleural D group neuron of Lymnaea stagnalis. (A) Spontaneous discharges recorded from the soma of a multipolar pleural D group neuron. The discharge varies between subthreshold depolarisations of varying amplitude to large overshooting action potentials (from Winlow, 1989, with permission). (B) Diagrammatic model of pleural D group neurons. The filled boxes in the axons represent spike initiation sites and the cross hatching represents regions of propagation failure. Each radial axon is spontaneously active and can act to generate spikes independently of the others. The electrical synapses appear to keep the axons functionally compartmentalised from one another (Reproduced, with permission, from Haydon and Winlow, 1982).
FIGURE 4
FIGURE 4
Modulation of action potential frequency, shape and trajectories from identified Lymnaea neurons by (A) depolarising currents and (B) inhibitory synaptic inputs. (A) In a right pedal A (RPeA) cluster neuron, action potential frequency, shape and phase plane trajectory are modified by maintained depolarizing and hyperpolarizing currents, which modify the action potential properties. All spikes in the traces at left are superimposed in the middle trace and in the phase plane portraits at right. Note how the action potential peak at V.d shifts either side of the superimposed orange line, while threshold (superimposed green line) remains temporally constant and V.d is even more clearly variable in the phase plane representations. Similar effects are produced by excitatory and inhibitory synaptic inputs (adapted from Winlow et al., 1982 with permission). (B) Effects of monosynaptic i.p.s.p.s from the giant dopamine-containing neuron, RPeD1 (right pedal dorsal 1), on visceral J cell action potentials (for detail see Winlow and Benjamin, 1977). (a) Upper trace, J cell; lower trace RPeD1 (ac coupled and filtered). (b) Phase plane portraits of J cell action potentials: 1. pre-control; 2. phase plane portraits of 32 successive action potentials (peak of spike 1 denoted by red arrow, spike 3 by green arrow); 3. post-control of the last 10 action potentials shown above. After inhibition by RPeD1 both V.d and V.r were increased, but as the cell accelerated following inhibition both V.d and V.r declined below control values (adapted from Winlow, 1987, with permission).
FIGURE 5
FIGURE 5
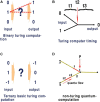
In quantum computation network timing does not require an external clock. This form of computation only requires input to reflect consistent outputs for given values and here we compare it with Turing computation where clock speed synchronises input with output. Panel (A) is an illustration of conventional binary computation of inputs and outputs. The exact network that separates the input from the output is indicated by (?) and the most obvious pathways are shown as dotted lines and gating within the network (?), forms this pathway. This gating represents a single command and must be executed within the set time allocated between the input and output as defined by some external clock. (?) May represent a complex network, flow through the network is defined node to node by precise timing between those nodes in exactly the same way and the outputs are always synchronised by clock-speed (as in the central processing unit of a computer). Panel (B) illustrates binary computation in a conventional space split between input nodes with binary properties of (0) and (1) respectively and giving a result of (0). (t1) Represents the timing from input nodes (0) and (1) respectively. (t2) Represents the time taken for the gated node at (t2) to react to the inputs (0) and (1) according to a set program that defines the output from these specific inputs as being (0). (t3) Represents the time from the gated output to the exit node. Quantum computing applied to 5 panel (B) combines t1 + t2 to represent one quanta of binary information in a parallel network. In a conventional neural network computer as used in AI or SpiNNaker (Furber and Temple, 2007) an emulator using spiking AP, where latencies of timing are fixed and arranged so that (t1) and (t3) are uniform t1 + t2 +t3 are equivalent to clock speed effectively synchronising each command. This is the mechanism apparent from the definition of a Turing type machine and evident in all practical applications of modern computing. Panel (C) is an illustration of a ternary Turing machine, note synchronisations are performed by external clock and this is not applicable to a brain neural network. Panel (D) illustrates a non-Turing quantum machine such as evidenced in the brain neural network. P is a point of convergence thus computation in the network and timing between nodes a and b to P of quanta (in red) is determined by the speed at which quanta flow between the nodes (black dots). Computation at P depends upon the quantal information (which may be any base), the mechanism at P, and the timing of interference between quanta. In a binary Turing machine (B) the quanta are fixed between t1+t2 by clock speed. In a brain neural network timing is defined by the speed of neurons and not by a clock. For the APPulse or action potential, x to z, and x2 to z2 are represented by the threshold to refractory periods of each quantum, respectively: computation at the P is defined by the timing of each quantum and how they react on collision. In the case of the action potential and the APPulse collision between threshold and refractory periods results in annulment of the succeeding quanta. This results in computation through the network. This is a fundamental process in quantum computation and can be applied to all base and temporal computation in a neural network where the rules at P may differ.
FIGURE 6
FIGURE 6
Examples of quantum phase ternary interference between CAPs. Panels (A–E) are illustrations of CAP’s travelling along the surfaces of the neuron membrane just before collisions at the axon hillock (h). The threshold of each CAP is highlighted in red while the refractory period is coloured blue. These are not to scale. Panel (A) illustrates a single neuron with three axons converging on an axon hillock or cell body. Two CAP’s (i) and (ii), move in the direction of the axon hillock where they will collide. In this case both CAP’s (i) and (ii), are in phase with the thresholds overlapping. These CAPs will fuse and continue a single CAP. (B) The same two CAP’s (i) and (ii), are in phase with the thresholds overlapping and will fuse and continue as one CAP as in panel (A), but a third CAP (iii) arrives slightly after the other two and its threshold encounters the refractory period of the other two and is annulled. (C) The same two CAP’s (i) and (ii), are in phase with the thresholds overlapping. These CAP will fuse and continue as one CAP as before, but in this case the threshold of the third CAP (iii) arrives at the axon hillock after the first two have fused and their respective refractory periods have no effect on it. The result is that two CAPs will pass into the axon at right. In panel (D) (L) represents the refractory time of each CAP, whilst in panel (E) (t) represents the timing of the activation-threshold at (z), the point of computation. In a parallel network (D) where CAP’s converge any time greater than (t) and less than (L) will result in phase change. This phase change changes the distance between successive CAP’s and therefore frequency. Where activation-thresholds become desynchronised phases become annulled.
FIGURE 7
FIGURE 7
Neural networks in the retina. (A) Illustration of a brain neural network showing changes in latency between nodes (from Johnson and Winlow, 2019). Panel (B) shows 12 cones (blue lines) converging upon a single bipolar cell (red lines). Here time, t1, changes relative to t. Panel (C) is an enlargement showing a succession of CAPs arriving at the point of computation (p). During fixed light intensity each cone will cause CAP’s to flow towards the point of computation (p) and CAPs are moving from left to right. Activation-thresholds that allow a CAP to continue after computation are shown by the red lines. All CAP in neurite (ii) are annulled. The time (p) to (x) is equivalent to the refractory period of the CAP of neuron (i). Refractory period (s) is selective and all other CAPs are annulled during this period. The result is that time between points of computation (z) to (p) is dependent upon only the time from the end of refractory period (x) to the next activation-threshold (z). This is then reflected in the spike timing from the RGCs. The interval (x) to (z) over any time period is a mean sample when calculated between successive CAPs. This results in the calculation of mean sampling by quantum phase ternary computation. Before collision the timing of each successive CAP along a neuron can be considered as a minute change in frequency. Panel (D) illustrates a straightened disordered brain neural network such as in Panel (A). Frequencies of inputs (a) and (b) result in changes to frequency outputs (c), (d), and (e). In the network of (d) distances have been resolved into phase lengths of quanta. The network represents computation between different time dimensions illustrated by λ. As quanta arrive at different time at each node (between nodes quanta may arrive asynchronously but are digitised) convergence and interaction will take place where phases differ. This interaction will result in distinct changes in frequencies of output for distinct changes in frequencies of input.

References

    1. Almog M., Barkai T., Lampert A., Korngreen A. (2018). Voltage-Gated sodium channels in neocortical pyramidal neurons display cole-moore activation kinetics. Front. Cell. Neurosci. 12:187. 10.3389/fncel.2018.00187 - DOI - PMC - PubMed
    1. Andreae L. C., Burrone J. (2014). The role of neuronal activity and transmitter release on synapse formation. Curr. Opin. Neurobiol. 27 47–52. 10.1016/j.conb.2014.02.008 - DOI - PMC - PubMed
    1. Bean B. F. (2007). The action potential in mammalian neurons. Nat. Rev. Neurosci. 8 451–461. 10.1038/nm2148 - DOI - PubMed
    1. Behrens C., Schubert T., Haverkamp S., Euler T., Berens P. (2016). Connectivity map of bipolar cells and photoreceptors in the mouse retina. ELife 5:e20041. 10.7554/eLife.20041 - DOI - PMC - PubMed
    1. Bourque C. (1990). Intraterminal recordings from the rat neurohypophysis in vitro. J. Physiol. 421 247–262. - PMC - PubMed

LinkOut - more resources