. 2020 Mar 16;125(5):e2019JD031767.
doi: 10.1029/2019jd031767. Epub 2020 Feb 14.

GEOS-S2S Version 2: The GMAO High Resolution Coupled Model and Assimilation System for Seasonal Prediction

Affiliations

GEOS-S2S Version 2: The GMAO High Resolution Coupled Model and Assimilation System for Seasonal Prediction

Andrea Molod et al. J Geophys Res Atmos. .

Abstract

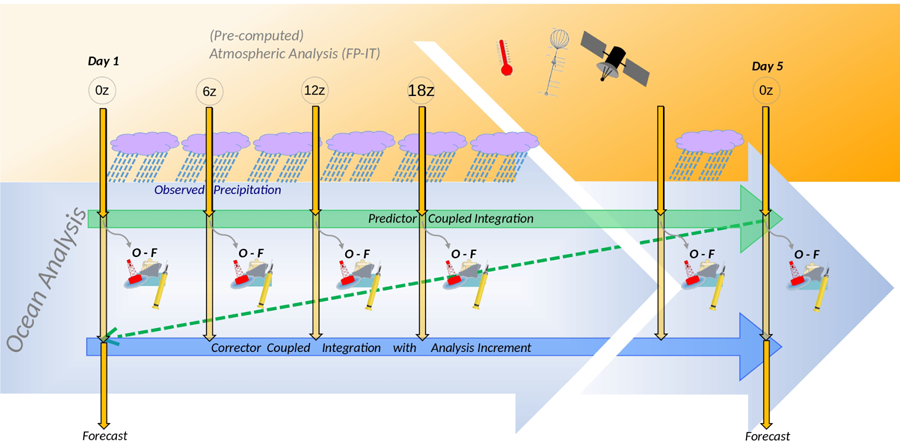
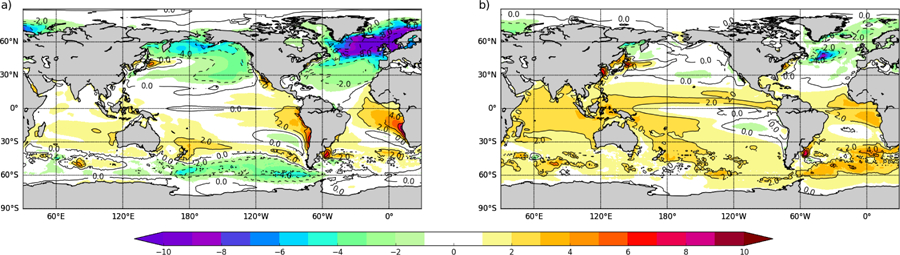
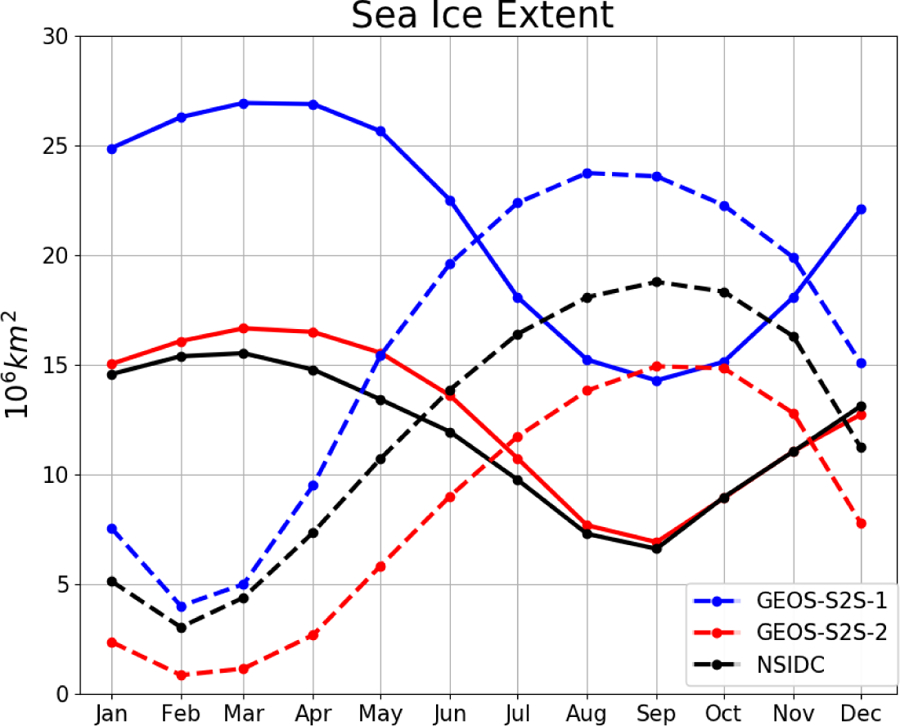
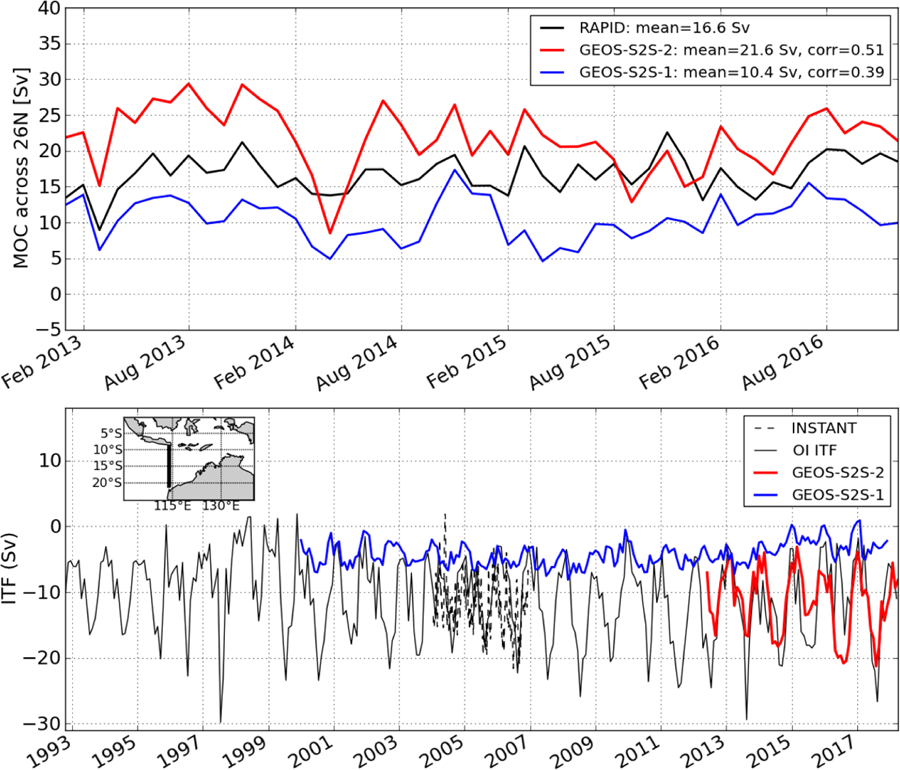
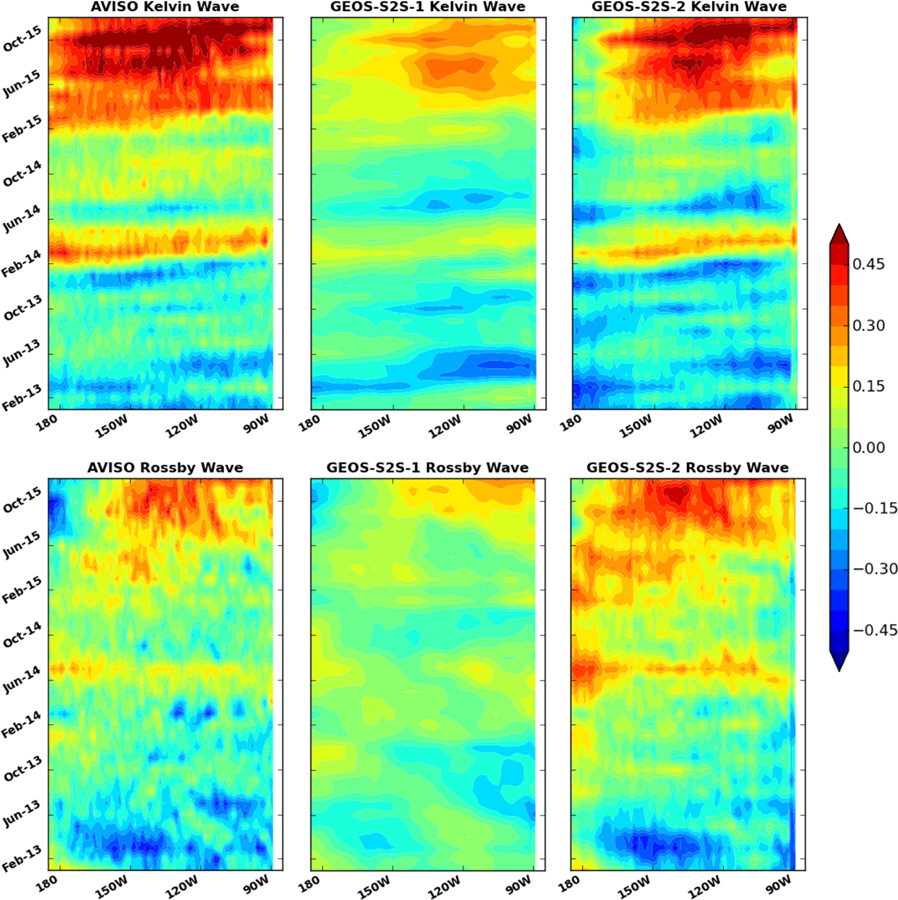
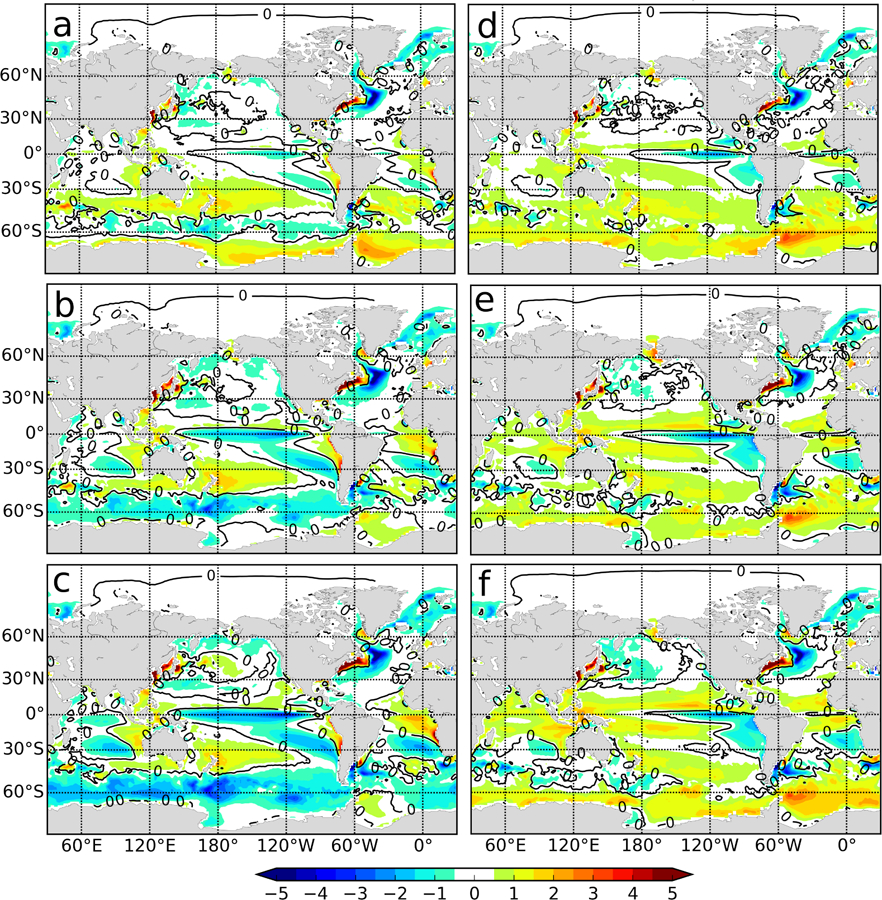
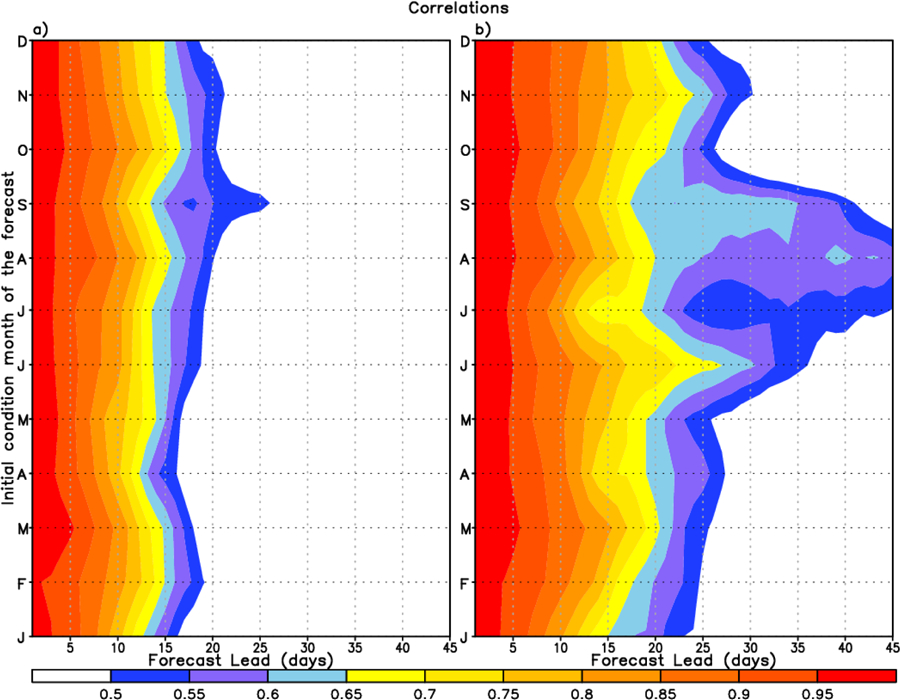
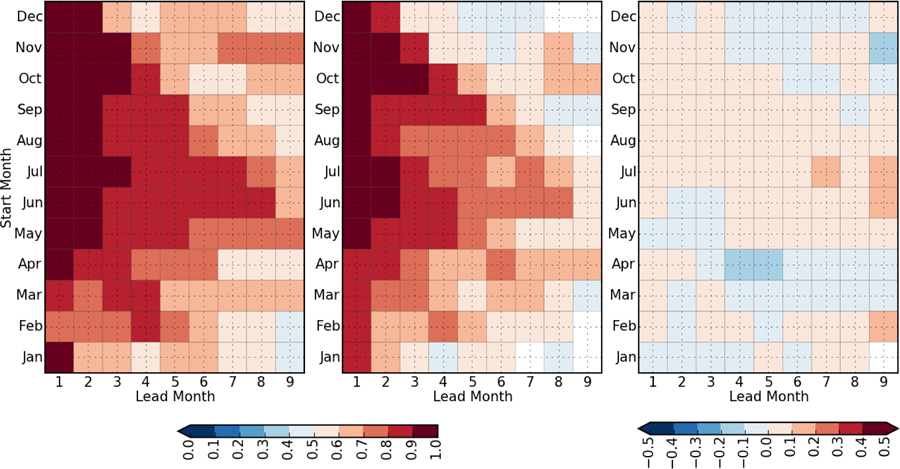
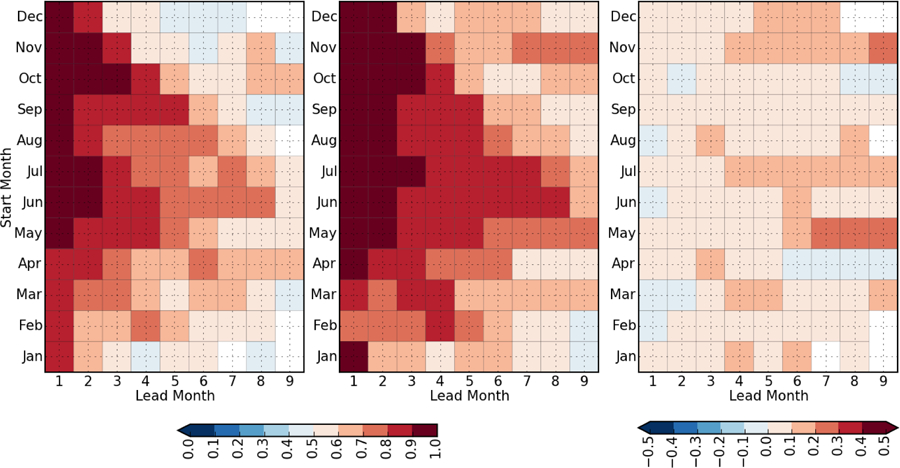
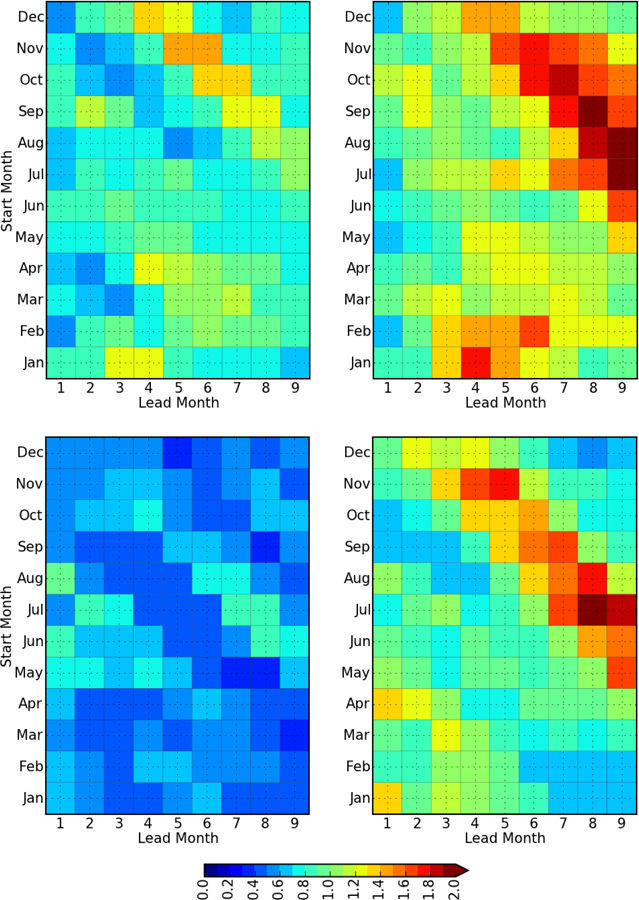
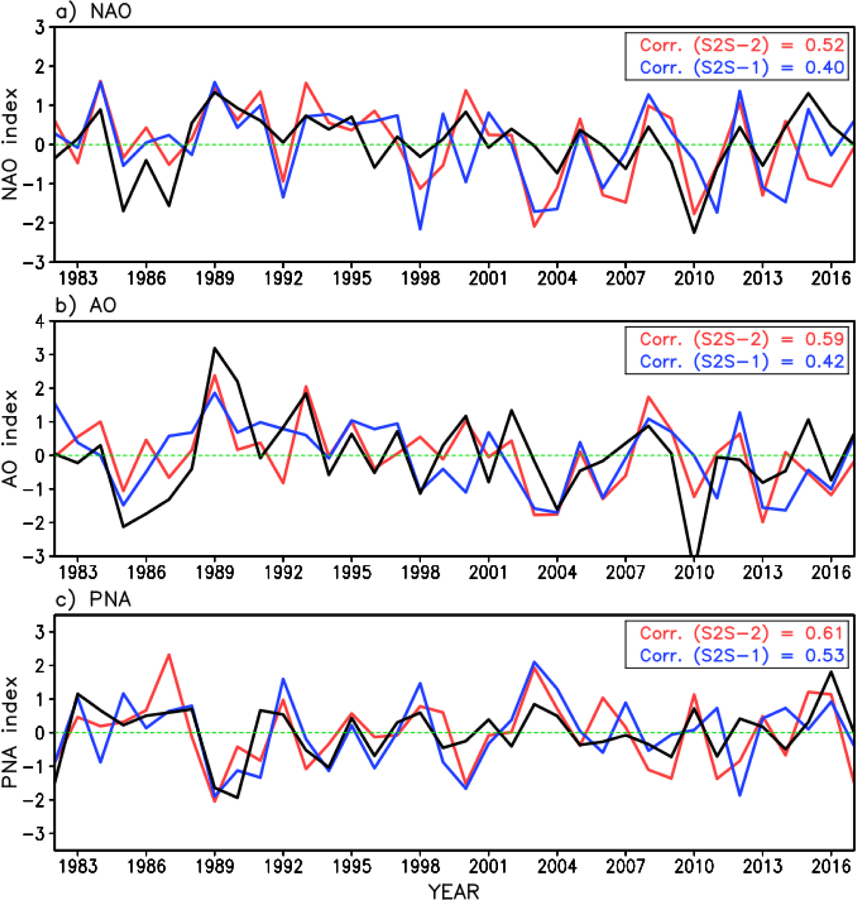
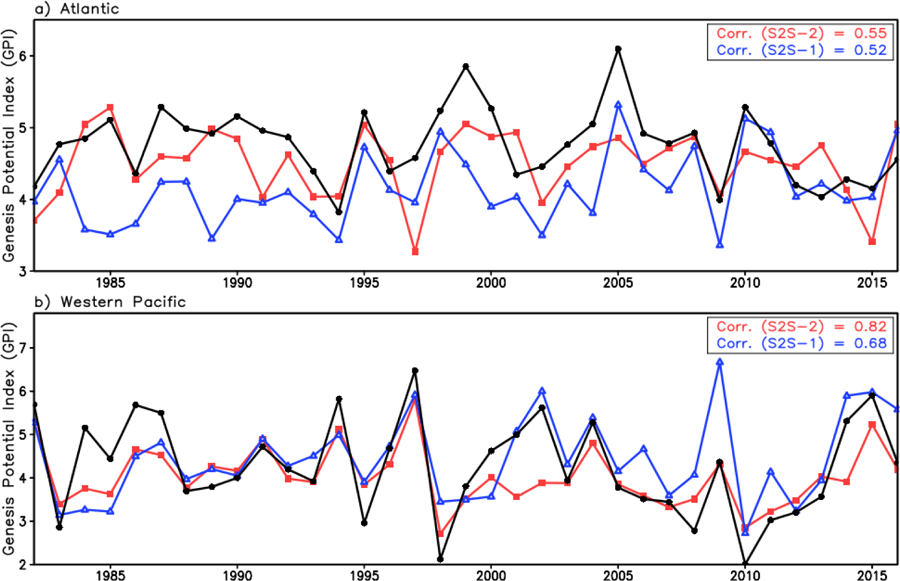
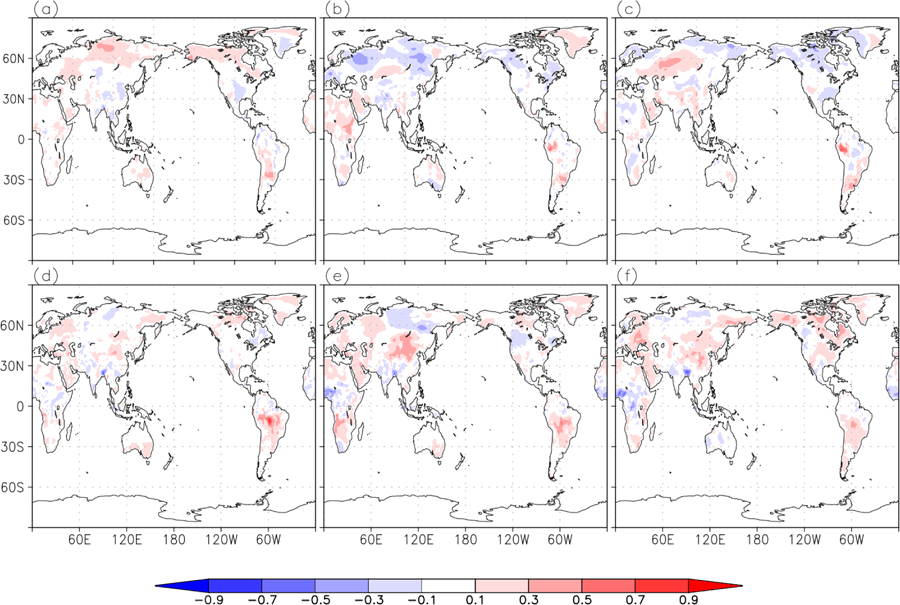
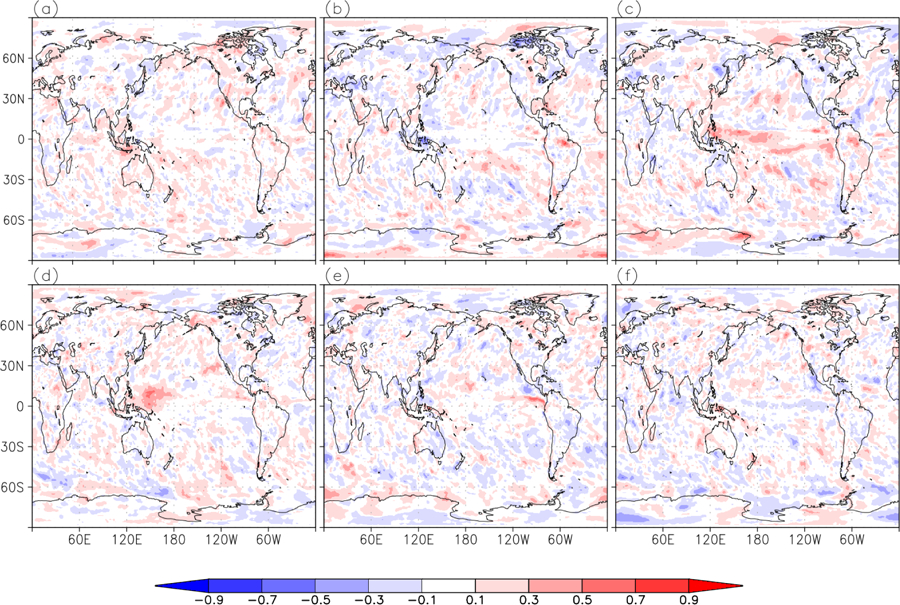
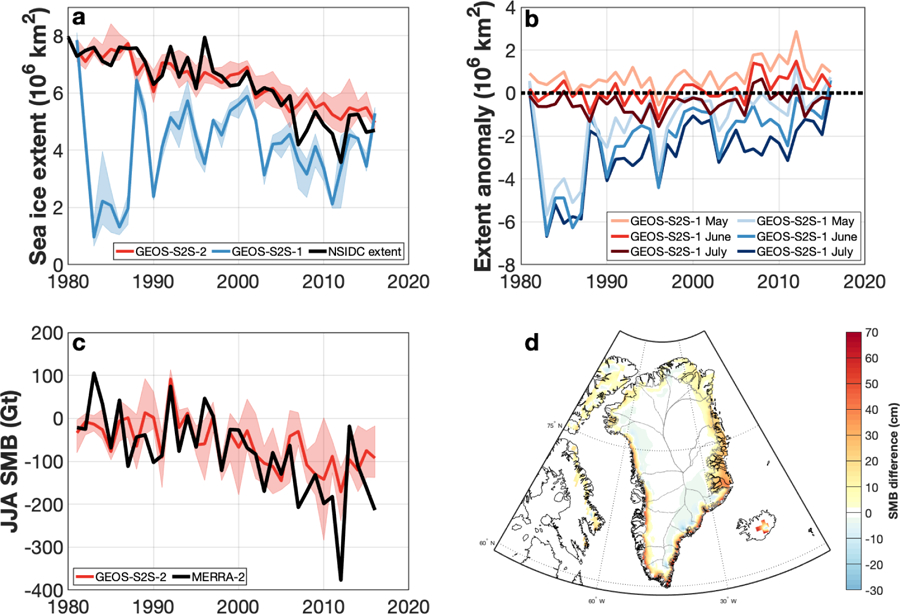
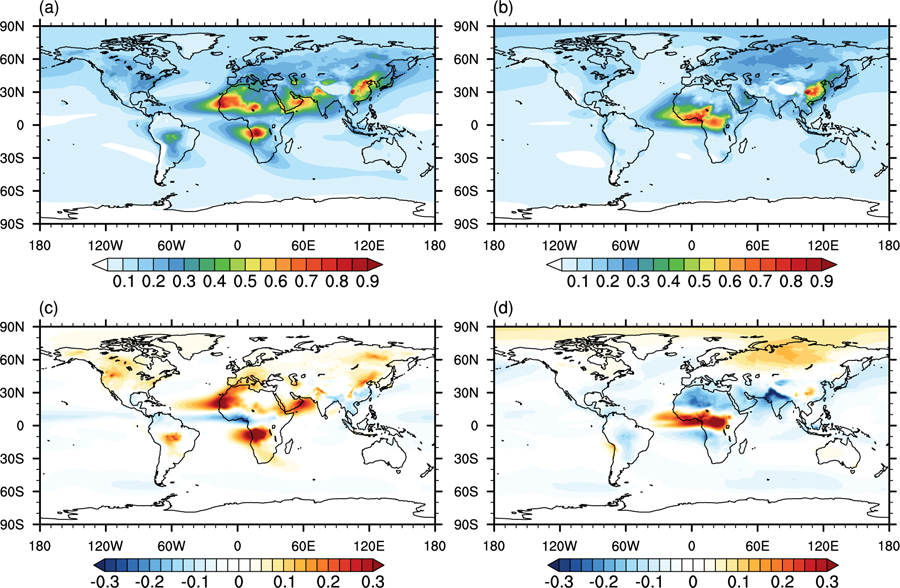
The Global Modeling and Assimilation Office (GMAO) has recently released a new version of the Goddard Earth Observing System (GEOS) Sub-seasonal to Seasonal prediction (S2S) system, GEOS-S2S-2, that represents a substantial improvement in performance and infrastructure over the previous system. The system is described here in detail, and results are presented from forecasts, climate equillibrium simulations and data assimilation experiments. The climate or equillibrium state of the atmosphere and ocean showed a substantial reduction in bias relative to GEOS-S2S-1. The GEOS-S2S-2 coupled reanalysis also showed substantial improvements, attributed to the assimilation of along-track Absolute Dynamic Topography. The forecast skill on subseasonal scales showed a much-improved prediction of the Madden-Julian Oscillation in GEOS-S2S-2, and on a seasonal scale the tropical Pacific forecasts show substantial improvement in the east and comparable skill to GEOS-S2S-1 in the central Pacific. GEOS-S2S-2 anomaly correlations of both land surface temperature and precipitation were comparable to GEOS-S2S-1, and showed substantially reduced root mean square error of surface temperature. The remaining issues described here are being addressed in the development of GEOS-S2S Version 3, and with that system GMAO will continue its tradition of maintaining a state of the art seasonal prediction system for use in evaluating the impact on seasonal and decadal forecasts of assimilating newly available satellite observations, as well as to evaluate additional sources of predictability in the earth system through the expanded coupling of the earth system model and assimilation components.


Figures

Figure 1.
Figure 1.
Schematic of Coupled Data Assimilation Methodology. The GEOS-S2S-2 AODAS includes an ocean predictor segment (the green line across the top of the figure), and a corrector segment (blue arrow across the bottom). During both segments the atmosphere is “replayed” to a pre-exisiting atmospheric analysis state every 6 hours (downward yellow arrows). After the 5-day predictor segment, the ocean analysis increments are computed and the coupled AODAS returns to the beginning of the 5-day segment to perform the corrector segment.
Figure 2.
Figure 2.
The December-January-February mean eddy height difference from MERRA-2 at 300 mb in m for a) GEOS-S2S-1 and b) GEOS-S2S-2. Global mean difference of spatial standard deviation from MERRA-2 is 33.07 m for GEOS-S2S-1 and 20.85 m for GEOS-S2S-2. The June-July-August mean zonal wind difference from MERRA-2 at 200 mb in ms−1 for c) GEOS-S2S-1, and d) GEOS-S2S-2. Global mean difference from MERRA-2 is 1.0 ms−1 for GEOS-S2S-1 and 2.7 ms−1 for GEOS-S2S-2.
Figure 3.
Figure 3.
Mean total precipitation difference (mm d−1 ) from GPCP, for the GEOS-S2S-1 (a, c) and the GEOS-S2S-2 (b, d). Top panels correspond to the June-July-August season and bottom panels to the December-January-February season. Global mean difference from GPCP in DJF is 0.21 mm d−1 for GEOS-S2S-1 and 0.49 mm d−1 for GEOS-S2S-2, and global mean difference from GPCP in JJA is 0.35 mm d−1 for GEOS-S2S-1 and 0.56 mm d−1 for GEOS-S2S-2.
Figure 4.
Figure 4.
a) June-July-August (JJA) net surface radiation difference (W m−2) from SRB data for GEOS-S2S-1, b) same as a) but for GEOS-S2S-2. Global mean difference from SRB is 0.22 W m−2 for GEOS-S2S-1 and 4.1 W m−2 for GEOS-S2S-2. c) JJA mean 2 m temperature difference from MERRA-2 in °K for GEOS-S2S-1, d) same as c) but for GEOS-S2S-2. Global mean difference from MERRA-2 is −0.85 °K for GEOS-S2S-1 and 0.14 °K for GEOS-S2S-2.
Figure 5.
Figure 5.
a) GEOS-S2S-1 sea surface temperature difference from Reynolds analysis in °C., b) same as a) but for GEOS-S2S-2. Global mean difference from Reynolds is −0.16 °C for GEOS-S2S-1 and 0.5 °C for GEOS-S2S-2.
Figure 6.
Figure 6.
Mean annual cycle of sea ice extent in the Arctic (solid) and Antarctic (dashed). GEOS-S2S-1 (blue) and GEOS-S2S-2 (red) are compared to observational estimates based on passive microwave retrievals (black; NSIDC Sea Ice Index, Fetterer et al. [2017]).
Figure 7.
Figure 7.
Major global heat transport indices, top) the Atlantic Meridional Overturning circulation (AMOC) is measured by in situ observations of the RAPID array (black) across 26:5° N in the Atlantic. GEOS-S2S-1 (blue) and GEOS-S2S-2 (red) are compared from July 2012 until December 2016. The bottom panel shows indices of the Indonesian Throughflow (see inset for location). Geostrophic transport calculated using an optimal interpolation (Carton [1989]) of all available in situ temperature and salinity observations (solid red) compares well with in measurements from INSTANT moorings Sprintall et al. [2009] (dashed black). GEOS-S2S-1 (blue line) clearly underestimates the ITF transport whereas GEOS-S2S-2 (red line) corresponds well with observations.
Figure 8.
Figure 8.
Longitude versus time distribution of the equatorial (top) Kelvin and (bottom) the first meridional mode of equatorial Rossby waves through their signature in zonal surface current deduced from the observed AVISO multi-satellite altimetry AVISO [2013a] (left), GEOS-S2S-1 (middle) and GEOS-S2S-2 (right). Kelvin waves travel west-to-east and take about 3 months to transit the Pacific and Rossby waves travel from east-to-west and take about 8 months.
Figure 9.
Figure 9.
a) GEOS-S2S-1 seasonal mean SST drift at 1 month lead time, b) same as a) but at 3 month lead time, c) same as a) but for 6 month lead time, d), e) f) same as a), b), c), respectively for GEOS-S2S-2.
Figure 10.
Figure 10.
a) Bivariate anomaly correlation of the RMM index as a function of forecast lead day and month of initialization from GEOS-S2S-1, b) same as (a) but for GEOS-S2S-2
Figure 11.
Figure 11.
a) Composite temperature in °K for SSW events from MERRA-2 (grey) and from GEOS-S2S-2 forecasts at different lead times: 5-day (red), 10-day (green), 15-day (blue), 20-day (yellow), 25-day (cyan) and 30-day (purple), b) same as a) but for zonal wind in ms−1, c) same as a) but for meridional heat flux in °Kms−1
Figure 12.
Figure 12.
Anomaly correlation for Niño 3.4 SST index. Reynolds SST is used for comparison. Initial forecast month is on the y-axis, lead time on the x-axis. The left panel is GEOS-S2S-1, middle panel GEOS-S2S-1, and the right panel is GEOS-S2S-2 minus GEOS-S2S-1. Positive values indicate an improvement of GEOS-S2S-2 relative to GEOS-S2S-1.
Figure 13.
Figure 13.
Same as Figure 12, but for the Niño1+2 index.
Figure 14.
Figure 14.
The ratio R (see text), for the Niño 3.4 index (top row) and Niño1+2 index (bottom row) as a function start month and forecast lead time for GEOS-S2S-1 (left) and GEOS-S2S-2 (right). Results are based on four ensemble members for forecasts/hindcasts spanning the period 1982–2016.
Figure 15.
Figure 15.
January/February mean NAO (a), AO (b), and PNA (c) teleconnection indices predicted by GEOS S2S-2 (red) and GEOS S2S-1 (blue) initialized on 27 December. The black line represents the MERRA-2 teleconnection indices. Correlations between MERRA-2 and GEOS-S2S-2 (red), and between MERRA-2 and GEOS-S2S-1 (blue), respectively, are shown on the upper-right corner of the each panel.
Figure 16.
Figure 16.
Predicted June/July/August/September (JJAS) genesis potential index (GPI) from forecasts initialized on 31 May. a) North Atlantic region, b) Western Pacific region. Blue, red, and black solid lines denote the results from the GEOS S2S-1, GEOS S2S-2, and MERRA-2, respectively. Correlations between MERRA-2 and GEOS-S2S-2 (red), and between MERRA-2 and GEOS-S2S-1 (blue) are given on the upper-right corner of the each panel.
Figure 17.
Figure 17.
a) JJA Seasonal mean GEOS S2S-2 minus GEOS S2S-1 AC of near-surface temperature at 1-month lead, b) same as a) but for 4-month lead, c) same as a) but for 7-month lead, d) DJF Seasonal mean GEOS S2S-2 minus GEOS S2S-1 AC of near-surface temperature at 1-month lead, e) same as d) but for 4-month lead, f) same as d) but for 7-month lead. Red areas in the difference figure indicate improvement in forecast skill in GEOS-S2S-2 compared to GEOS-S2S-1, and only statistically significant values are shaded.
Figure 18.
Figure 18.
Same as Figure 17 but for precipitation.
Figure 19.
Figure 19.
a) June retrospective forecasts of September Northern Hemisphere sea ice extent for GEOS-S2S-2 (ensemble mean, red line; ensemble spread, red shading), GEOS-S2S-1 (ensemble mean, blue line; ensemble spread, blue shading) and sea ice concentrations derived from satellite brightness temperature (black, Cavalieri et al. [1996]). b) May, June, and July retrospective forecast anomalies of GEOS-S2S-2 and GEOS-S2S-1 (as differenced from Cavalieri et al. [1996]) for September Northern Hemisphere sea ice extent. c) Greenland Ice Sheet summer (JJA) surface mass balance from GEOS-S2S-2 June forecasts (ensemble mean, red line; ensemble spread red shading) and MERRA-2 (thick black). d) Mean (1981–2016) Greenland Ice Sheet surface mass balance difference (GEOS-S2S-2 minus MERRA-2). Positive values (red) indicate that GEOS-S2S-2 loses less mass to ice sheet runoff than MERRA-2, and negative values (blue) indicate that GEOS-S2S-2 loses more.
Figure 20.
Figure 20.
a) Spatial distribution of aerosol optical depth (AOD) at 550 nm in July-August-September and b) December-January-February, averaged for the period 2000–2015 from the GEOS-S2S-2 ensemble mean. c) like a) but GEOS-S2S-2 minus MERRA-2 AOD, d) like b) but GEOS-S2S-2 minus MERRA-2 AOD. Global mean difference from MERRA-2 in JAS is 0.11 and in DJF is −0.05.

References

    1. Alexander MA, Bhatt US, Walsh JE, Timlin MS, Miller JS, and Scott JD (2004). The Atmospheric Response to Realistic Arctic Sea Ice Anomalies in an AGCM during Winter. Journal of Climate, 17,6, 890–905. 10.1175/1520-0442(2004)017<0890:TARTRA>2.0.CO;2. - DOI
    1. Andrews DG, Holton JR, and Leovy CB (1987). Middle Atmosphere Dynamics. Academic Press, 489.
    1. AVISO MSLA (2013). http://www.aviso.oceanobs.com/en/data/products/sea-surface-height-produc....
    1. AVISO Altimetry (2013). https://www.aviso.altimetry.fr/en/data/products/auxiliary-products/mss.html.
    1. AVISO MDT (2013). https://www.aviso.altimetry.fr/en/data/products/auxiliary-products/mdt/m...

LinkOut - more resources