. 2021 Apr 20:8:652250.
doi: 10.3389/fmolb.2021.652250. eCollection 2021.

Identification of mRNA-, circRNA- and lncRNA- Associated ceRNA Networks and Potential Biomarkers for Preeclampsia From Umbilical Vein Endothelial Cells

Affiliations

Identification of mRNA-, circRNA- and lncRNA- Associated ceRNA Networks and Potential Biomarkers for Preeclampsia From Umbilical Vein Endothelial Cells

Dan Chen et al. Front Mol Biosci. .

Abstract

Objective: The etiology and pathogenesis of preeclampsia (PE) remain unclear, and ideal biomarkers for the early detection of PE are scarce. The involvement of the competing endogenous RNA (ceRNA) hypothesis in PE is only partially understood. The present study aimed to delineate a regulatory network in PE comprised of messenger RNAs (mRNAs), circular RNAs (circRNAs), long non-coding RNAs (lncRNAs), and microRNAs (miRNAs) via ceRNA profiles from human umbilical vein endothelial cells (HUVECs) to further reveal the pathogenesis of PE and potential biomarkers.

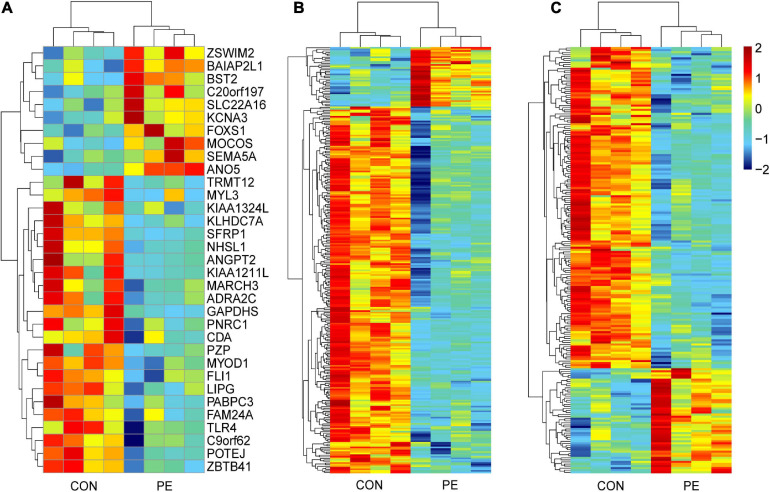
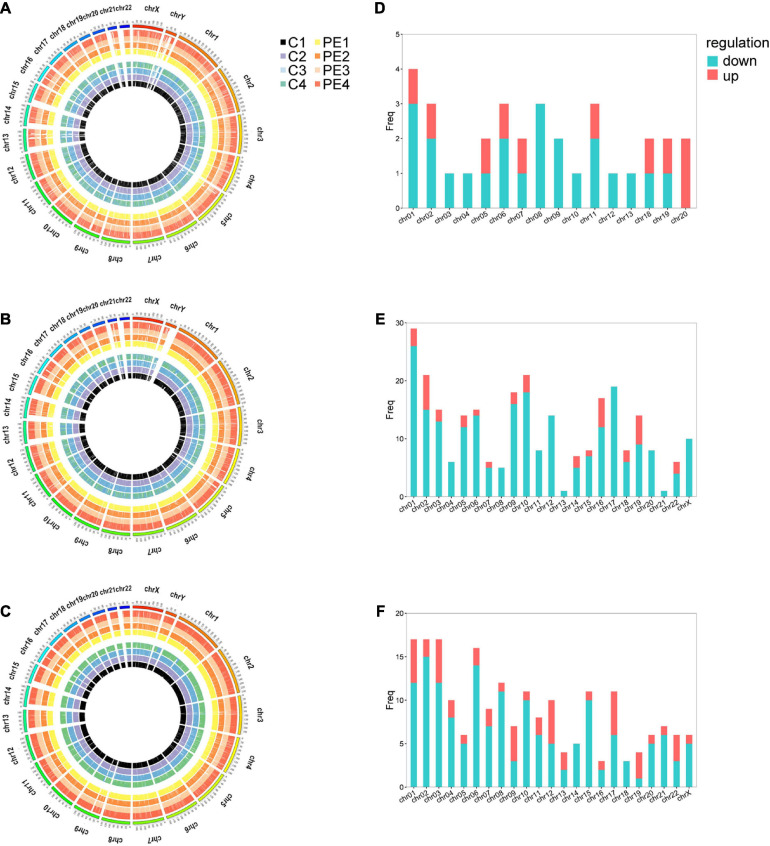
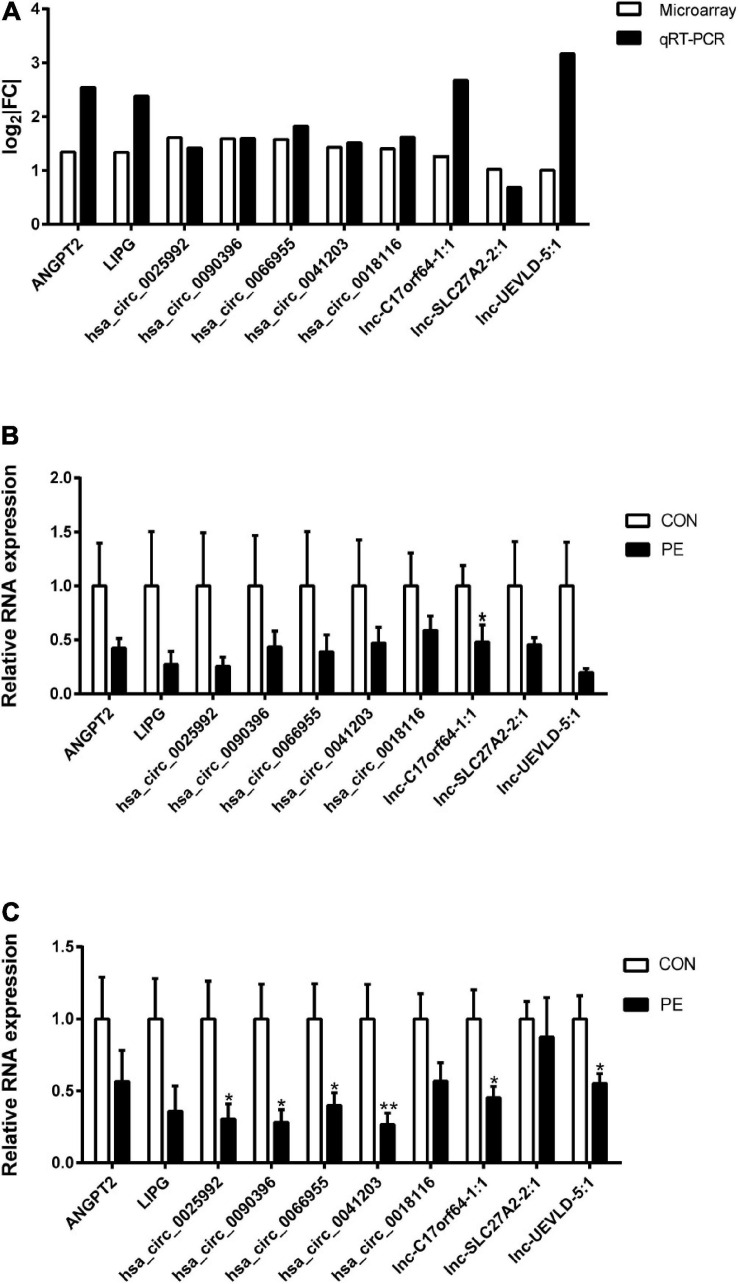
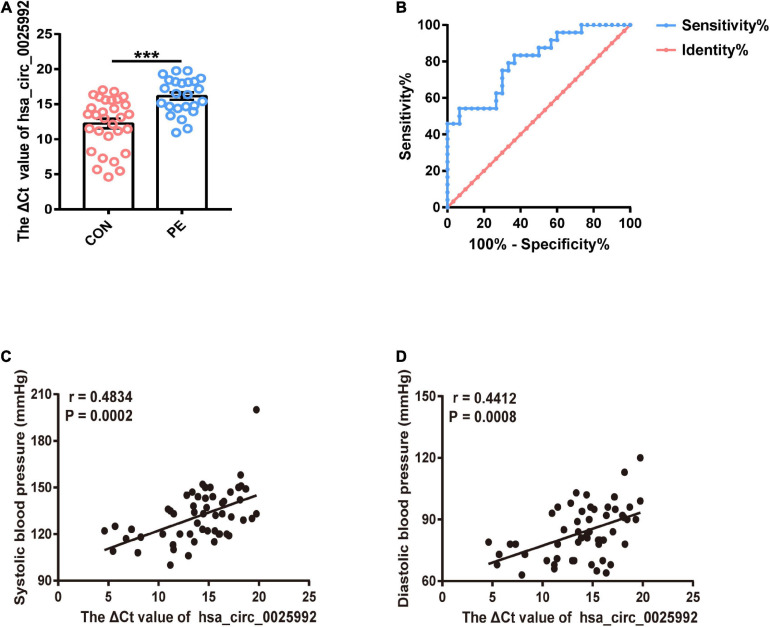
Methods: Differentially expressed mRNAs, circRNAs, and lncRNAs were detected in HUVECs from early onset preeclampsia (EOPE) cases (n = 4) and normal pregnancies (n = 4) by microarray analysis. Bioinformatics analysis was performed to systematically analyze the data, and a relevant ceRNA network was constructed. RNAs (ANGPT2, LIPG, hsa_circ_0025992, hsa_circ_0090396, hsa_circ_0066955, hsa_circ_0041203, hsa_circ_0018116, lnc-C17orf64-1:1, lnc-SLC27A2-2:1, and lnc-UEVLD-5:1) were validated by quantitative real-time PCR (qRT-PCR) in 10 pairs of HUVECs and placental tissues from PE patients and normal pregnancies. Furthermore, expression of hsa_circ_0025992 was detected in maternal peripheral blood samples from PE patients (n = 24) and normal pregnancies (n = 30) to confirm its potential as a novel biomarker. The receiver operating characteristic (ROC) curve was applied to analyze its diagnostic value.

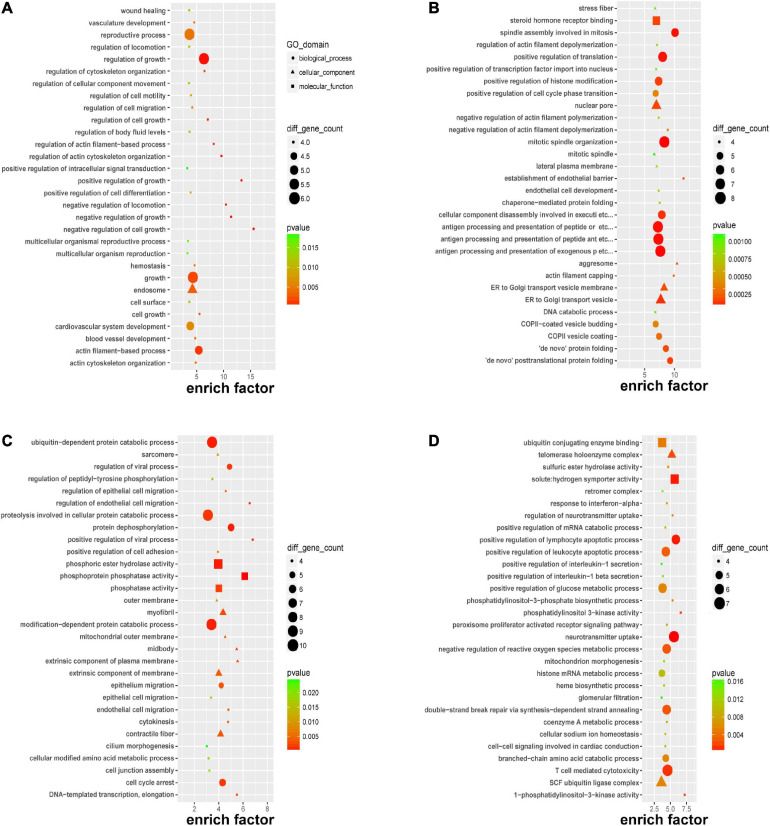
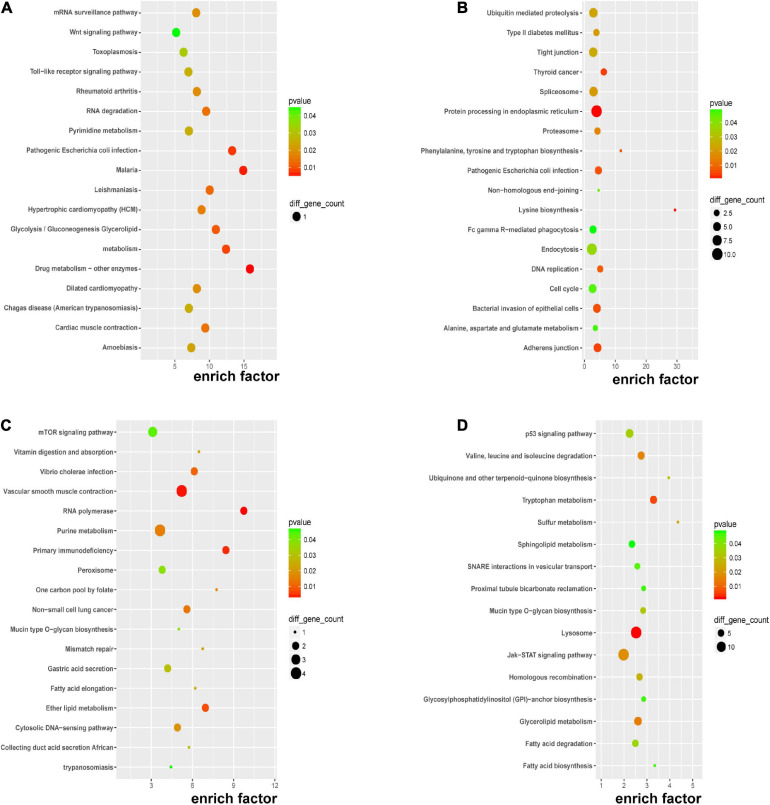
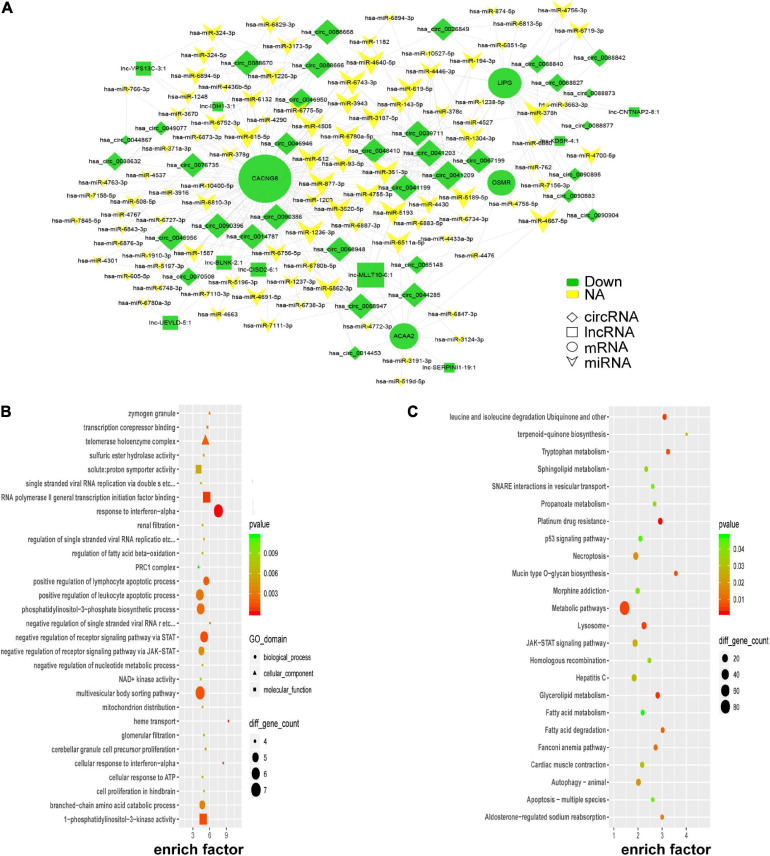
Results: Compared with HUVECs from normal pregnancies, HUVECs from EOPE cases had 33 differentially expressed mRNAs (DEmRNAs), 272 DEcircRNAs, and 207 DElncRNAs. GO and KEGG analyses of the DERNAs revealed the biological processes and pathways involved in PE. Based on the microarray data and the predicted miRNAs, a ceRNA network was constructed with four mRNAs, 34 circRNAs, nine lncRNAs, and 99 miRNAs. GO and KEGG analyses of the network reinforced the crucial roles of metabolic disorders, the p53 and JAK/STAT signaling pathways in PE. In addition, ROC analysis indicated that hsa_circ_0025992 could be used as a novel biomarker for PE.

Conclusion: A novel ceRNA network was revealed in PE, and the potential of hsa_circ_0025992 to serve as a new biomarker was confirmed.

Keywords: HUVECs; biomarker; ceRNA network; circRNAs; preeclampsia.


Conflict of interest statement

The authors declare that the research was conducted in the absence of any commercial or financial relationships that could be construed as a potential conflict of interest.

Figures

FIGURE 1
FIGURE 1
Hierarchical clustering analysis of DERNAs in HUVECs between normal pregnancies and PE patients. The heatmap reveals 33 DEmRNAs (A), 272 DEcircRNAs (B), and 207 DElncRNAs (C). Each column and row correspond to a sample and a transcript, respectively. Red represents upregulation, while blue represents downregulation. CON, control; PE, preeclampsia, n = 4.
FIGURE 2
FIGURE 2
The distribution of DERNAs on chromosomes. Circos plot of genome-wide mRNAs (A), circRNAs (B), and lncRNAs (C). Histograms depict the distribution of DEmRNAs (D), DEcircRNAs (E), and DElncRNAs (F) mapped on each chromosome. The outermost circle represents the human chromosomes, while the inside eight circles represent eight samples from control and PE patients. The Y-axis denotes the count of transcripts mapped to the chromosome. CON, control; PE, preeclampsia, n = 4.
FIGURE 3
FIGURE 3
Gene Ontology (GO) enrichment of DERNAs. GO enrichment of DEmRNAs (A), host genes of DEcircRNAs (B), cis-regulated genes of DElncRNAs (C), and trans-regulated genes of DElncRNAs (D).
FIGURE 4
FIGURE 4
KEGG pathway analysis of DERNAs. KEGG pathway analyses of DEmRNAs (A), host genes of DEcircRNAs (B), cis-regulated genes of DElncRNAs (C), and trans-regulated genes of DElncRNAs (D).
FIGURE 5
FIGURE 5
Validation of DERNA expression by qRT-PCR. Differentially expressed mRNAs, circRNAs, and lncRNAs in PE samples by microarray analysis were validated by qRT-PCR (A), n = 4. Validation of differentially expressed mRNAs, circRNAs, and lncRNAs in 10 pairs of HUVECs (B) and corresponding placental tissues (C) of participants. | FC| = | Fold Change|. CON, control; PE, preeclampsia. Data were shown in mean ± SEM. *P < 0.05; **P < 0.01.
FIGURE 6
FIGURE 6
Global ceRNA network integration in PE. A portion of the theoretical ceRNA network in PE was predicted according to the microarray analysis (A). GO analysis of the molecules involved in the ceRNA network (B). KEGG pathway analysis of the molecules involved in the ceRNA network (C).
FIGURE 7
FIGURE 7
Hsa_circ_0025992 serving as a potential novel blood biomarker for the prediction of early PE. Expression of hsa_circ_0025992 in blood samples from PE patients (n = 24) and normal pregnant women (n = 30) (A). Data were shown as the mean ± SEM. The ROC curve of hsa_circ_0025992 as a predictive biomarker for early PE. AUC = 0.8065 (95% CI 0.6902–0.9210, P = 0.0001); sensitivity and specificity, 54.17 and 93.33%, respectively. The cutoff value was 16.36 (ΔCt value) [the optimal cutoff point was determined at the maximum Youden Index (YI)]. The NPV of a ΔCt value ≤ 16.36 for a diagnosis of preeclampsia was 71.8%. A ΔCt value above 16.36 had a PPV of 86.7% (B). Spearman correlation analysis for hsa_circ_0025992 (ΔCt value) in blood samples with the systolic blood pressure and diastolic blood pressure of the corresponding participants (C,D). *P < 0.05, **P < 0.01, ***P < 0.001.

Similar articles

Cited by

References

    1. ACOG (2020). Gestational Hypertension and Preeclampsia: ACOG Practice Bulletin, Number 222. Obstet. Gynecol. 135 e237–e260. - PubMed
    1. Ahmadian E., Rahbar Saadat Y., Hosseiniyan Khatibi S. M., Nariman-Saleh-Fam Z., Bastami M., Zununi Vahed F., et al. (2020). Pre-Eclampsia: microbiota possibly playing a role. Pharmacol. Res. 155:104692. 10.1016/j.phrs.2020.104692 - DOI - PubMed
    1. Aneman I., Pienaar D., Suvakov S., Simic T. P., Garovic V. D., McClements L. (2020). Mechanisms of Key Innate Immune Cells in Early- and Late-Onset Preeclampsia. Front. Immunol. 11:1864. 10.3389/fimmu.2020.01864 - DOI - PMC - PubMed
    1. Aplin J. D., Myers J. E., Timms K., Westwood M. (2020). Tracking placental development in health and disease. Nat. Rev. Endocrinol. 16 479–494. 10.1038/s41574-020-0372-6 - DOI - PubMed
    1. Benschop L., Duvekot J. J. (2019). Roeters van Lennep JE. Future risk of cardiovascular disease risk factors and events in women after a hypertensive disorder of pregnancy. Heart 105 1273–1278. 10.1136/heartjnl-2018-313453 - DOI - PMC - PubMed