. 2021 Jun;33(24):e2100340.
doi: 10.1002/adma.202100340. Epub 2021 May 7.

A Floating Mold Technique for the Programmed Assembly of Protocells into Protocellular Materials Capable of Non-Equilibrium Biochemical Sensing

Affiliations

A Floating Mold Technique for the Programmed Assembly of Protocells into Protocellular Materials Capable of Non-Equilibrium Biochemical Sensing

Agostino Galanti et al. Adv Mater. 2021 Jun.

Abstract

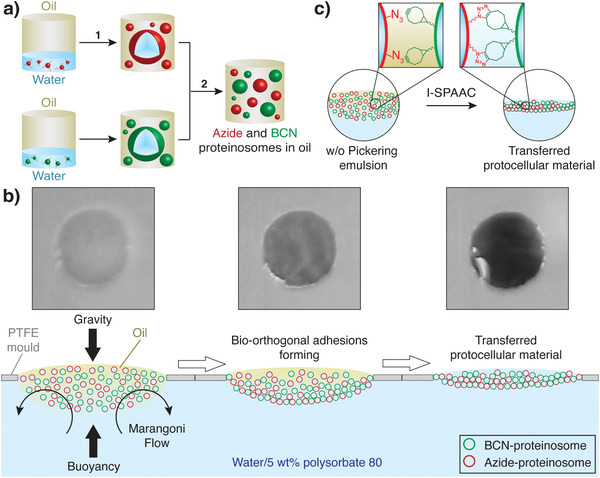
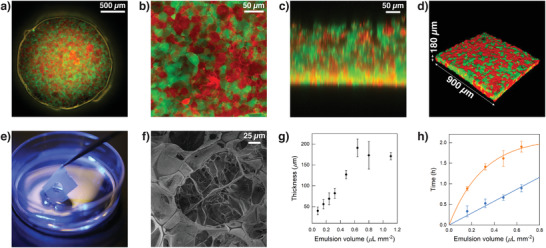
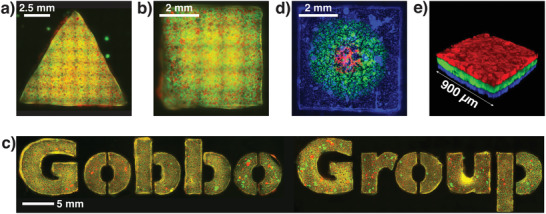
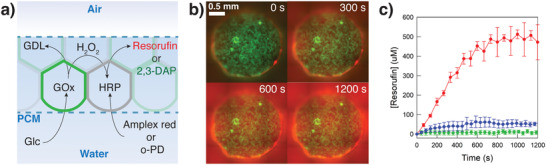
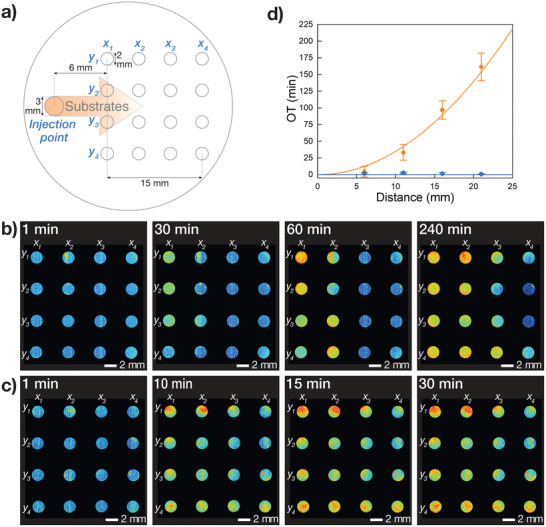
Despite important breakthroughs in bottom-up synthetic biology, a major challenge still remains the construction of free-standing, macroscopic, and robust materials from protocell building blocks that are stable in water and capable of emergent behaviors. Herein, a new floating mold technique for the fabrication of millimeter- to centimeter-sized protocellular materials (PCMs) of any shape that overcomes most of the current challenges in prototissue engineering is reported. Significantly, this technique also allows for the generation of 2D periodic arrays of PCMs that display an emergent non-equilibrium spatiotemporal sensing behavior. These arrays are capable of collectively translating the information provided by the external environment and are encoded in the form of propagating reaction-diffusion fronts into a readable dynamic signal output. Overall, the methodology opens up a route to the fabrication of macroscopic and robust tissue-like materials with emergent behaviors, providing a new paradigm of bottom-up synthetic biology and biomimetic materials science.

Keywords: bioinspiration; enzyme cascade; out-of-equilibrium; protocells; protocellular materials; prototissue.


Conflict of interest statement

The authors declare no conflict of interest.

Figures

Scheme 1
Scheme 1
Generation of protocellular materials (PCMs). a) Scheme showing the preparation of a binary population of azide‐ (red shapes) and BCN‐functionalized (green shapes) proteinosomes in oil starting from the corresponding bio‐orthogonally reactive BSA/PNIPAM‐co‐MAA nanoconjugates. Step (1) involves the generation of 2 separate populations of bio‐orthogonally reactive proteinosomes in separate vials as w/o microdroplets using the Pickering emulsion technique. Step (2) involves mixing of the two populations in 1:1 ratio. b) Scheme illustrating the PCM programmed assembly process. Initially, a 1:1 binary population of azide‐ (red shapes) and BCN‐proteinosomes (green shapes) in oil prepared as described in (a) is cast inside a PTFE mold floating on a solution of polysorbate 80 in water (5 wt%). In this system the Pickering emulsion is subject to: 1) buoyancy, which keeps the emulsion inside the PTFE mold; 2) gravity, which acts to sediment the proteinosomes to the bottom of the oil droplet; and 3) Marangoni flow from the center of the PTFE mold to the sides and into the bulk solution as highlighted by the curved black arrows. With time the effect of polysorbate 80 and Marangoni flow extracts the oil from the emulsion and brings the proteinosomes in contact allowing them to react via an interfacial strain‐promoted alkyne–azide cycloaddition (I‐SPAAC) reaction and assemble the PCM. The photographs on top show the oil removal and PCM programmed assembly process on a 2 mm wide circular PTFE mold on a black background highlighting the associated opacity change from white to transparent; the appearance of black color is due to the background color. c) Scheme highlighting the I‐SPAAC reaction occurring upon oil removal.
Figure 1
Figure 1
PCM characterization. a) Tiled epifluorescence microscopy image of a circular PCM 2 mm in diameter attached to a PTFE mold and immersed in an aqueous solution of polysorbate 80 (5 wt%). The PCM comprises an interlinked 1:1 binary population of FITC‐labeled (green fluorescence) BCN‐functionalized and RITC‐labeled (red fluorescence) azide‐functionalized proteinosomes internally cross‐linked with PEG‐diNHS. The PCM was prepared by adding an emulsion volume of 0.64 µL mm−2. b) XY confocal fluorescence microscopy image showing a zoomed in area of the PCM in (a). c) XZ confocal fluorescence microscopy scan showing a zoomed in vertical section of the PCM in (a). d) 3D confocal image of the PCM in (a). The image shows that the PCM has a homogeneous thickness of ≈180 µm. Images in (b), (c), and (d) highlight the formation of a spatially interlinked network of closely packed bio‐orthogonally ligated proteinosomes. e) Photograph demonstrating the robustness and ease of lifting the PTFE mold with attached PCM from the aqueous solution of polysorbate 80 (5 wt%). In this image a water meniscus crossing the circular mold can be noted, highlighting the presence of the PCM inside. f) Scanning electron microscopy (SEM) image of a freeze‐dried free‐standing PCM showing the details of the spatially interlinked network of closely packed bio‐orthogonally ligated proteinosomes. g) Graph showing changes in the PCM thickness as a function of the emulsion volume used to assemble them. Data obtained from the analysis of Figure S3, Supporting Information. Error bars: standard deviation. h) Graph showing onset of transfer time (blue plot) and final transfer time (orange plot) as a function of the emulsion volume used to assemble the PCMs, ranging between 0.16 and 0.64 µL mm−2. Data obtained from the analysis of Figure S4, Supporting Information. Error bars: standard deviation.
Figure 2
Figure 2
Generation of PCMs with complex 3D architectures. a) Tiled epifluorescence microscopy image of a PCM in the shape of an equilateral triangle with 1.0 cm sides. The PCMs comprised an interlinked 1:1 binary population of RITC‐labeled (red fluorescence) azide‐ and FITC‐labeled (green fluorescence) BCN‐functionalized proteinosomes internally cross‐linked with PEG‐diNHS. b) Tiled epifluorescence microscopy image of a PCM in the shape of a square with 5 mm sides with the same composition as the PCM in (a). c) Tiled epifluorescence microscopy images showing PCMs with the same composition as the PCM in (a) and composing the “Gobbo Group” logo. d) Tiled epifluorescence microscopy image of a patterned squared PCM with sides of 5 mm comprising interlinked 1:1 binary populations of non‐tagged azide‐ and differently tagged BCN‐functionalized proteinosomes internally cross‐linked with PEG‐diNHS. Blue fluorescence: Dylight405; green fluorescence: FITC; and red fluorescence: RITC. The patterns were manually generated using a mechanical pipette. e) 3D confocal fluorescence image of a 3‐tiered stratified PCM ≈270 µm thick. All layers are composed of an interlinked 1:1 binary population of BCN‐ and azide‐functionalized proteinosomes internally cross‐linked with PEG‐diNHS. Blue fluorescence: Dylight405; green fluorescence: FITC; and red fluorescence: RITC. The 3 PCM layers were perfectly attached to each other and no delamination was observed; see also Figure S11, Supporting Information.
Figure 3
Figure 3
Communication properties of PCMs. a) Scheme representing the GOx/HRP enzyme cascade reaction in a PCM (enclosed by the 2 blue dashed lines) consisting of GOx‐containing BCN‐functionalized proteinosomes (green shapes) and HRP‐containing azide‐functionalized proteinosomes (grey shapes). The substrates glucose (Glc) and Amplex red or o‐phenylenediamine (o‐PD) freely diffuses through the PCM. The GOx‐containing protocells oxidize Glc to d‐glucono‐1,5‐lactone (GDL) and H2O2. This initiates radial diffusion of H2O2 from the GOx‐containing protocells, which is then used by HRP‐containing protocells to oxidize the non‐fluorescent molecules, Amplex red or o‐PD to red fluorescent resorufin or green fluorescent 2,3‐diaminophenazine (2,3‐DAP), respectively. H2O2 can therefore be considered as a signaling molecule between the two interlinked protocell communities. b) Time‐dependent epifluorescence microscopy images of a circular PCM 2 mm in diameter prepared as described in (a) and in the presence of glucose and Amplex Red (20 and 0.5 × 10⁻³ m in PBS 10 × 10−3 m, pH 6.8, respectively) at 25 °C. Green fluorescence, GOx‐containing FITC‐labeled BCN‐functionalized proteinosomes; red fluorescence, resorufin production. c) Graph showing the time‐dependent generation of resorufin from a circular PCM 2 mm in diameter and structured as described in (a) (red curve), in the absence of GOx (control experiment, blue curve), and in the absence of HRP (control experiment, green curve). Experiment repeated in triplicate; error bars: standard deviation.
Figure 4
Figure 4
Non‐equilibrium biochemical sensing in 4 × 4 arrays of enzymatically active PCMs. a) Scheme showing the circular PTFE mold used for the non‐equilibrium biochemical sensing experiments. The scheme highlights the injection point, the x 1–4 y 1–4 wells used for the assembly of the 4 × 4 array of enzymatically active PCMs, and the direction of the unidirectional diffusion front of chemical substrates (orange arrow). b) Sequence of false color epifluorescence microscopy images showing spatiotemporal response of a 4 × 4 PCM array of enzymatically active PCMs, which was exposed to a co‐diffusing mixture of Glc and o‐PD substrates. The images show a consecutive fluorescence turn‐on of columns x 1–4 associated with the in situ production of 2,3‐DAP. See Section S1.9, Supporting Information, for experimental details. c) Sequence of false color time‐dependent epifluorescence microscopy images showing the control experiment performed on a 4 × 4 PCM array of enzymatically active PCMs under diffusional equilibrium conditions. The images show a simultaneous fluorescence turn‐on of all PCMs in the array. See Section S1.9, Supporting Information, for experimental details. d) Plot showing the trend of average onset times (OTs) of 2,3‐DAP fluorescence for each x 1–4 column of the 4 × 4 PCM array as a function of the distance from the injection point obtained for the experiments in (b) (orange plot) and (c) (blue plot). The orange plot highlights a quadratic relationship between the average OTs and the distance from the injection point, which is typical for diffusing chemical species. In contrast, the blue plot shows that the average OTs is independent of the spatial position of the PCMs.

Similar articles

Cited by

References

    1. a) Liu J. S., Gartner Z. J., Trends Cell Biol. 2012, 22, 683; - PMC - PubMed
    2. b) Editorial, Nature 2018, 563, 155;
    3. c) Powell K., Nature 2018, 563, 172; - PubMed
    4. d) Bayley H., Cazimoglu I., Hoskin C. E. G., Life Sci. 2019, 3, 615; - PMC - PubMed
    5. e) Gonzales D. T., Zechner C., Tang T. Y. D., Curr. Opin. Syst. Biol. 2020, 24, 56;
    6. f) Gobbo P., Biochem. Soc. Trans. 2020, 48, 2579. - PubMed
    1. a) Kurihara K., Tamura M., Shohda K., Toyota T., Suzuki K., Sugawara T., Nat. Chem. 2011, 3, 775; - PubMed
    2. b) Dzieciol A. J., Mann S., Chem. Soc. Rev. 2012, 41, 79; - PubMed
    3. c) Li M., Harbron R. L., Weaver J. V., Binks B. P., Mann S., Nat. Chem. 2013, 5, 529; - PubMed
    4. d) Marguet M., Bonduelle C., Lecommandoux S., Chem. Soc. Rev. 2013, 42, 512; - PubMed
    5. e) Dora Tang T. Y., Rohaida Che Hak C., Thompson A. J., Kuimova M. K., Williams D. S., Perriman A. W., Mann S., Nat. Chem. 2014, 6, 527; - PubMed
    6. f) Xu C., Hu S., Chen X., Mater. Today 2016, 19, 516; - PMC - PubMed
    7. g) Rodriguez‐Arco L., Li M., Mann S., Nat. Mater. 2017, 16, 857. - PubMed
    1. a) Booth M. J., Schild V. R., Graham A. D., Olof S. N., Bayley H., Sci. Adv. 2016, 2, e1600056; - PMC - PubMed
    2. b) Booth M. J., Schild V. R., Downs F. G., Bayley H., Mol. BioSyst. 2017, 13, 1658; - PubMed
    3. c) Booth M. J., Schild V. R., Box S. J., Bayley H., Sci. Rep. 2017, 7, 9315. - PMC - PubMed
    1. Li Q., Li S., Zhang X., Xu W., Han X., Nat. Commun. 2020, 11, 232. - PMC - PubMed
    1. Wang X. J., Tian L. F., Du H., Li M., Mu W., Drinkwater B. W., Han X. J., Mann S., Chem. Sci. 2019, 10, 9446. - PMC - PubMed

MeSH terms

LinkOut - more resources