

CDX2 expression in the hematopoietic lineage promotes leukemogenesis via TGFβ inhibition
- PMID: 33960108
- PMCID: PMC8410536
- DOI: 10.1002/1878-0261.12982
CDX2 expression in the hematopoietic lineage promotes leukemogenesis via TGFβ inhibition
Abstract
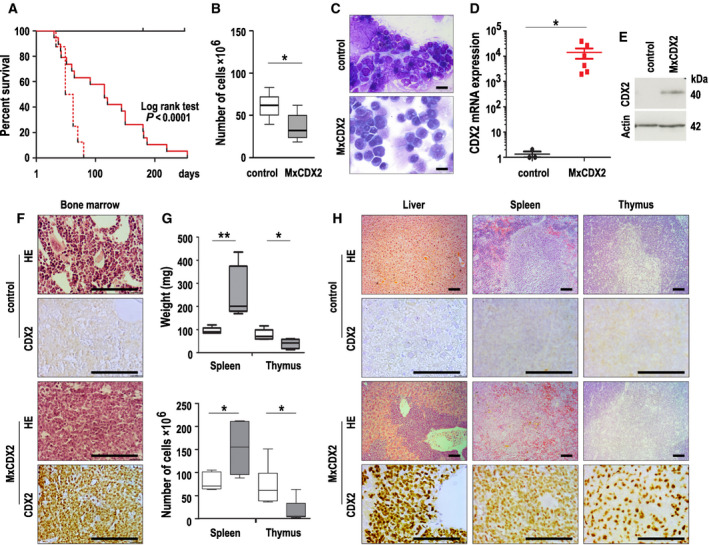
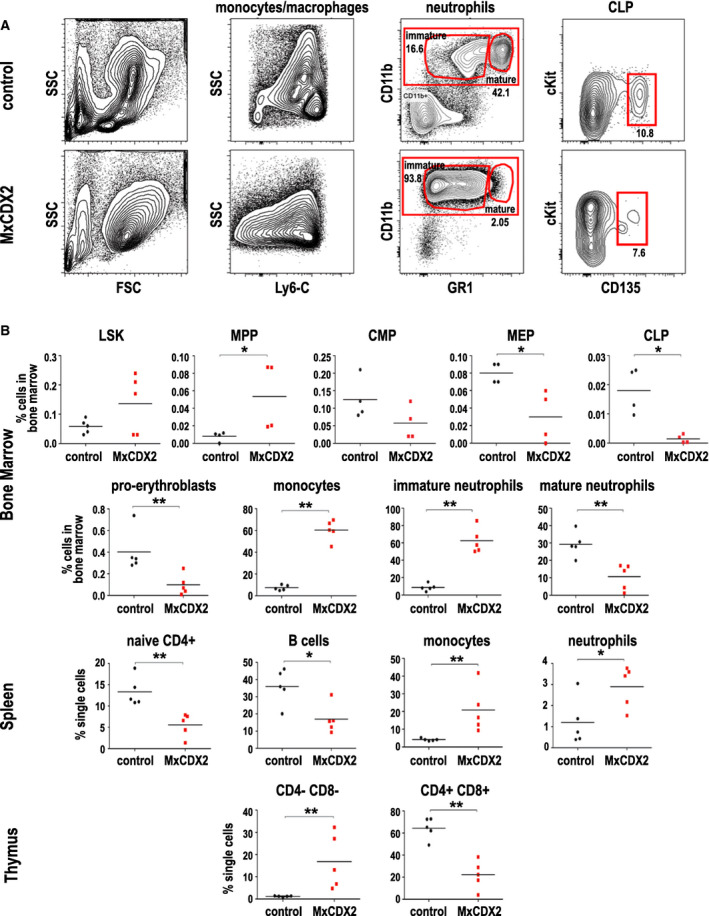
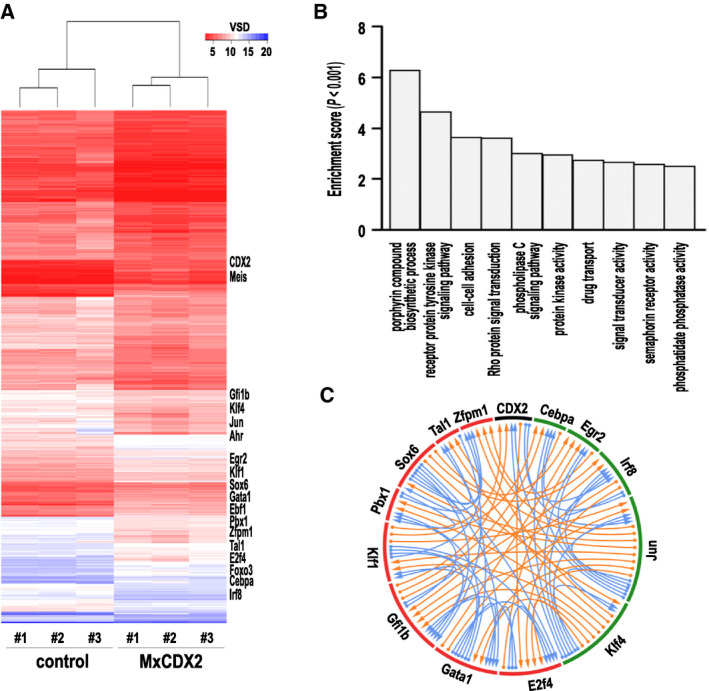
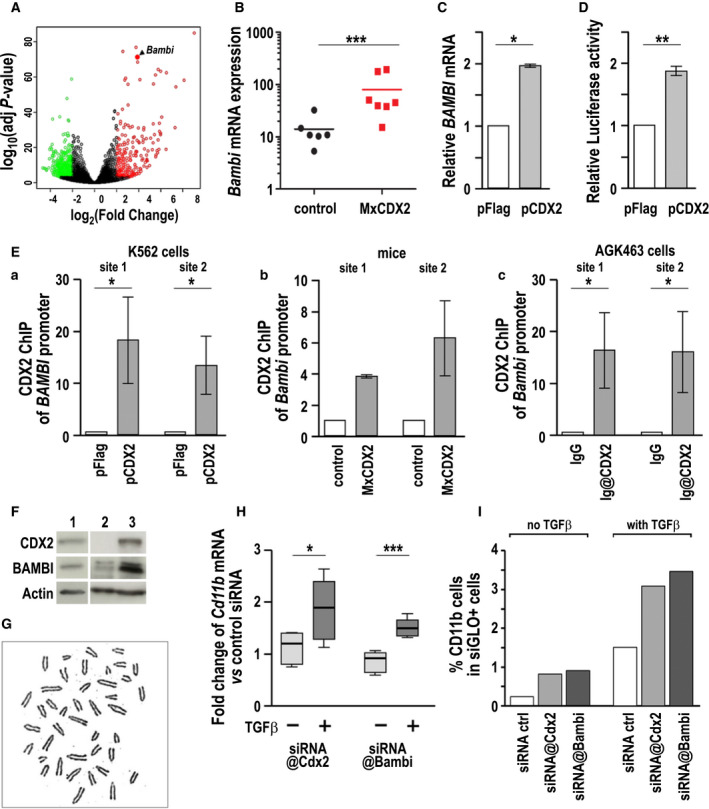
The intestine-specific caudal-related homeobox gene-2 (CDX2) homeobox gene, while being a tumor suppressor in the gut, is ectopically expressed in a large proportion of acute leukemia and is associated with poor prognosis. Here, we report that turning on human CDX2 expression in the hematopoietic lineage of mice induces acute monoblastic leukemia, characterized by the decrease in erythroid and lymphoid cells at the benefit of immature monocytic and granulocytic cells. One of the highly stimulated genes in leukemic bone marrow cells was BMP and activin membrane-bound inhibitor (Bambi), an inhibitor of transforming growth factor-β (TGF-β) signaling. The CDX2 protein was shown to bind to and activate the transcription of the human BAMBI promoter. Moreover, in a leukemic cell line established from CDX2-expressing mice, reducing the levels of CDX2 or Bambi stimulated the TGF-β-dependent expression of Cd11b, a marker of monocyte maturation. Taken together, this work demonstrates the strong oncogenic potential of the homeobox gene CDX2 in the hematopoietic lineage, in contrast with its physiological tumor suppressor activity exerted in the gut. It also reveals, through BAMBI and TGF-β signaling, the involvement of CDX2 in the perturbation of the interactions between leukemia cells and their microenvironment.
Keywords: BAMBI; acute monoblastic leukemia; ectopic expression; oncogene; tumor suppressor.
© 2021 The Authors. Molecular Oncology published by John Wiley & Sons Ltd on behalf of Federation of European Biochemical Societies.
Conflict of interest statement
The authors declare no conflict of interest.
Figures
Similar articles
-
Transcriptional repression of the transforming growth factor β (TGF-β) Pseudoreceptor BMP and activin membrane-bound inhibitor (BAMBI) by Nuclear Factor κB (NF-κB) p50 enhances TGF-β signaling in hepatic stellate cells.J Biol Chem. 2014 Mar 7;289(10):7082-7091. doi: 10.1074/jbc.M113.543769. Epub 2014 Jan 21. J Biol Chem. 2014. PMID: 24448807 Free PMC article.
-
Identification of BMP and activin membrane-bound inhibitor (BAMBI), an inhibitor of transforming growth factor-beta signaling, as a target of the beta-catenin pathway in colorectal tumor cells.J Biol Chem. 2004 Feb 20;279(8):6840-6. doi: 10.1074/jbc.M310876200. Epub 2003 Dec 1. J Biol Chem. 2004. PMID: 14660579
-
Ectopic expression of the homeobox gene Cdx2 is the transforming event in a mouse model of t(12;13)(p13;q12) acute myeloid leukemia.Proc Natl Acad Sci U S A. 2004 Jan 20;101(3):817-22. doi: 10.1073/pnas.0305555101. Epub 2004 Jan 12. Proc Natl Acad Sci U S A. 2004. PMID: 14718672 Free PMC article.
-
Gene methylation in gastric cancer.Clin Chim Acta. 2013 Sep 23;424:53-65. doi: 10.1016/j.cca.2013.05.002. Epub 2013 May 10. Clin Chim Acta. 2013. PMID: 23669186 Review.
-
The clinical significance of CDX2 in leukemia: A new perspective for leukemia research.Leuk Res. 2018 Sep;72:45-51. doi: 10.1016/j.leukres.2018.07.021. Epub 2018 Jul 29. Leuk Res. 2018. PMID: 30096576 Review.
Cited by
-
Regulation of the THRA gene, encoding the thyroid hormone nuclear receptor TRα1, in intestinal lesions.Mol Oncol. 2022 Dec;16(22):3975-3993. doi: 10.1002/1878-0261.13298. Epub 2022 Oct 10. Mol Oncol. 2022. PMID: 36217307 Free PMC article.
-
Enhancer retargeting of CDX2 and UBTF::ATXN7L3 define a subtype of high-risk B-progenitor acute lymphoblastic leukemia.Blood. 2022 Jun 16;139(24):3519-3531. doi: 10.1182/blood.2022015444. Blood. 2022. PMID: 35192684 Free PMC article.
-
Concurrent CDX2 cis-deregulation and UBTF::ATXN7L3 fusion define a novel high-risk subtype of B-cell ALL.Blood. 2022 Jun 16;139(24):3505-3518. doi: 10.1182/blood.2021014723. Blood. 2022. PMID: 35316324 Free PMC article.
-
Helicobacter pylori SlyD stabilizes TPT1 via hnRNPK and enhances OCT1-mediated CDX2 transcriptional activation to drive gastric intestinal metaplasia.BMC Med. 2025 Feb 6;23(1):71. doi: 10.1186/s12916-025-03911-8. BMC Med. 2025. PMID: 39915880 Free PMC article.
-
Unraveling the Genetic Heterogeneity of Acute Lymphoblastic Leukemia Based on NGS Applications.Cancers (Basel). 2024 Nov 26;16(23):3965. doi: 10.3390/cancers16233965. Cancers (Basel). 2024. PMID: 39682152 Free PMC article. Review.
References
-
- Aoki K, Kakizaki F, Sakashita H, Manabe T, Aoki M & Taketo MM (2011) Suppression of colonic polyposis by homeoprotein CDX2 through its nontranscriptional function that stabilizes p27Kip1. Cancer Res 71, 593–602. - PubMed
Publication types
MeSH terms
Substances
LinkOut - more resources
Full Text Sources
Other Literature Sources
Molecular Biology Databases
Research Materials
