

HOTAIR lncRNA promotes epithelial-mesenchymal transition by redistributing LSD1 at regulatory chromatin regions
- PMID: 33960111
- PMCID: PMC8366456
- DOI: 10.15252/embr.202050193
HOTAIR lncRNA promotes epithelial-mesenchymal transition by redistributing LSD1 at regulatory chromatin regions
Abstract
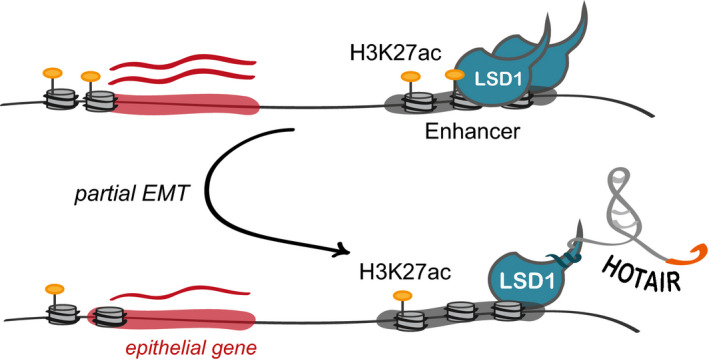
Epithelial-to-mesenchymal transition (EMT) describes the loss of epithelial traits and gain of mesenchymal traits by normal cells during development and by neoplastic cells during cancer metastasis. The long noncoding RNA HOTAIR triggers EMT, in part by serving as a scaffold for PRC2 and thus promoting repressive histone H3K27 methylation. In addition to PRC2, HOTAIR interacts with the LSD1 lysine demethylase, an epigenetic regulator of cell fate during development and differentiation, but little is known about the role of LSD1 in HOTAIR function during EMT. Here, we show that HOTAIR requires its LSD1-interacting domain, but not its PRC2-interacting domain, to promote the migration of epithelial cells. This activity is suppressed by LSD1 overexpression. LSD1-HOTAIR interactions induce partial reprogramming of the epithelial transcriptome altering LSD1 distribution at promoter and enhancer regions. Thus, we uncover an unexpected role of HOTAIR in EMT as an LSD1 decommissioning factor, counteracting its activity in the control of epithelial identity.
Keywords: EMT; HOTAIR; LSD1; enhancer; promoter.
© 2021 The Authors.
Conflict of interest statement
The authors declare that they have no conflict of interest.
Figures

- A
Stable Epi cell lines ectopically expressing CTR (GFP), full‐length HOTAIR (HOT), HOTAIR lacking PRC2‐ or LSD1‐interacting domains, HOTΔP and HOTΔL, respectively.
- B–D
Quantification of the wound area invaded in 24 h (gray dots) for Epi cells expressing CTR, HOT, HOTΔP or HOTΔP (B), or Mes cells transfected with ASO CTR (control), ASO1 and ASO2 targeting HOTAIR (C), or Epi cells overexpressing CTR or HOT alone or together with LSD1 (LSD1‐OE) (D). Bars correspond to mean values and confidence interval (CI) of 95%. ***P‐value < 10−4, **P‐value < 0.03 (Student t‐test, N = 48 for (B), N = 6 for (C), N = 30 for (D)).
- E
ZO‐1 and GAPDH protein levels assessed in Epi cells by Western blot of whole protein extracts.
- F
Quantification of ZO‐1 levels (gray dots) in four independent Western blot experiments by ImageJ. *P‐value < 0.05 (Student's t‐test), bars correspond to mean ± standard deviation (N = 4).
- G
ZO‐1 quantification of IF images performed using the Fiji software and bar‐plotted as normalized integrated densities per cell (gray dots) with bars corresponding to mean ± standard error of the mean (SEM) for at least 11 high‐field units of at least 100 cells; *P‐value < 0.05 (Student's t‐test, N = 11).

Epi and Mes cell lines corresponding to HA5‐early and HA5‐late, respectively (Castro‐Vega et al, 2013), stained for F‐actin fibers by Phalloidin‐TRITC and for DNA by DAPI (scale bar, 16 µm).
HOTAIR levels quantified in Epi and Mes cells by random‐primed RT–qPCR, relative to RPL11 mRNA (gray dots); bars represent mean ± standard deviation for three replicates.
Protein levels of EMT markers in whole protein extracts of parental Epi and Mes cells assessed by Western blot.
HOTAIR quantification by random‐primed RT–qPCR in Epi cell lines normalized to RPL11 mRNA and represented as a fold change to CTR. Each dot corresponds to independent replicate; bars represent mean ± standard deviation values.
Quantification of HOTAIR variants associated with LSD1 and EZH2 by RT–qPCR in two independent RIP experiments (R1 and R2), represented as a % of input, with fold‐enrichment.
Distribution of full‐length and truncated variants of HOTAIR between cytoplasm (cyt), nucleoplasm (nuc), and chromatin (chr) fractions in Mes and transduced Epi cells (HOT, HOTΔP, HOTΔL) assessed by RT–qPCR relative to GAPDH mature mRNA.
Subcellular distribution and protein levels of LSD1, RNA Pol II, H3K4me3, and GAPDH in cytoplasm, nucleoplasm, and chromatin fractions in Epi cells expressing CTR (C), HOT (H), HOTΔP (P), and HOTΔL (L).
Protein levels of LSD1, EZH2, and GAPDH in whole protein extracts assessed by Western blot in Epi‐CTR, ‐HOT, ‐HOTΔP, and ‐HOTΔL cells. * The Lsd1 signal at 75 kD was detected only in total and cytoplasm protein fractions and may correspond to either degradation product or Lsd1 variant.

Number of up‐ and downregulated protein‐coding genes (PCG) defined as differentially expressed in Epi‐HOT, ‐HOTΔP, and ‐HOTΔP cells compared to Epi‐CTR by RNA‐seq and DESeq analysis (fold change > 2 and adj. P‐value < 0.05), including those associated with EMT (Gröger set, Dataset EV2) and already identified as HOTAIR/PRC2 targets (Gupta set, Dataset EV2); nd stands for non‐determined.
Venn diagram of intersection of down‐ and upregulated protein‐coding genes in Epi‐HOT, ‐HOTΔP, and ‐HOTΔL cells compared to Epi‐CTR. HPL‐neg and HPL‐pos are gene sets down‐ and upregulated only by the full‐length HOTAIR (Dataset EV2).
KEGG pathways identified by DAVID as significantly enriched (adj. P‐value < 0.05) for HPL‐neg and HPL‐pos sets of protein‐coding genes, ranked by enrichment score calculated as −log10(P‐value).

Protein‐coding gene assignment to Low and High Migration Signature sets according to differential expression features.
Heatmap of unsupervised hierarchical clustering based on Low Migration Signature (LMS) and High Migration Signature (HMS) gene expression.
Heatmap of enrichment scores (−log10(P‐value)) for KEGG pathways significantly enriched for LMS and HMS protein‐coding genes (DAVID, P‐value < 0.05).
LMS (red) and HMS (black) gene expression quantification in Epi cells by random‐primed RT–qPCR relative to RPL11 and represented as log2 fold change to CTR. Each dot corresponds to an independent replicate; bars represent mean ± standard deviation values.

H3K27ac reads distribution across distinct genomic features, and H3K27ac peaks identification and assignment to gene promoters in Epi‐CTR and cells expressing HOT, HOTΔP, and HOTΔL variants.
Box‐plot distribution of H3K27ac mid‐peak to the closest TSS in Epi‐CTR (N = 5,770), ‐HOT (N = 4,103), HOTΔP (N = 4,825), and HOTΔL (N = 5,282). Central bars represent the median, boxes—lower and upper quartiles and whiskers are set to 1.5*interquartile range (IQR) above the third and below the first quartiles.
Metagene profiling within the 10‐kb window around TSS of H3K27ac, LSD1, and H3K4me2 over IgG in Epi cells for three classes of gene promoters: enriched in H3K27ac in low‐migrating CTR and HOTΔL cells (Class 1, red) or in high‐migrating HOT and HOTΔP cells (Class 2, gray) and all other cases (Class 3, yellow). Red and yellow parallel lines correspond to peak summit values in Epi‐CTR cells for genes of Class 1 and Class 2, respectively. Epi cells expressing none (CTR) or different HOTAIR variants (HOT, HOTΔP, and HOTΔL).
Box‐plot of Log2 fold changes (FC) of H3K27ac mean density of each peak in pairwise comparisons between four Epi cell lines expressing CTR (C), HOT (H), HOTΔP (P), and HOTΔL (L) for Class 1 (N = 7,467), Class 2 (N = 426), and Class 3 (N = 7,722) transcripts. Central bars represent the median, boxes—lower and upper quartiles and whiskers are set to 1.5*IQR above the third and below the first quartiles.

Venn diagram representing intersections of gene promoters possessing H3K27ac peaks within the 2‐kb window around their TSS in Epi cells.
Metagene profiling within the 10‐kb window around TSS of H3K27ac, LSD1, and H3K4me2 over IgG in Epi cells expressing none (CTR) or different HOTAIR variants (HOT, HOTΔP, and HOTΔL). bp stands for base pairs.
Heatmap of unsupervised hierarchical clustering based on H3K27ac mean values at gene promoters showing separation of two phenotypic groups.
Biological process pathways identified by DAVID as enriched for Class 1 or Class 2 genes hyperacetylated in low‐ or high‐migrating cells, respectively (adj. P‐value < 0.05 for Class 1 and P‐value < 0.05 for Class 2). Dots represent GO term enrichment with color coding: red for high enrichment, blue for low enrichment, and sizes of the dots representing the significance score of each subset (the bigger the dot, the higher its significance).
Visualization of the H3K27ac, Lsd1, and H3K4me2 CUT&RUN and of RNA‐seq tracks of the TGFB2 promoter region in Epi‐CTR, ‐HOT, ‐HOTΔP, and ‐HOTΔL cells.

LSD1 tags distribution across distinct genomic features, and a summary of LSD1 peaks, regions, and gene promoters with LSD1 peaks in Epi cells expressing CTR or HOT, HOTΔP, and HOTΔL variants.
Box‐plot distribution of LSD1 mid‐peak to the closest TSS in Epi‐CTR (N = 3,548), ‐HOT (N = 2,797), HOTΔP (N = 1,670), and HOTΔL (N = 2,754). Central bars represent the median, boxes—lower and upper quartiles and whiskers are set to 1.5*IQR above the third and below the first quartiles.
Venn diagram representing intersections of LSD1 peak regions in Epi cells.
H3K4me2 tags distribution across distinct genomic features, and H3K4me2 peaks identification, merging to regions and assignment to gene promoters in Epi‐CTR and cells expressing HOT, HOTΔP, and HOTΔL variants.
Box‐plot distribution of H3K4me2 mid‐peak to the closest TSS. in Epi‐CTR (N = 22,172), ‐HOT (N = 21,636), HOTΔP (N = 22,199), and HOTΔL (N = 21,874). Central bars represent the median, boxes—lower and upper quartiles and whiskers are set to 1.5*IQR above the third and below the first quartiles.
Venn diagram representing intersections of H3K4me2 peak regions in Epi cells.

Annotation of active enhancers and super‐enhancers by LILY using H3K27ac as a hallmark, in Epi cells expressing none (CTR), full‐length (HOT) and truncated variants (HOTΔP and HOTΔL) of HOTAIR.
Venn diagram representing intersections of active super‐enhancer regions in Epi cells.

Venn diagram representing intersections of active enhancer regions in Epi cells.
Diagram representing putative active enhancers identified by LILY in each cell line and shared between low‐ or high‐migrating groups, respectively.
Metagene profiling of H3K27ac, LSD1, and H3K4me2 over IgG within the 5‐kb window of enhancers in Epi cells expressing none (CTR) or different HOTAIR variants (HOT, HOTΔP, and HOTΔL). bp stands for base pairs.

- A
Metagene profiling of LSD1 and H3K4me2 over IgG tags ratio within the 5‐kb window of enhancers shared by low‐migrating Epi‐CTR and ‐HOTΔL cells (red) or by high‐migrating Epi‐HOT and ‐HOTΔP cells (gray). Parallel lines indicate the peak summit in Epi‐CTR, bp stands for base pairs.
- B, C
Box‐plot of Log2 LSD1 and H3K4me2 densities at enhancers shared by low‐ (red, N = 775) and high‐migrating cells (gray, N = 53). Central bars represent the median, boxes—lower and upper quartiles and whiskers are set to 1.5*IQR above the third and below the first quartiles. C = CTR, H = HOT, P = HOTΔP, L = HOTΔL. Adj. P‐value was calculated by Bonferroni method, Wilcoxon test and represented only for significant changes observed for LSD1 at enhancers shared by low‐migrating cells.
References
-
- Battistelli C, Cicchini C, Santangelo L, Tramontano A, Grassi L, Gonzalez FJ, de Nonno V, Grassi G, Amicone L, Tripodi M (2017) The Snail repressor recruits EZH2 to specific genomic sites through the enrollment of the lncRNA HOTAIR in epithelial‐to‐mesenchymal transition. Oncogene 36: 942–955 - PMC - PubMed
-
- Boeva V, Louis‐Brennetot C, Peltier A, Durand S, Pierre‐Eugène C, Raynal V, Etchevers HC, Thomas S, Lermine A, Daudigeos‐Dubus Eet al (2017) Heterogeneity of neuroblastoma cell identity defined by transcriptional circuitries. Nat Genet 49: 1408–1413 - PubMed
Publication types
MeSH terms
Substances
Associated data
- Actions
Grants and funding
LinkOut - more resources
Full Text Sources
Other Literature Sources
Molecular Biology Databases
Research Materials
