. 2021 Nov;31(6):2058-2069.
doi: 10.1111/ina.12847. Epub 2021 May 7.

Wind tunnel-based testing of a photoelectrochemical oxidative filter-based air purification unit in coronavirus and influenza aerosol removal and inactivation

Affiliations

Wind tunnel-based testing of a photoelectrochemical oxidative filter-based air purification unit in coronavirus and influenza aerosol removal and inactivation

Yuechen Qiao et al. Indoor Air. 2021 Nov.

Abstract

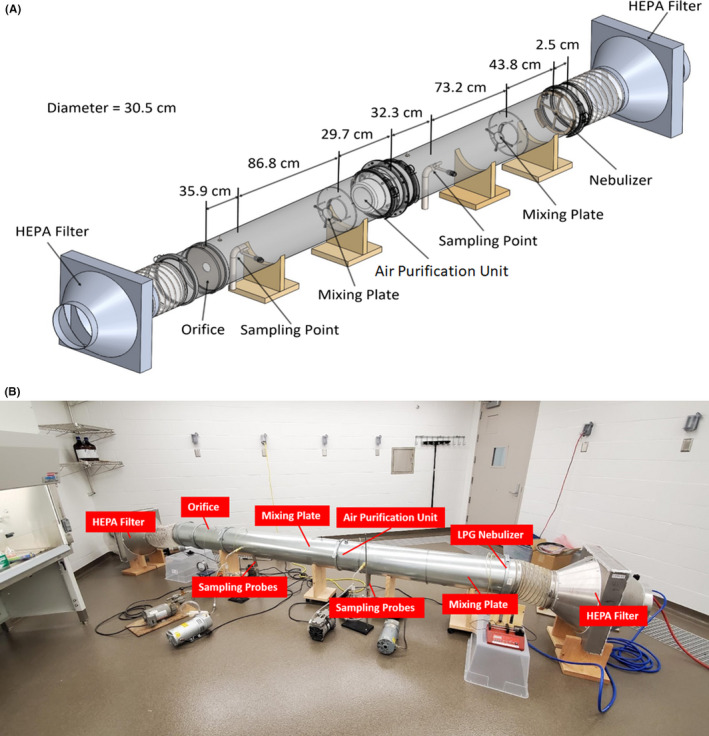
Recirculating air purification technologies are employed as potential means of reducing exposure to aerosol particles and airborne viruses. Toward improved testing of recirculating air purification units, we developed and applied a medium-scale single-pass wind tunnel test to examine the size-dependent collection of particles and the collection and inactivation of viable bovine coronavirus (BCoV, a betacoronavirus), porcine respiratory coronavirus (PRCV, an alphacoronavirus), and influenza A virus (IAV), by a commercial air purification unit. The tested unit, the Molekule Air Mini, incorporates a MERV 16 filter as well as a photoelectrochemical oxidating layer. It was found to have a collection efficiency above 95.8% for all tested particle diameters and flow rates, with collection efficiencies above 99% for supermicrometer particles with the minimum collection efficiency for particles smaller than 100 nm. For all three tested viruses, the physical tracer-based log reduction was near 2.0 (99% removal). Conversely, the viable virus log reductions were found to be near 4.0 for IAV, 3.0 for BCoV, and 2.5 for PRCV, suggesting additional inactivation in a virus family- and genus-specific manner. In total, this work describes a suite of test methods which can be used to rigorously evaluate the efficacy of recirculating air purification technologies.

Keywords: air purifier; coronavirus; filtration; influenza; photoelectrochemical oxidation; virus aerosols; wind tunnel test.


Conflict of interest statement

None of the authors have any financial or personal interests related to the results of this study.

Figures

FIGURE 1
FIGURE 1
A schematic diagram of the wind tunnel system utilized in penetration and log reduction measurements with the air purifier unit installed (A). Labeled photograph of the wind tunnel system within a biosafety level II room (B)
FIGURE 2
FIGURE 2
Particle penetration versus particle diameter for the air purification unit, measured in a sealed wind tunnel. Solid lines denoted measurements utilizing a scanning mobility particle sizer, while dashed lines denote optical particle sizer results. The error bars are the standard deviation according to the four penetration values at each particle size determined following ASHRAE Standard 52.2 guidelines
FIGURE 3
FIGURE 3
Log reductions in virus concentrations (log10[upstream concentration/downstream concentration] with concentration based upon fluorescein tracer (physical removal), RT‐qPCR (RNA physical removal and damage), and virus titration (viable viruses) for bovine coronavirus (BCoV), porcine respiratory coronavirus (PRCV), influenza A virus (IAV). The error bars are the standard deviation of the log reduction calculated by root sum square error propagation method applying the standard deviations of the upstream and downstream triplicate measurements
FIGURE 4
FIGURE 4
Images of 1 in × 2 in cutout strips of photoelectrochemical oxidation (PECO) filter laminates and HEPA filter media used in virus surface inactivation studies (A). Log reduction over time on various filter media based upon bovine coronavirus titer (B). Log reduction over time on various filter media based upon bovine coronavirus RT‐qPCR (C). Log reduction was calculated based on the average values of three replicates at different sampling times, comparing with initial time (t = 0) in both titer and RT‐qPCR measurements. Error bars were calculated using the root sum square error propagation method with the standard deviations for triplicate measurements at the initial time and the sampling time in titer and RT‐qPCR considered, respectively

References

    1. Dabisch P, Schuit M, Herzog A, et al. The influence of temperature, humidity, and simulated sunlight on the infectivity of SARS‐CoV‐2 in aerosols. Aerosol Sci Technol. 2020;55(2):142‐153. - PMC - PubMed
    1. Fears A, Klimstra W, Duprex P, et al. Persistence of severe acute respiratory syndrome coronavirus 2 in aerosol suspensions. Emerg Infect Dis. 2020;26(9):2168. - PMC - PubMed
    1. Lednicky JA, Lauzardo M, Fan ZH, et al. Viable SARS‐CoV‐2 in the air of a hospital room with COVID‐19 patients. Int J Infect Dis. 2020;100:476‐482. - PMC - PubMed
    1. Liu Y, Ning Z, Chen Y, et al. Aerodynamic analysis of SARS‐CoV‐2 in two Wuhan hospitals. Nature. 2020;582(7813):557‐560. - PubMed
    1. Santarpia JL, Rivera DN, Herrera VL, et al. Aerosol and surface contamination of SARS‐CoV‐2 observed in quarantine and isolation care. Sci Rep. 2020;10(1):12732. - PMC - PubMed

Grants and funding