

Protocol for magnetic resonance imaging acquisition, quality assurance, and quality check for the Accelerator program for Discovery in Brain disorders using Stem cells
- PMID: 33960571
- PMCID: PMC8412227
- DOI: 10.1002/mpr.1871
Protocol for magnetic resonance imaging acquisition, quality assurance, and quality check for the Accelerator program for Discovery in Brain disorders using Stem cells
Abstract
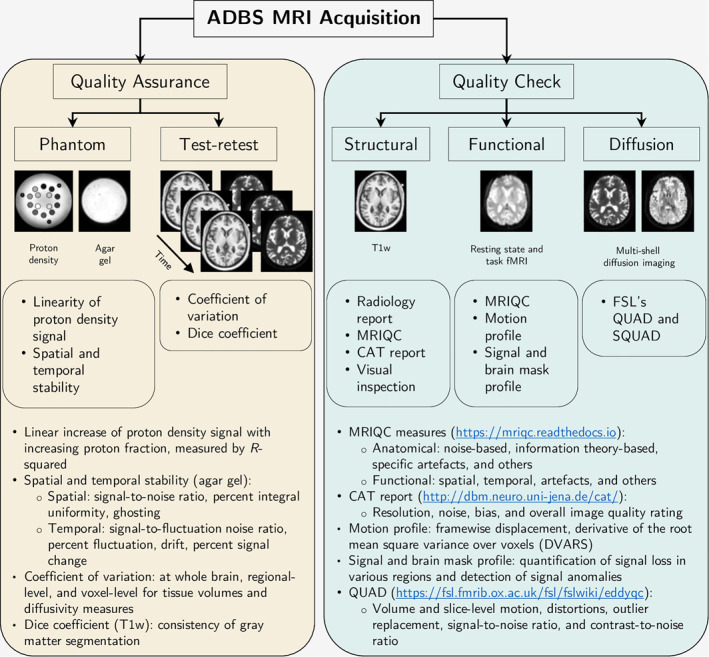
Objective: The Accelerator program for Discovery in Brain disorders using Stem cells (ADBS) is a longitudinal study on five cohorts of patients with major psychiatric disorders from genetically high-risk families, their unaffected first-degree relatives, and healthy subjects. We describe the ADBS protocols for acquisition, quality assurance (QA), and quality check (QC) for multimodal magnetic resonance brain imaging studies.
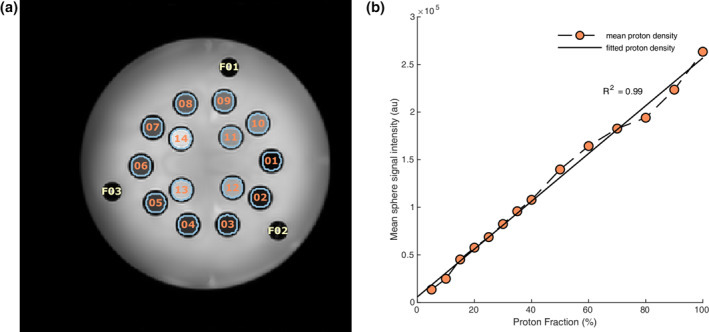
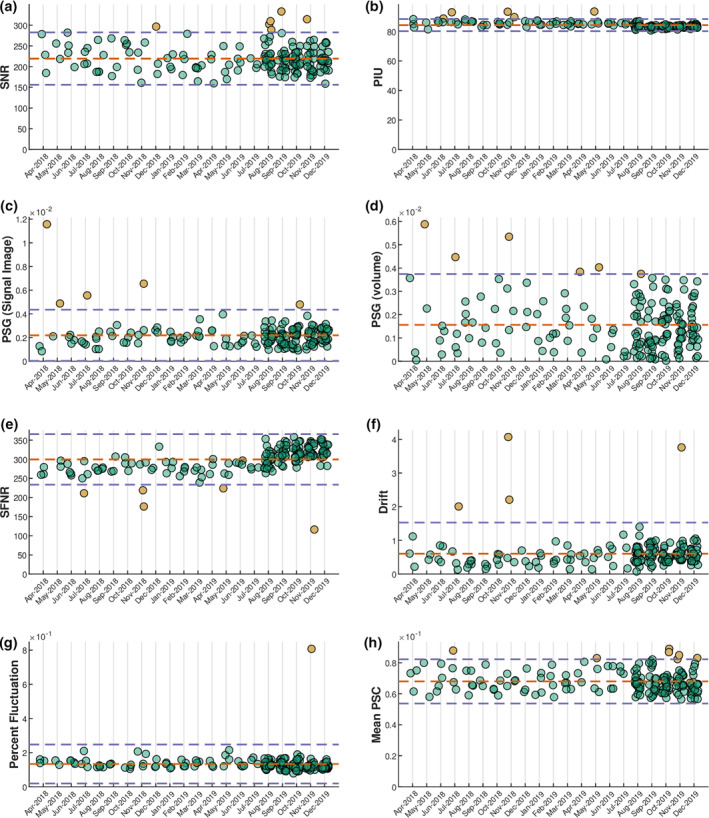
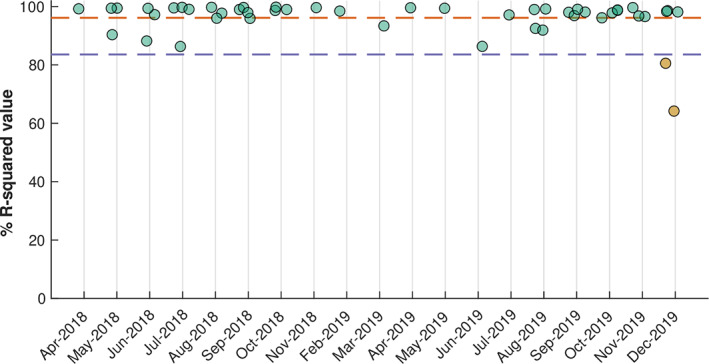
Methods: We describe the acquisition and QC protocols for structural, functional, and diffusion images. For QA, we acquire proton density and functional images on phantoms, along with repeated scans on human volunteer. We describe the analysis of phantom data and test-retest reliability of volumetric and diffusion measures.
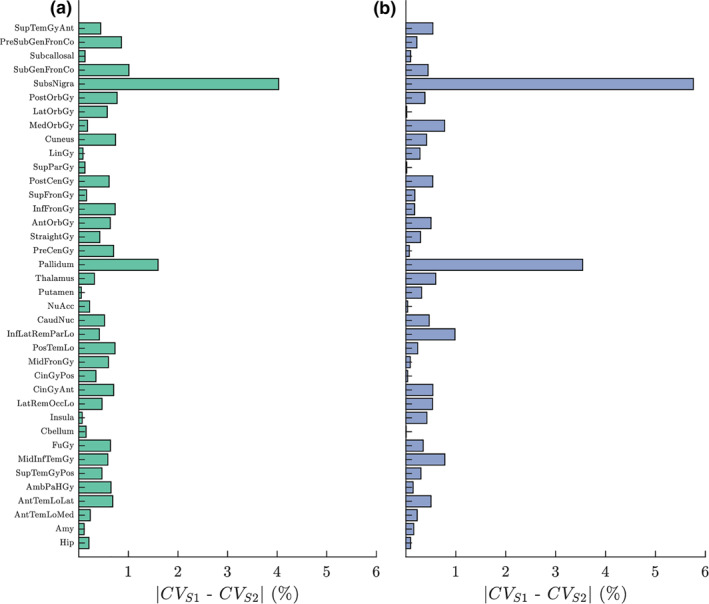
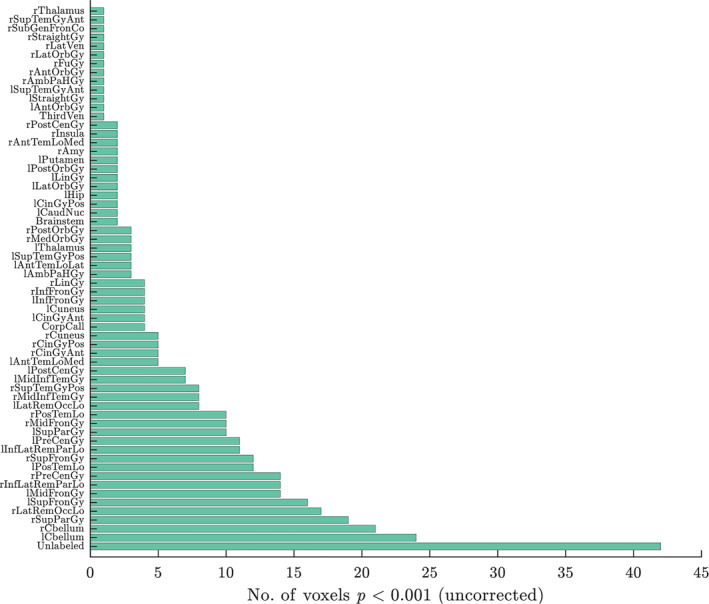
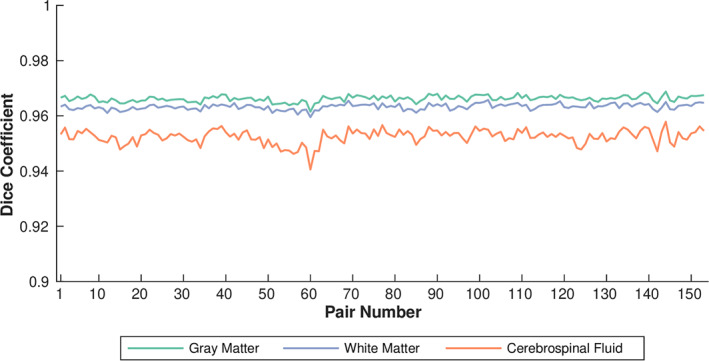
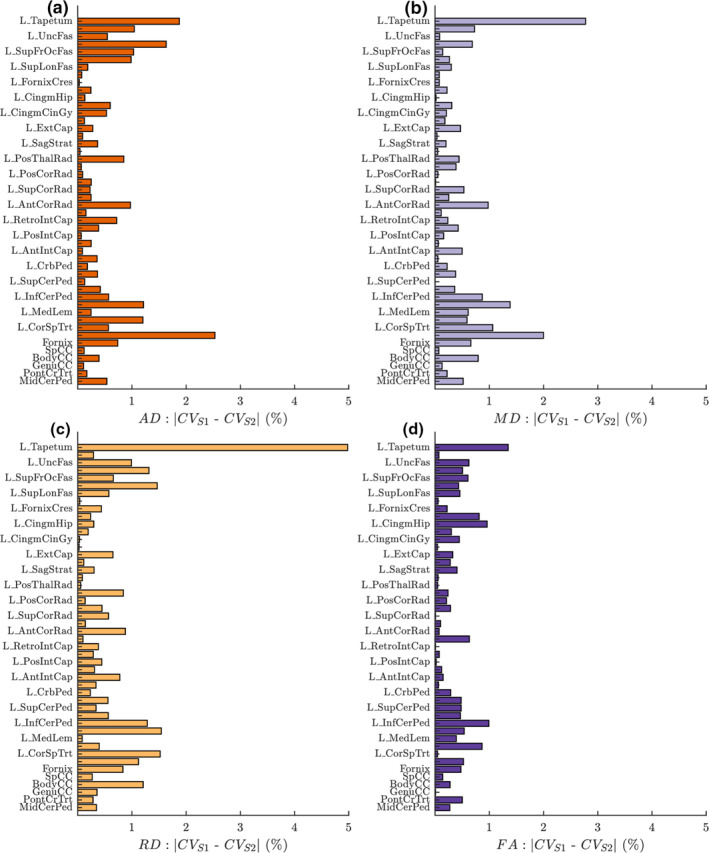
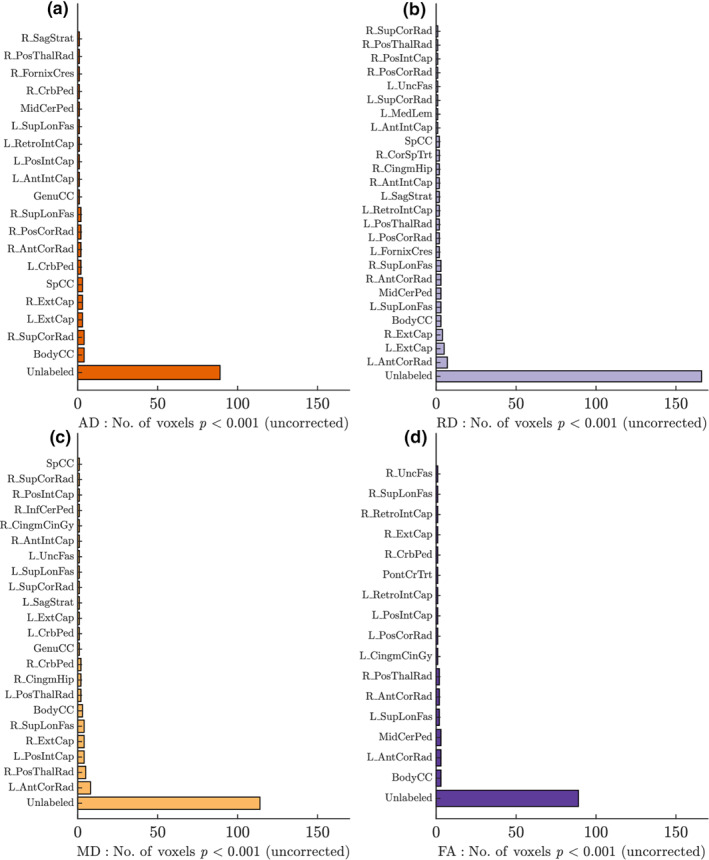
Results: Analysis of acquired phantom data shows linearity of proton density signal with increasing proton fraction, and an overall stability of various spatial and temporal QA measures. Examination of dice coefficient and statistical analyses of coefficient of variation in test-retest data on the human volunteer showed consistency of volumetric and diffusivity measures at whole-brain, regional, and voxel-level.
Conclusion: The described acquisition and QA-QC procedures can yield consistent and reliable quantitative measures. It is expected that this longitudinal neuroimaging dataset will, upon its release, serve the scientific community well and pave the way for interesting discoveries.
Keywords: ADBS; longitudinal study; magnetic resonance imaging; quality assurance; quality check.
© 2021 The Authors. International Journal of Methods in Psychiatric Research published by John Wiley & Sons Ltd.
Conflict of interest statement
The authors declare that there are no conflict of interests.
Figures
Similar articles
-
The Marburg-Münster Affective Disorders Cohort Study (MACS): A quality assurance protocol for MR neuroimaging data.Neuroimage. 2018 May 15;172:450-460. doi: 10.1016/j.neuroimage.2018.01.079. Epub 2018 Feb 1. Neuroimage. 2018. PMID: 29410079
-
A quality assurance phantom for electronic portal imaging devices.J Appl Clin Med Phys. 2011 Feb 2;12(2):3350. doi: 10.1120/jacmp.v12i2.3350. J Appl Clin Med Phys. 2011. PMID: 21587179 Free PMC article.
-
Quality assurance of human functional magnetic resonance imaging: a literature review.Quant Imaging Med Surg. 2019 Jun;9(6):1147-1162. doi: 10.21037/qims.2019.04.18. Quant Imaging Med Surg. 2019. PMID: 31367569 Free PMC article. Review.
-
The impact of quality assurance assessment on diffusion tensor imaging outcomes in a large-scale population-based cohort.Neuroimage. 2016 Jan 15;125:903-919. doi: 10.1016/j.neuroimage.2015.10.068. Epub 2015 Oct 28. Neuroimage. 2016. PMID: 26520775 Free PMC article.
-
Report on a multicenter fMRI quality assurance protocol.J Magn Reson Imaging. 2006 Jun;23(6):827-39. doi: 10.1002/jmri.20583. J Magn Reson Imaging. 2006. PMID: 16649196 Review.
Cited by
-
Patterns of Impaired Neurocognitive Performance on the Global Neuropsychological Assessment, and Their Brain Structural Correlates in Recent-onset and Chronic Schizophrenia.Clin Psychopharmacol Neurosci. 2023 May 30;21(2):340-358. doi: 10.9758/cpn.2023.21.2.340. Clin Psychopharmacol Neurosci. 2023. PMID: 37119227 Free PMC article.
-
Microstructural mapping of neural pathways in Alzheimer's disease using macrostructure-informed normative tractometry.Alzheimers Dement. 2025 Jan;21(1):e14371. doi: 10.1002/alz.14371. Epub 2024 Dec 30. Alzheimers Dement. 2025. PMID: 39737627 Free PMC article.
-
Clinical efficacy and neurobiological correlates of electroconvulsive therapy in patients with clozapine-resistant/intolerant schizophrenia: study protocol of multi-site parallel arm double-blind randomized sham-controlled study.Wellcome Open Res. 2022 Oct 5;7:212. doi: 10.12688/wellcomeopenres.18028.2. eCollection 2022. Wellcome Open Res. 2022. PMID: 37953926 Free PMC article.
-
Microstructural Mapping of Neural Pathways in Alzheimer's Disease using Macrostructure-Informed Normative Tractometry.bioRxiv [Preprint]. 2024 Apr 28:2024.04.25.591183. doi: 10.1101/2024.04.25.591183. bioRxiv. 2024. Update in: Alzheimers Dement. 2025 Jan;21(1):e14371. doi: 10.1002/alz.14371. PMID: 38712293 Free PMC article. Updated. Preprint.
References
-
- Alfaro‐Almagro, F., Jenkinson, M., Bangerter, N. K., Andersson, J. L. R., Griffanti, L., Douaud, G., Sotiropoulos, S. N., Jbabdi, S., Hernandez‐Fernandez, M., Vallee, E., Vidaurre, D., Webster, M., McCarthy, P., Rorden, C., Daducci, A., Alexander, D. C., Zhang, H., Dragonu, I., Matthews, P. M., Miller, K. L.Smith, S. M. (2018). Image processing and quality control for the first 10,000 brain imaging datasets from UK Biobank. NeuroImage, 166, 400–424. 10.1016/j.neuroimage.2017.10.034 - DOI - PMC - PubMed
-
- Andersson, J. L. R., Jenkinson, M., & Stephen, S. (2007a). Non‐linear optimisation (No. FMRIB technical report TR07JA1). www.fmrib.ox.ac.uk/analysis/techrep
Publication types
MeSH terms
Grants and funding
LinkOut - more resources
Full Text Sources
Other Literature Sources
Medical
