

Disentangling age- and disease-related alterations in schizophrenia brain network using structural equation modeling: A graph theoretical study based on minimum spanning tree
- PMID: 33960579
- PMCID: PMC8193510
- DOI: 10.1002/hbm.25403
Disentangling age- and disease-related alterations in schizophrenia brain network using structural equation modeling: A graph theoretical study based on minimum spanning tree
Abstract
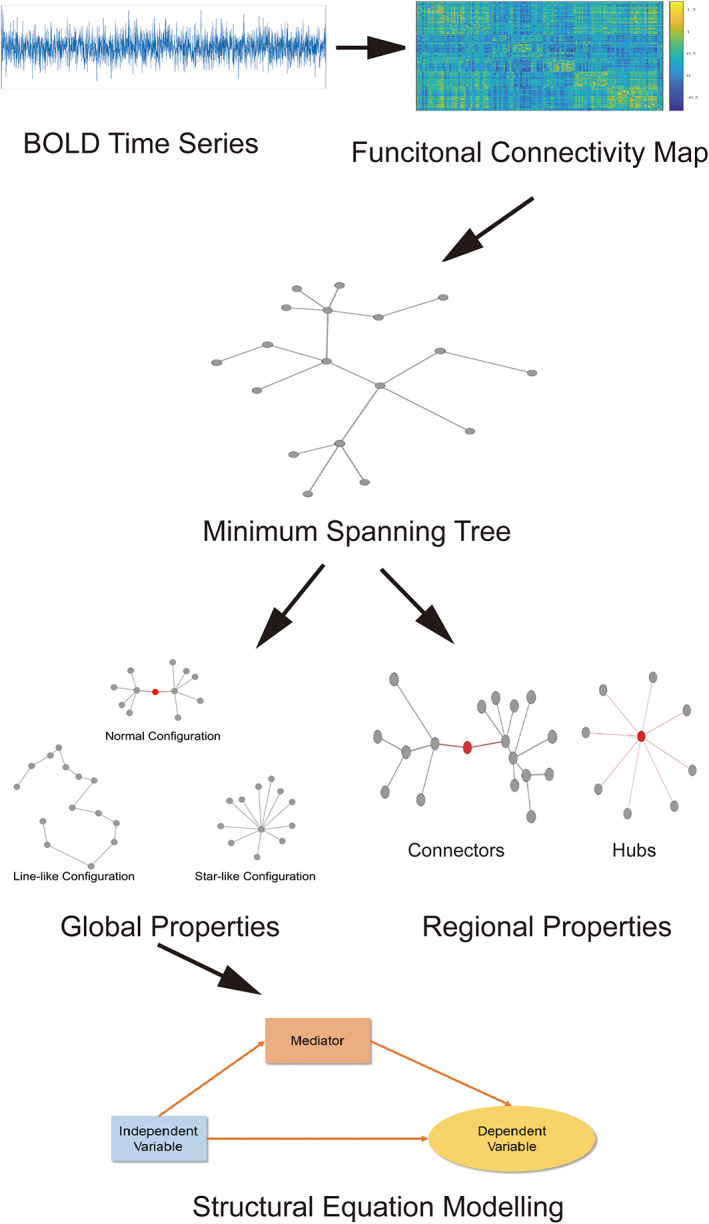
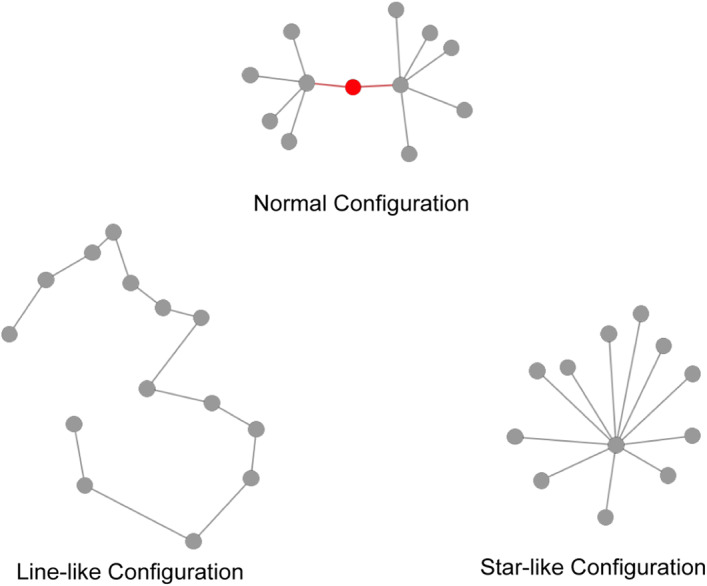
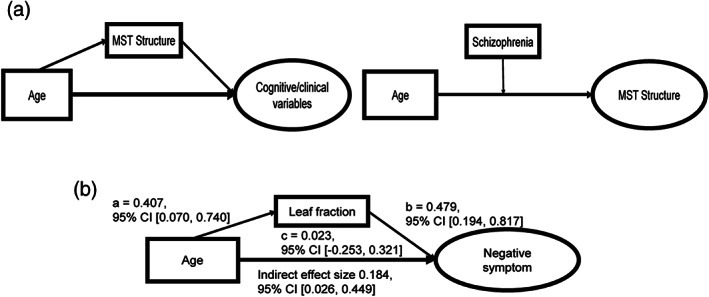
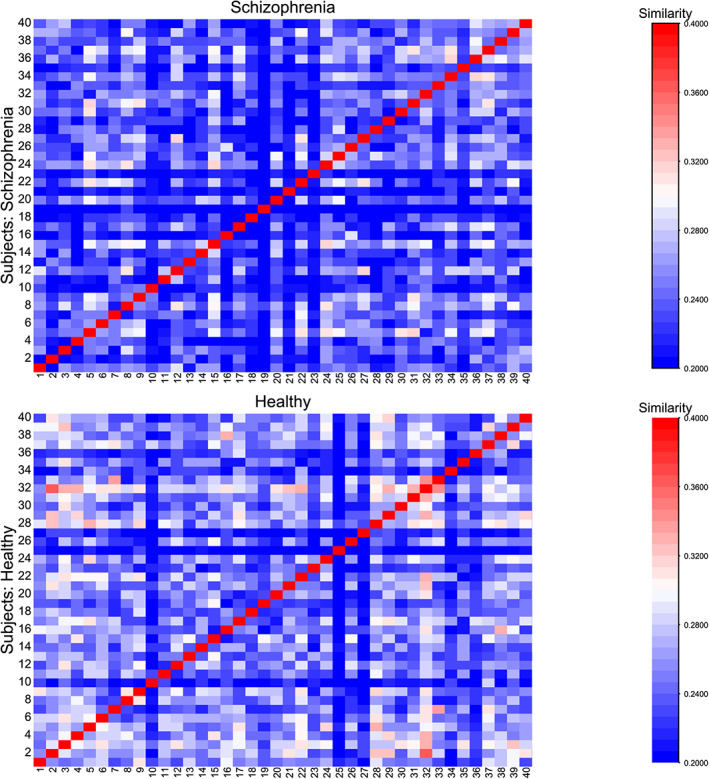
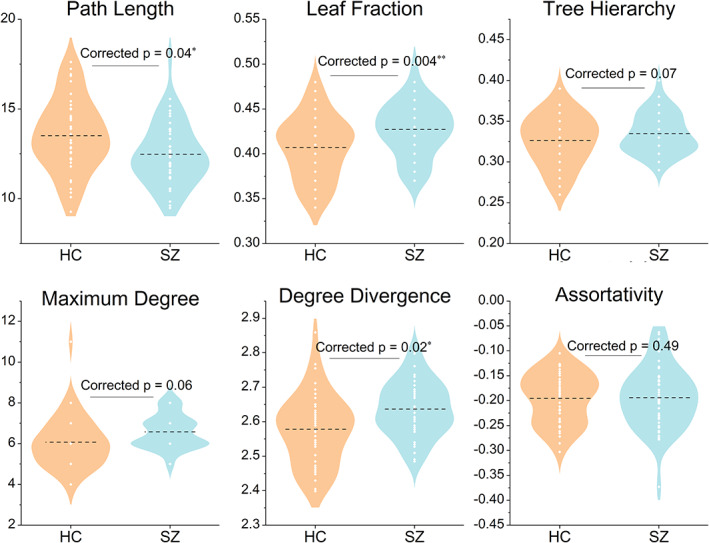
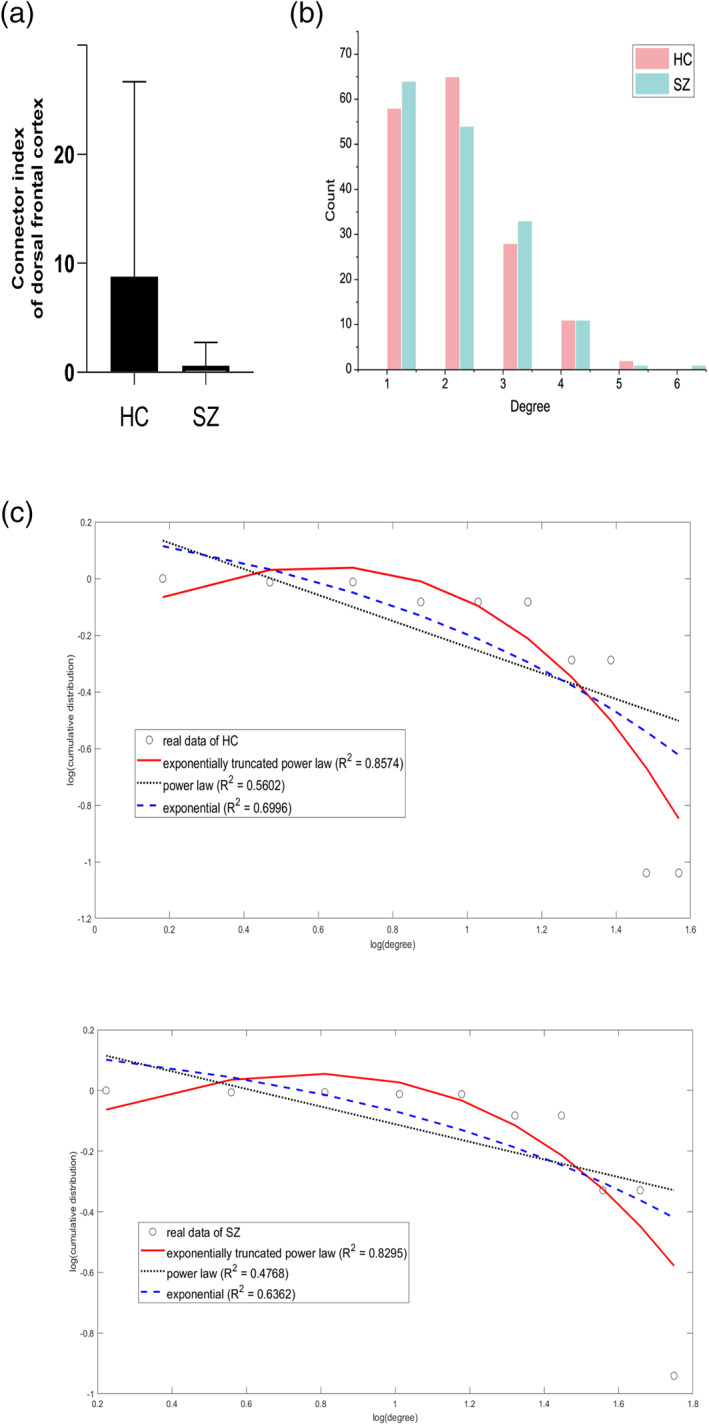
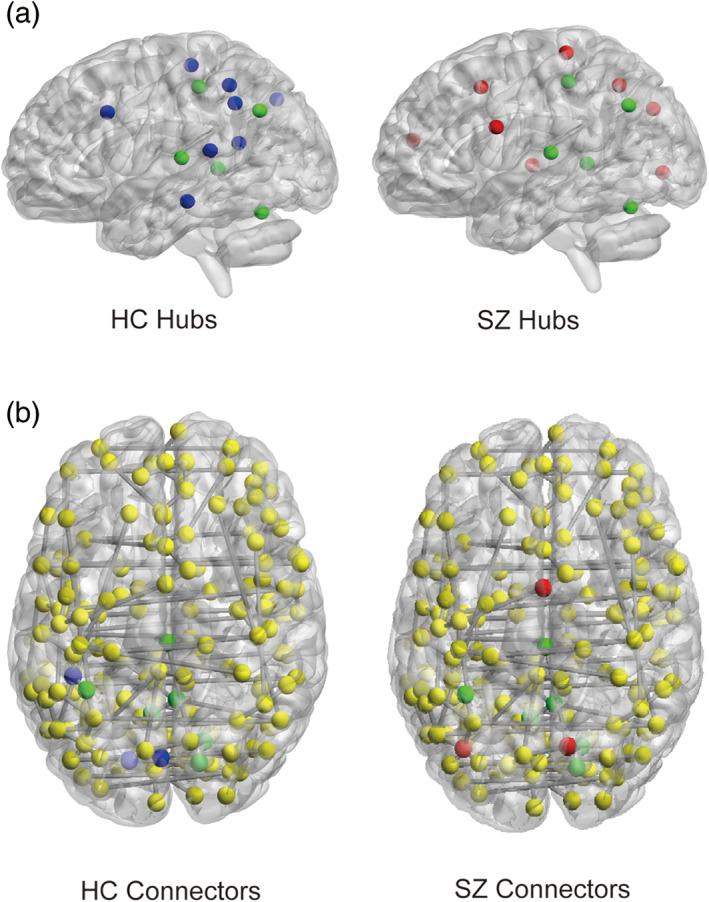
Functional brain networks have been shown to undergo fundamental changes associated with aging or schizophrenia. However, the mechanism of how these factors exert influences jointly or interactively on brain networks remains elusive. A unified recognition of connectomic alteration patterns was also hampered by heterogeneities in network construction and thresholding methods. Recently, an unbiased network representation method regardless of network thresholding, so called minimal spanning tree algorithm, has been applied to study the critical skeleton of the brain network. In this study, we aimed to use minimum spanning tree (MST) as an unbiased network reconstruction and employed structural equation modeling (SEM) to unravel intertwined relationships among multiple phenotypic and connectomic variables in schizophrenia. First, we examined global and local brain network properties in 40 healthy subjects and 40 schizophrenic patients aged 21-55 using resting-state functional magnetic resonance imaging (rs-fMRI). Global network alterations are measured by graph theoretical metrics of MSTs and a connectivity-transitivity two-dimensional approach was proposed to characterize nodal roles. We found that networks of schizophrenic patients exhibited a more star-like global structure compared to controls, indicating excessive integration, and a loss of regional transitivity in the dorsal frontal cortex (corrected p <.05). Regional analysis of MST network topology revealed that schizophrenia patients had more network hubs in frontal regions, which may be linked to the "overloading" hypothesis. Furthermore, using SEM, we found that the level of MST integration mediated the influence of age on negative symptom severity (indirect effect 95% CI [0.026, 0.449]). These findings highlighted an altered network skeleton in schizophrenia and suggested that aging-related enhancement of network integration may undermine functional specialization of distinct neural systems and result in aggravated schizophrenic symptoms.
Keywords: graph theory; mediation analysis; minimum spanning tree; resting-state FMRI; schizophrenia; structural equation modeling.
© 2021 The Authors. Human Brain Mapping published by Wiley Periodicals LLC.
Figures
Similar articles
-
Convergence and Divergence of Brain Network Dysfunction in Deficit and Non-deficit Schizophrenia.Schizophr Bull. 2017 Oct 21;43(6):1315-1328. doi: 10.1093/schbul/sbx014. Schizophr Bull. 2017. PMID: 29036672 Free PMC article.
-
Structural brain network analysis in schizophrenia using minimum spanning tree.Annu Int Conf IEEE Eng Med Biol Soc. 2016 Aug;2016:4075-4078. doi: 10.1109/EMBC.2016.7591622. Annu Int Conf IEEE Eng Med Biol Soc. 2016. PMID: 28269178
-
Transdiagnostic Dysfunctions in Brain Modules Across Patients with Schizophrenia, Bipolar Disorder, and Major Depressive Disorder: A Connectome-Based Study.Schizophr Bull. 2020 Apr 10;46(3):699-712. doi: 10.1093/schbul/sbz111. Schizophr Bull. 2020. PMID: 31755957 Free PMC article.
-
Heterogeneous Brain Abnormalities in Schizophrenia Converge on a Common Network Associated With Symptom Remission.Schizophr Bull. 2024 Apr 30;50(3):545-556. doi: 10.1093/schbul/sbae003. Schizophr Bull. 2024. PMID: 38253437 Free PMC article.
-
Meta-connectomics: human brain network and connectivity meta-analyses.Psychol Med. 2016 Apr;46(5):897-907. doi: 10.1017/S0033291715002895. Epub 2016 Jan 26. Psychol Med. 2016. PMID: 26809184 Free PMC article. Review.
Cited by
-
Long-term risk of late-life depression in widowed elderly: a five-year follow-up study.BMC Geriatr. 2025 May 19;25(1):351. doi: 10.1186/s12877-025-06028-y. BMC Geriatr. 2025. PMID: 40389894 Free PMC article.
-
Network biomarkers in recovered psychosis patients who discontinued antipsychotics.Mol Psychiatry. 2023 Sep;28(9):3717-3726. doi: 10.1038/s41380-023-02279-6. Epub 2023 Sep 29. Mol Psychiatry. 2023. PMID: 37773447 Free PMC article.
-
Predicting the Conversion from Mild Cognitive Impairment to Alzheimer's Disease Using Graph Frequency Bands and Functional Connectivity-Based Features.Res Sq [Preprint]. 2024 Jun 21:rs.3.rs-4549428. doi: 10.21203/rs.3.rs-4549428/v1. Res Sq. 2024. PMID: 38947050 Free PMC article. Preprint.
-
Predictors for quality of life in older adults: network analysis on cognitive and neuropsychiatric symptoms.BMC Geriatr. 2023 Dec 13;23(1):850. doi: 10.1186/s12877-023-04462-4. BMC Geriatr. 2023. PMID: 38093173 Free PMC article.
-
Resting-state functional connectivity correlates of brain structural aging in schizophrenia.Eur Arch Psychiatry Clin Neurosci. 2025 Apr;275(3):755-766. doi: 10.1007/s00406-024-01837-5. Epub 2024 Jun 25. Eur Arch Psychiatry Clin Neurosci. 2025. PMID: 38914851
References
-
- Alexander‐Bloch, A. , Lambiotte, R. , Roberts, B. , Giedd, J. , Gogtay, N. , & Bullmore, E. (2012). The discovery of population differences in network community structure: New methods and applications to brain functional networks in schizophrenia. NeuroImage, 59(4), 3889–3900. 10.1016/j.neuroimage.2011.11.035 - DOI - PMC - PubMed
-
- Alexander‐Bloch, A. F. , Nitin, G. , David, M. , Rasmus, B. , Liv, C. , Francois, L. , … Jay Giedd, E. T. B. (2010). Disrupted modularity and local connectivity of brain functional networks in childhood‐onset schizophrenia. Frontiers in Systems Neuroscience, 4(October), 1–16. 10.3389/fnsys.2010.00147 - DOI - PMC - PubMed
-
- Alexander‐Bloch, A. F. , Vértes, P. E. , Stidd, R. , Lalonde, F. , Clasen, L. , Rapoport, J. , … Gogtay, N. (2013). The anatomical distance of functional connections predicts brain network topology in health and schizophrenia. Cerebral Cortex, 23(1), 127–138. 10.1093/cercor/bhr388 - DOI - PMC - PubMed
MeSH terms
LinkOut - more resources
Full Text Sources
Other Literature Sources
Medical
