. 2021 Aug 1;42(11):3667-3679.
doi: 10.1002/hbm.25461. Epub 2021 May 7.

Functional connectivity of the human hypothalamus during wakefulness and nonrapid eye movement sleep

Affiliations

Functional connectivity of the human hypothalamus during wakefulness and nonrapid eye movement sleep

Jun Jiang et al. Hum Brain Mapp. .

Abstract

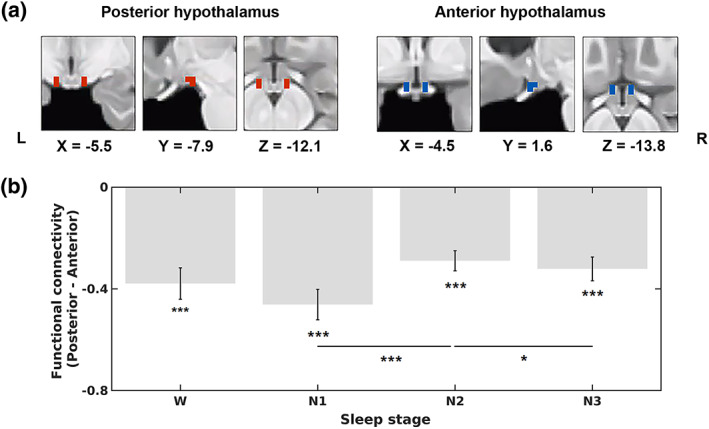
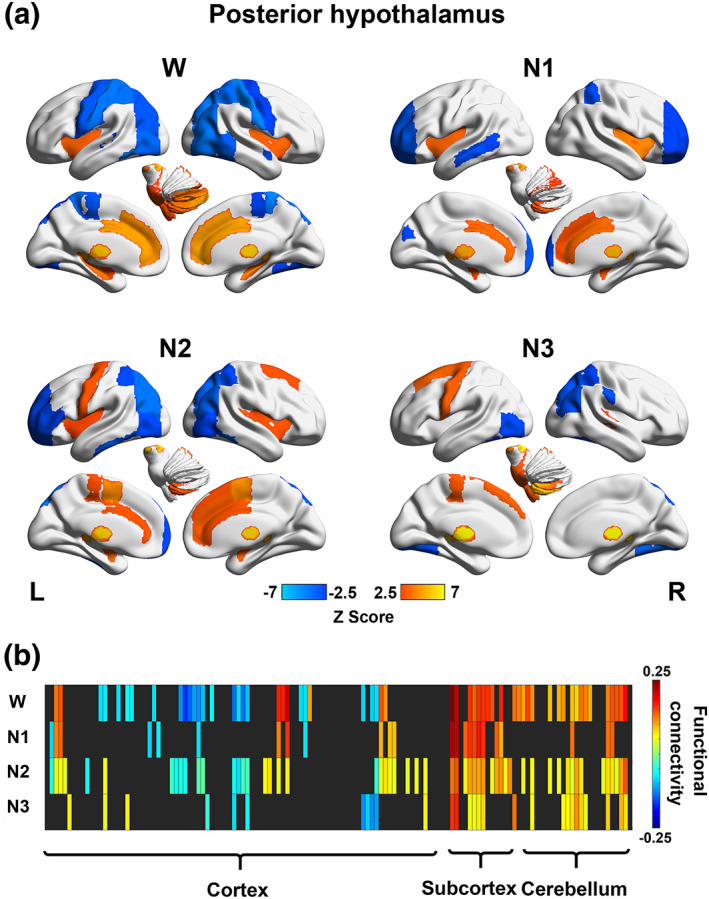
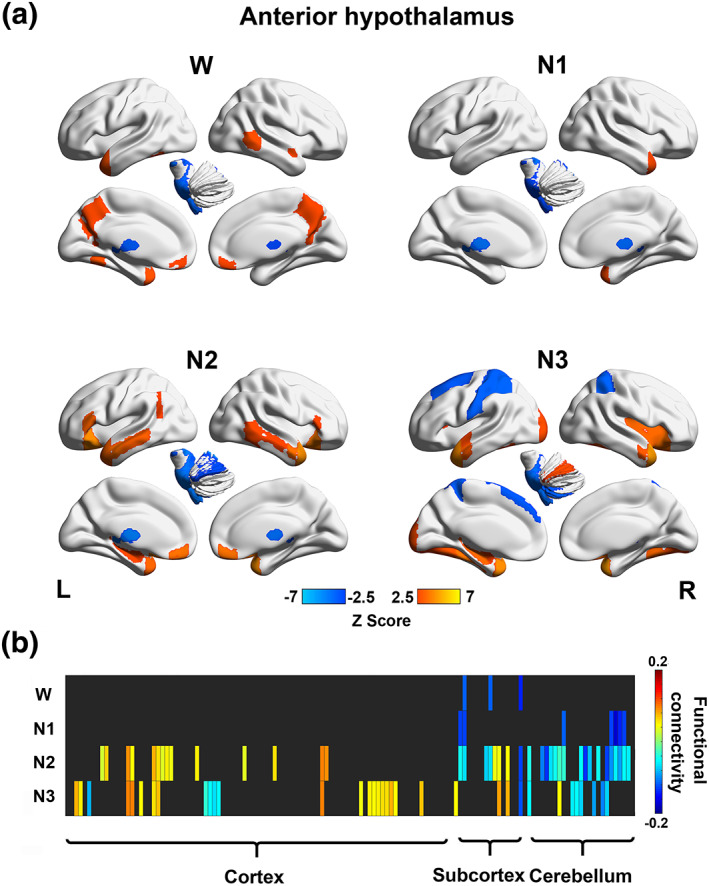
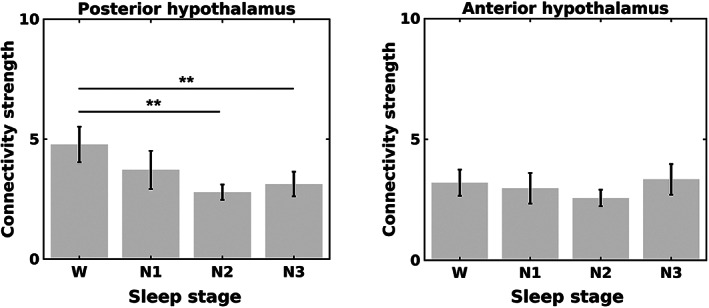
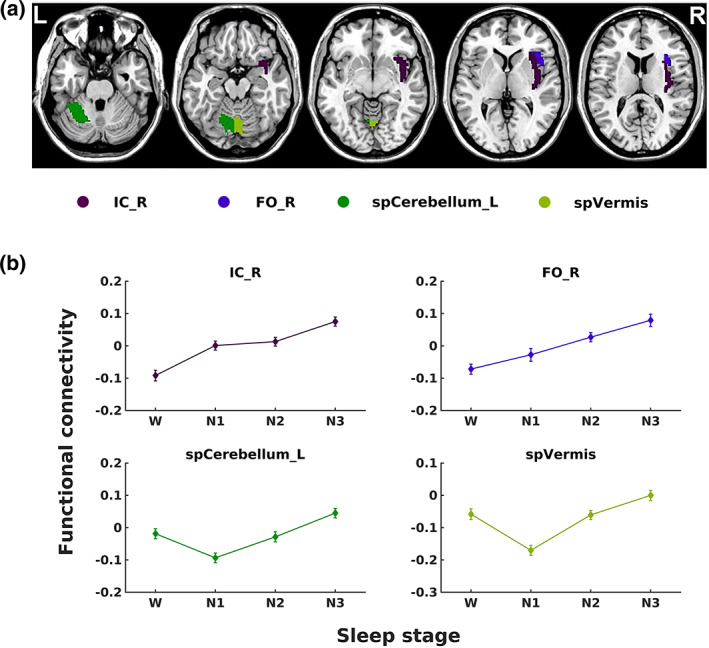
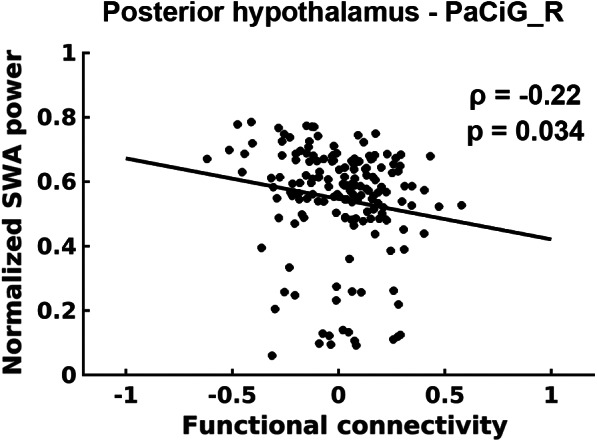
Animal experiments indicate that the hypothalamus plays an essential role in regulating the sleep-wake cycle. A recent neuroimaging study conducted under resting wakefulness conditions suggested the presence of a wake-promoting region and a sleep-promoting region in the human posterior hypothalamus and anterior hypothalamus, respectively, and interpreted their anticorrelated organization in resting-state functional networks as evidence for their opposing roles in sleep-wake regulation. However, whether and how the functional networks of the two hypothalamic regions reorganize according to their wake- or sleep-promoting roles during sleep are unclear. Here, we constructed functional networks of the posterior and anterior hypothalamus during wakefulness and nonrapid eye movement (NREM) sleep using simultaneous electroencephalography and functional magnetic resonance imaging data collected from 62 healthy participants. The functional networks of the posterior and anterior hypothalamus exhibited inversely correlated organizations during both wakefulness and NREM sleep. The connectivity strength of the posterior hypothalamic functional network was stronger during wakefulness than during stable sleep. From wakefulness to sleep, the anterior cingulate gyrus, paracingulate gyrus, insular cortex, and fontal operculum cortex showed decreased positive connectivity, while the precentral gyrus and postcentral gyrus showed decreased negative connectivity with the posterior hypothalamus. Additionally, the insular cortex and frontal operculum cortex showed negative connectivity during wakefulness and positive connectivity during sleep with the anterior hypothalamus, exhibiting an increasing trend. These findings provide insights into the correspondence between the functional network organizations and hypothalamic sleep-wake regulation in humans.

Keywords: functional connectivity; hypothalamus; sleep-wake regulation; tuberomammillary nucleus; ventrolateral preoptic nucleus.


Conflict of interest statement

The authors declare no conflict of interest.

Figures

FIGURE 1
FIGURE 1
Locations of hypothalamic seed regions of interest (ROIs) and functional connectivity between the two hypothalamic regions across the sleep‐wake cycle. (a) Coronal, sagittal, and axial views of hypothalamic seed ROIs in the posterior hypothalamus (left panel, red, X = −5.5, Y = −7.9, Z = −12.1) and anterior hypothalamus (right panel, blue, X = −4.5, Y = 1.6, Z = −13.8). (b) Functional connectivity (average Fisher‐z scores) between the two hypothalamic seed ROIs during wakefulness (W), N1, N2, and N3. The functional connectivity was determined by calculating the partial correlation coefficients (converted to Fisher‐z scores) between the blood oxygen level‐dependent (BOLD) signals extracted from the two hypothalamic seed ROIs. The error bars represent SEs. *p < .05, **p < .01, and ***p < .001
FIGURE 2
FIGURE 2
Stage‐dependent functional network maps and matrix (showing connectivity between the posterior hypothalamus and 132 brain regions) during wakefulness (W), N1, N2, and N3 for the posterior hypothalamus. (a) Functional network maps (statistical Z scores) constructed during each stage with a threshold |Z score| > 2.5. (b) Functional connectivity matrix showing significant connections (with a threshold FDR‐corrected p < .05) during wakefulness (W) and sleep (N1, N2, and N3). Nonsignificant correlations were left black. Brain regions 1–132 according to the number in the atlas included in the Conn toolbox were arranged from left to right
FIGURE 3
FIGURE 3
Stage‐dependent functional network maps (showing connectivity between the posterior hypothalamus and 132 brain regions) and matrix during wakefulness (W), N1, N2, and N3 for the anterior hypothalamus. (a) Functional network maps (statistical Z scores) constructed during each stage with a threshold |Z score| > 2.5. (b) Functional connectivity matrix showing significant connections (with a threshold FDR‐corrected p < .05) during wakefulness (W) and sleep (N1, N2, and N3). Nonsignificant correlations were left black. Brain regions 1–132 according to the number in the atlas included in the Conn toolbox were arranged from left to right
FIGURE 4
FIGURE 4
Connectivity strength of the posterior hypothalamus (left panel) and anterior hypothalamus (right panel) during wakefulness (W) and nonrapid eye movement (NREM) sleep (N1, N2, and N3). The connectivity strength was calculated based on a threshold Bonferroni‐corrected p < .00001. The error bars represent SEs. *p < .05, **p < .01, and ***p < .001
FIGURE 5
FIGURE 5
The locations and functional connectivity of the brain regions show a significant effect of the stage on posterior hypothalamic connectivity. (a) Axial views (Z = ‐7, 3, 13, 23 and 33, from left to right) of the brain regions displaying the main effect of the stage presented in Table 1. (b) Functional connectivity (average Fisher‐z scores) between the eight brain regions shown in (a) (L, left; R, right) and the posterior hypothalamus. The error bars represent SEs
FIGURE 6
FIGURE 6
The locations and functional connectivity of the brain regions show a significant effect of the stage on anterior hypothalamic connectivity. (a) Axial views (Z = ‐27, ‐17, ‐7, 3 and 13, from left to right) of the brain regions displaying a main effect of the stage presented in Table 2. (b) Functional connectivity (average Fisher‐z scores) between the four brain regions shown in (a) (L, left; R, right) and anterior hypothalamus. The error bars represent SEs
FIGURE 7
FIGURE 7
Relationship between the normalized SWA power and functional connectivity (average Fisher‐z scores) of the posterior hypothalamus with the right paracingulate gyrus during N3 sleep

Similar articles

Cited by

References

    1. Allen, P. J. , Josephs, O. , & Turner, R. (2000). A method for removing imaging artifact from continuous EEG recorded during functional MRI. NeuroImage, 12, 230–239. - PubMed
    1. Allen, P. J. , Polizzi, G. , Krakow, K. , Fish, D. R. , & Lemieux, L. (1998). Identification of EEG events in the MR scanner: The problem of pulse artifact and a method for its subtraction. NeuroImage, 8, 229–239. - PubMed
    1. Aston‐Jones, G. , & Bloom, F. E. (1981). Activity of norepinephrine‐containing locus coeruleus neurons in behaving rats anticipates fluctuations in the sleep‐waking cycle. The Journal of Neuroscience, 1, 876–886. - PMC - PubMed
    1. Baroncini, M. , Jissendi, P. , Balland, E. , Besson, P. , Pruvo, J. P. , Francke, J. P. , … Prevot, V. (2012). MRI atlas of the human hypothalamus. NeuroImage, 59, 168–180. - PubMed
    1. Birn, R. M. , Molloy, E. K. , Patriat, R. , Parker, T. , Meier, T. B. , Kirk, G. R. , … Prabhakaran, V. (2013). The effect of scan length on the reliability of resting‐state fMRI connectivity estimates. NeuroImage, 83, 550–558. - PMC - PubMed

Publication types

LinkOut - more resources