. 2021 Jul 5;218(7):e20202699.
doi: 10.1084/jem.20202699. Epub 2021 May 7.

CD1a selectively captures endogenous cellular lipids that broadly block T cell response

Affiliations

CD1a selectively captures endogenous cellular lipids that broadly block T cell response

Rachel N Cotton et al. J Exp Med. .

Abstract

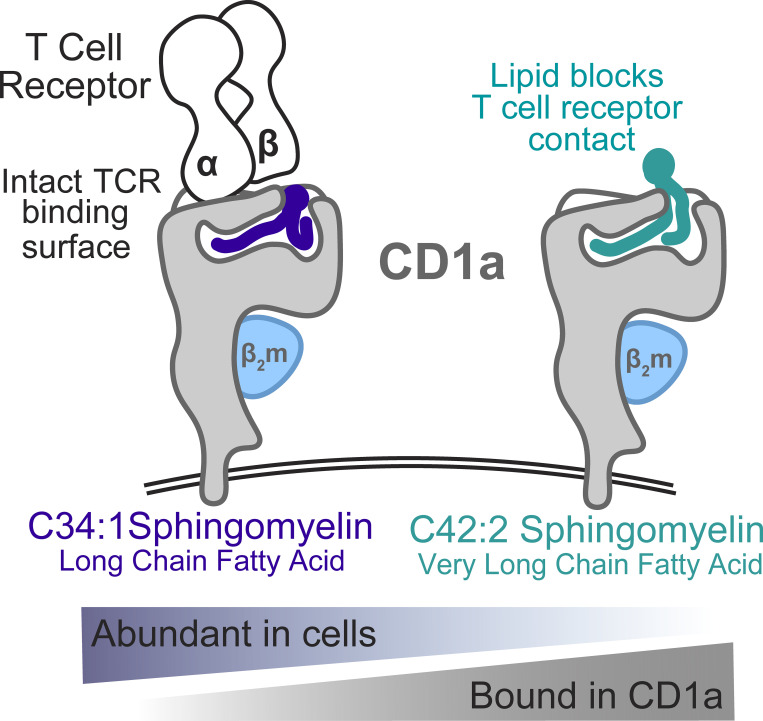
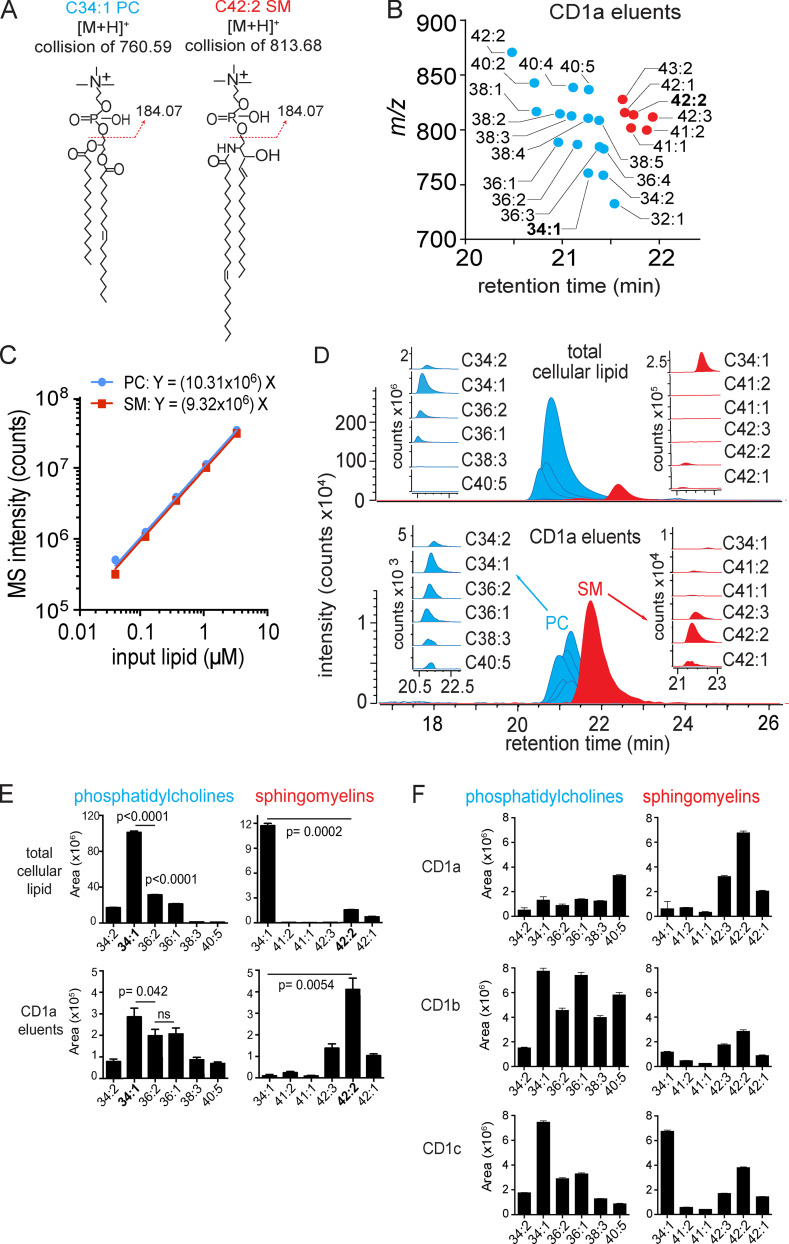
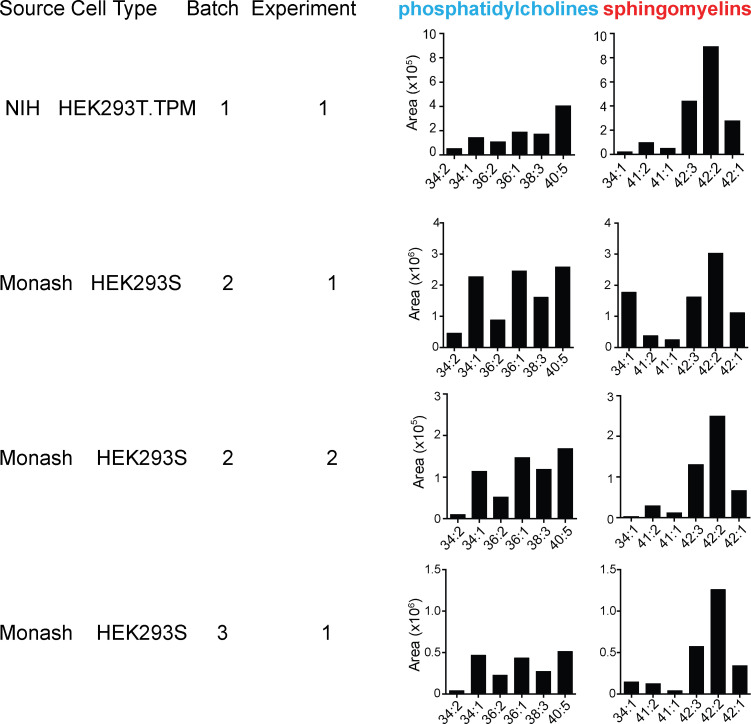
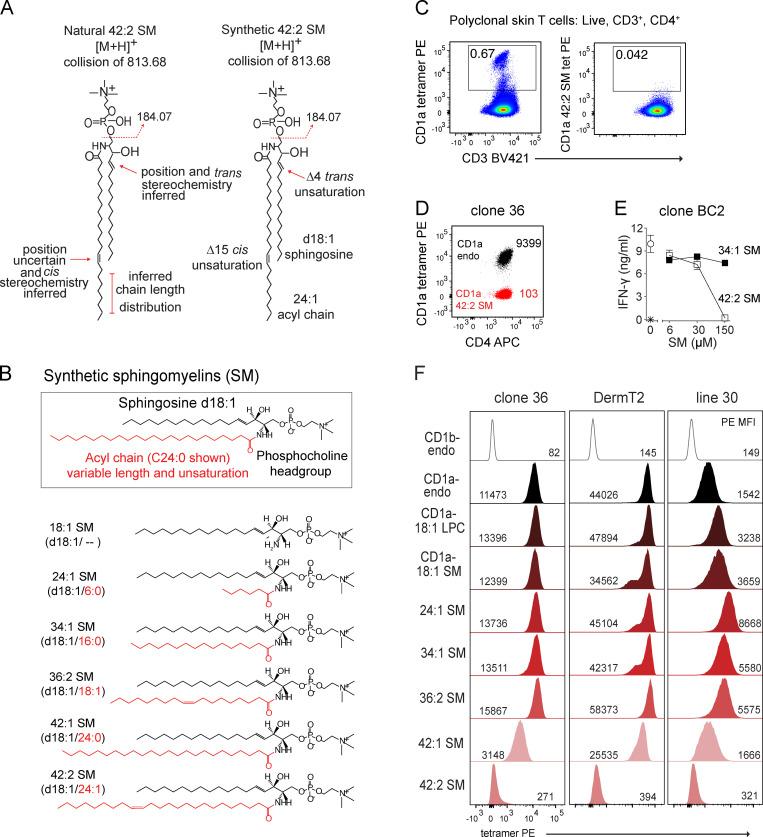
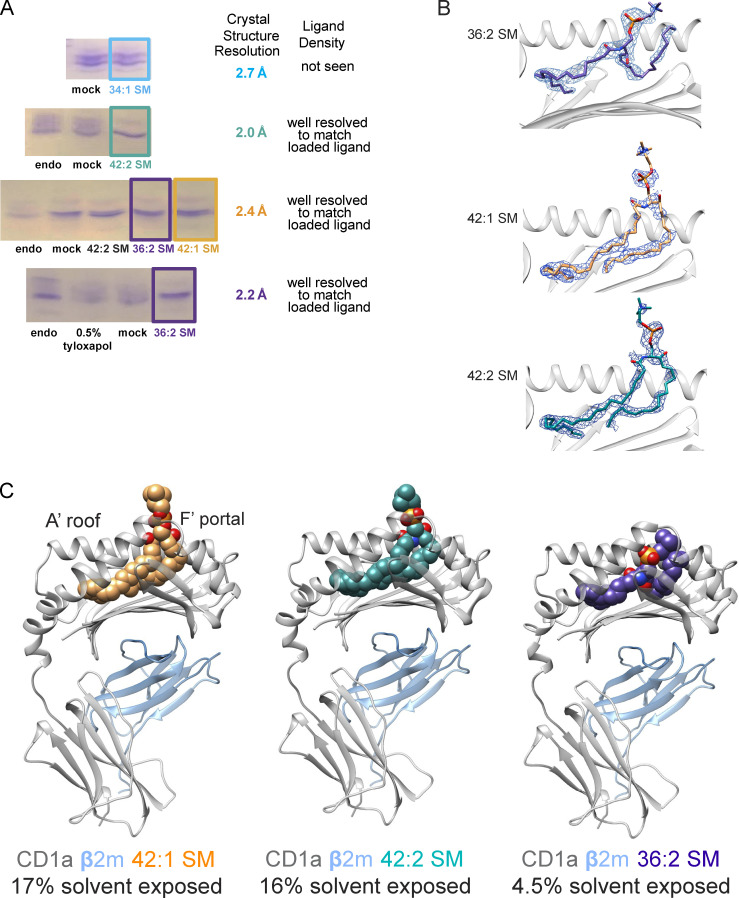
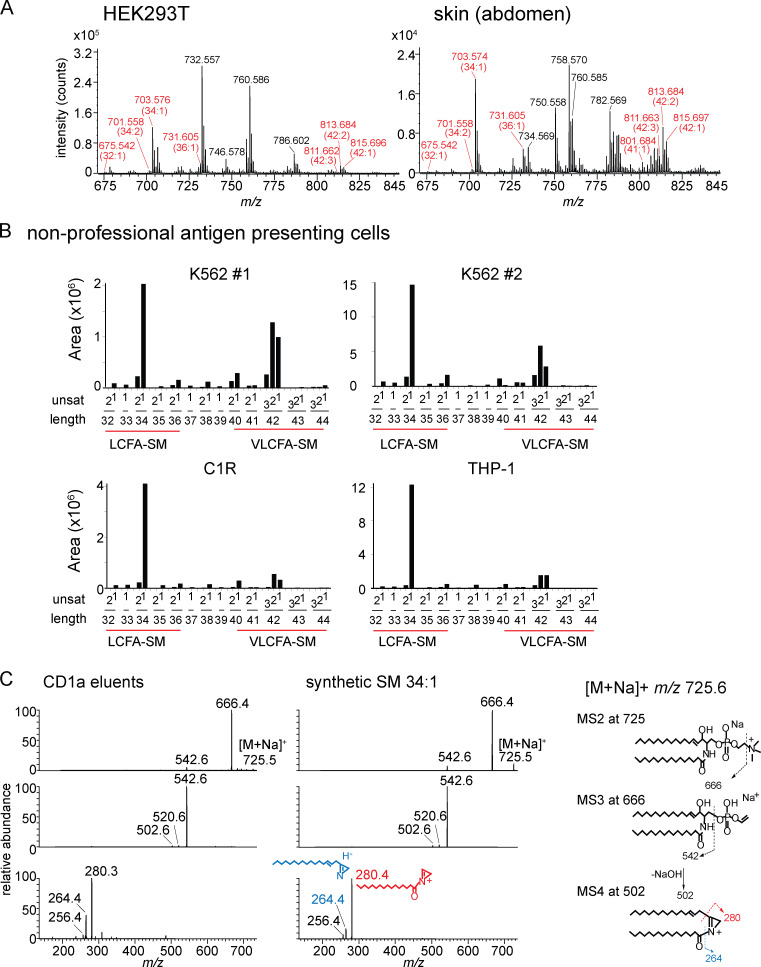
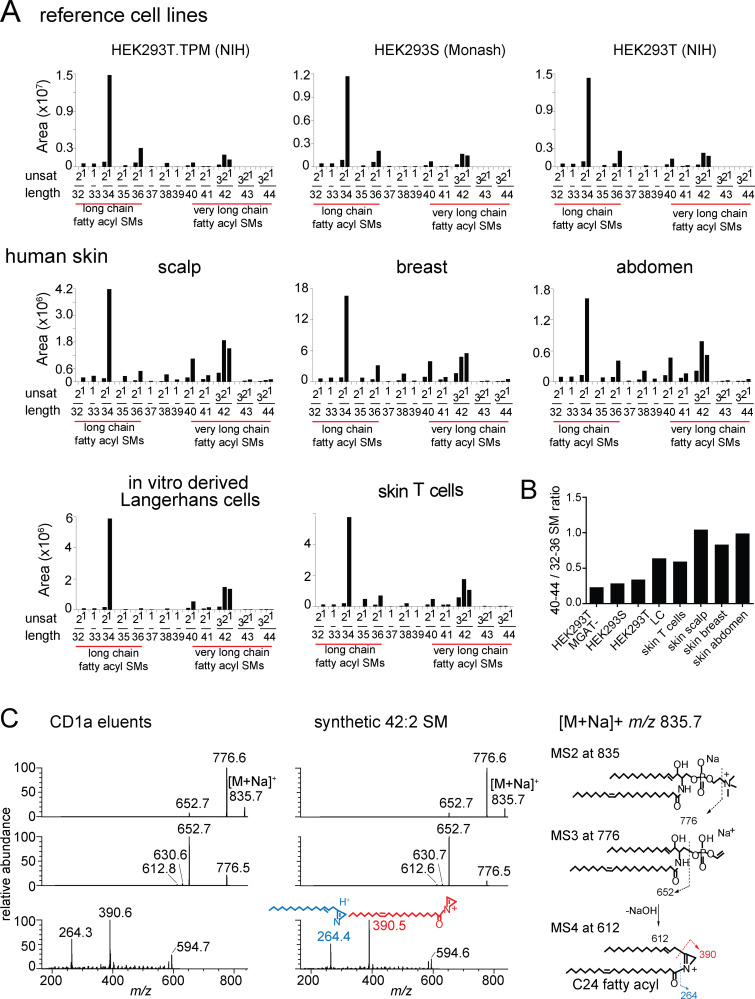
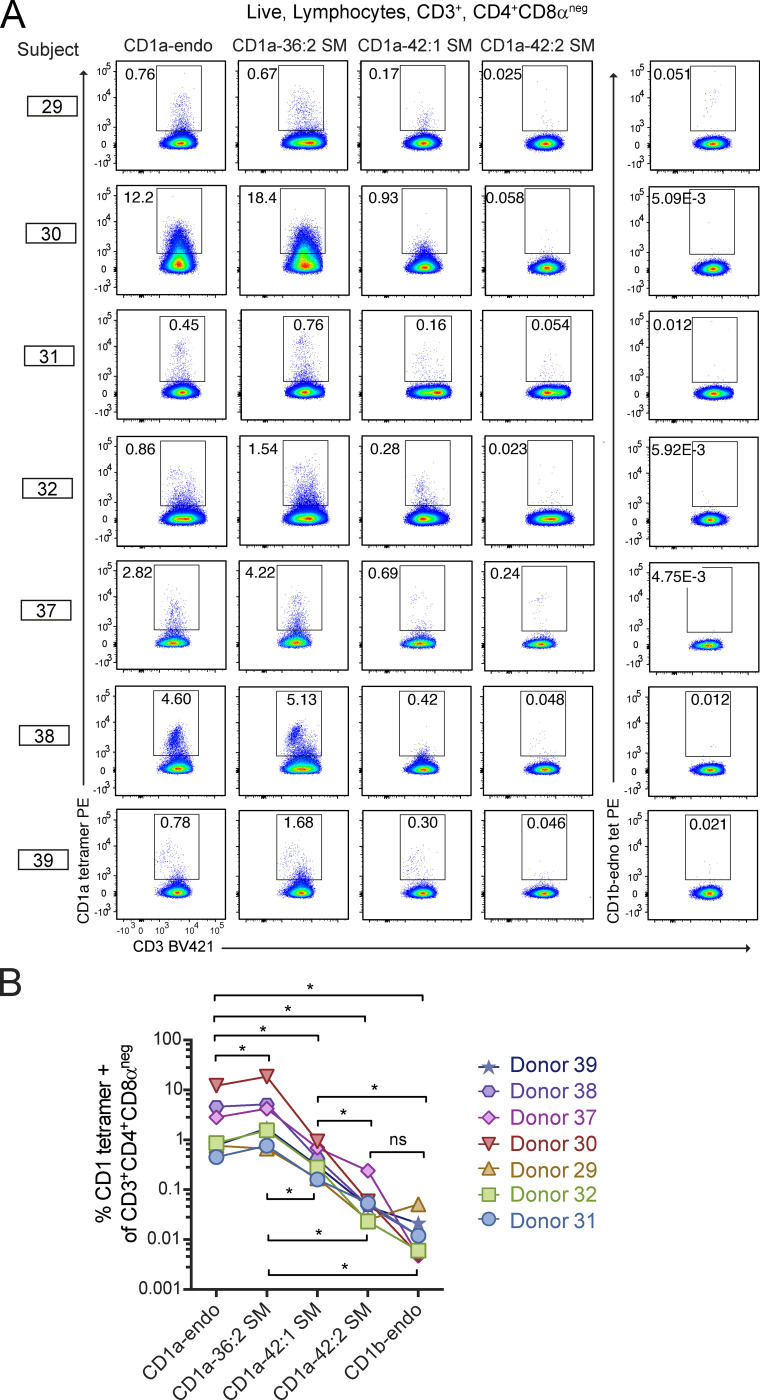
We optimized lipidomics methods to broadly detect endogenous lipids bound to cellular CD1a proteins. Whereas membrane phospholipids dominate in cells, CD1a preferentially captured sphingolipids, especially a C42, doubly unsaturated sphingomyelin (42:2 SM). The natural 42:2 SM but not the more common 34:1 SM blocked CD1a tetramer binding to T cells in all human subjects tested. Thus, cellular CD1a selectively captures a particular endogenous lipid that broadly blocks its binding to TCRs. Crystal structures show that the short cellular SMs stabilized a triad of surface residues to remain flush with CD1a, but the longer lipids forced the phosphocholine group to ride above the display platform to hinder TCR approach. Whereas nearly all models emphasize antigen-mediated T cell activation, we propose that the CD1a system has intrinsic autoreactivity and is negatively regulated by natural endogenous inhibitors selectively bound in its cleft. Further, the detailed chemical structures of natural blockers could guide future design of therapeutic blockers of CD1a response.


Conflict of interest statement

Disclosures: R.N. Cotton reported personal fees from MPM Capital outside the submitted work. G. Ogg reported grants from UCB outside the submitted work. No other disclosures were reported.

Figures

None
Graphical abstract
Figure 1.
Figure 1.
Targeted HPLC-MS analysis of CD1 monomer eluents and cellular lipids. (A) Collision-induced dissociation–MS analysis for CD1a ligands matching the expected m/z of 34:1 PC and 42:2 SM identified the phosphocholine groups, allowing assignment of the overall length and unsaturation states of the alkyl chains. The position and Z or E stereochemistry are inferred from known lipid structures but cannot be established by MS. (B) Chain length and saturation variants identified within the same lipid class have equivalent RTs that match those of SM and PC standards. The m/z values allowed deduction of the combined chain length of the acyl chain and sphingosine units that vary by an integer number of methylene units (X) or unsaturations (Y), shown as X:Y. We identified 16 molecular variants of PC (blue points) and six SMs (red points), which were seen in two datasets analyzed. (C) Response factors for SM and PC were highly similar and nearly linear based on MS intensity measured as a function of the mass input for two synthetic standards, 34:1 PC AND 42:2 SM. (D) Mass chromatograms of the six most abundant PC and SM family members eluted from the CD1a monomer (bottom) and in the total lipid extract from matched CD1a-producing HEK293T.TPM cells (top). (E) PCs and SMs quantified as integrated area under the curve (counts) for each lipid chain variant detected in triplicate (± SEM) at a diagnostic m/z value and RT window. P values were calculated using Welch’s corrected t test. (F) PCs and SMs, eluted from CD1a, CD1b, and CD1c protein monomers, quantified as integrated area under the curve for each lipid chain variant detected in triplicate at a diagnostic m/z value and RT window. Error bars indicate SD from the mean. For D and E, results are representative of three experiments, and for F, results are representative of more than three experiments with interexperimental replication shown in Fig. S1. [M+H]+, mass of the molecular ion plus a proton adduct.
Figure S1.
Figure S1.
Detailed SM profiles from HEK293 cells. CD1a proteins generated in HEK293S or HEK293T.TPM cells were treated with chloroform and methanol, with eluents subject to analysis by positive ion mode HPLC-MS, where the combined length (X) and unsaturations (Y), shown as X:Y, were deduced based on the detected m/z values of natural SMs nearly coeluting with an SM standard. CD1a constructs and proteins were generated at the NIH tetramer facility or at Monash University (Monash).
Figure 2.
Figure 2.
Lipid chain length and unsaturation determine CD1a tetramer binding. (A) CD1a-eluted natural versus synthetic 42:2 SMs are shown with regard to known or inferred aspects of structure. (B) Synthetic SM variants differ in the length and saturation of the fatty acyl unit (red). (C) Polyclonal skin T cells stained with CD1a tetramer (tet) or tetramer treated with 42:2 SM, showing results that are representative of two experiments. (D) CD1a autoreactive skin T cell clone 36 staining with CD1a-endo or CD1a–42:2 SM, with results shown being representative of three experiments. Insets indicate tetramer MFI. (E) IFN-γ ELISA of clone BC2 T cells (star indicates T cells only) exposed to plate-bound CD1a treated with the synthetic SM, with results representative of two experiments. (F) CD1a–SM tetramer staining of skin T cell lines DermT2, Line 30, and Line 36. Cells were pregated (live, CD3+, CD4+ Autofluoresence[FITC]neg), and histograms were normalized to mode. [M+H], mass of the molecular ion plus a proton adduct.
Figure 3.
Figure 3.
Loading and structural elucidation of CD1a–SM complexes with altered fatty acyl chain length. (A) Deglycosylated CD1a carrying HEK293T cell–derived lipids (endo) was treated with CHAPS detergent (mock) or different species of SM and resolved on isoelectric focusing gels. In case of 36:2 SM, endogenous lipids were “washed out” using 0.5% tyloxapol before SM loading. Results are typical for two or more experiments. (B) 2Fo-Fc electron density maps of the ligands in the cleft are contoured at σ of 0.7 Å. (C) Overview of the binary structures of CD1a/β2m heterodimer (gray and blue, respectively) bound to 42:1 SM (orange), 42:2 SM (teal), or 36:2 SM (purple).
Figure 4.
Figure 4.
Remodeling of the CD1a cleft and surface with short- and long-chain SMs. (A) Side view of CD1a–42:2 SM shows the acyl and sphingosine chains lying parallel in the A′ pocket, where the fatty acyl unit encircles an internal structure known as the A′ pole (Moody et al., 2005) formed by F70 and V12, with the position of the unsaturation in the 42:2 SM shown with a cyan arrow. W14 at the bottom of the A′ pocket floor is flipped toward the F′ pocket. (B) In contrast, 36:2 SM is seated 7 Å lower within the CD1a cleft, and its two chains are oriented antiparallel. W14 is bent toward the A′ pocket so that it lies between the acyl chain in the A′ pocket and the sphingosine chain in the F′ pocket. Unlike CD1a–42:2 SM, R76 and R73 stabilize the phosphate group to bend the SM back toward the cleft. The hydrogen bonds and electrostatic interactions are marked with a dashed line. (C) Superimposed top-down views of the CD1a roof for CD1a–42:1 SM and CD1a–42:2 SM complexes, indicating positioning of CD1a F′ portal adjacent residues R73, R76, and E154, in which R76 and the SM head group orient vertically to protrude above the CD1a platform for CD1–42:2 SM. (D) For the CD1a–36:2 SM complex, R76 and the phosphate in the choline group of SM are positioned near the plane of the CD1a platform.
Figure S2.
Figure S2.
Total lipid extracts from the indicated sources were analyzed by HPLC-MS in the positive ion mode. (A and B) SM ion (red) intensity values were matched to the deduced SM variant (A), where the overall chain length (CH2 units) and unsaturations present in both chains are indicated in (B). (C) MS/MS/MS of 34:1 SM from CD1a eluents and an authentic standard detected ion corresponding to the alkyl chains present in the sphingosine base (blue) and the fatty acyl unit (red), allowing assignment of a C16 fatty acid (m/z 280.4) as the predominant species. Thus, most chain-length variations in SMs are accounted for by the fatty acyl unit. Unsat, number of unsaturations in both chains.
Figure 5.
Figure 5.
Length distribution of SMs in cells and skin. (A) Mass spectra of lipids (shown in Fig. S2) derived from HEK293 cells and human skin are shown as MS intensity values for each of 30 possible chain length and saturation variants of SM, where length is the number of methylene units in the fatty acyl and sphingosine chains, and unsat is the number of unsaturations in both chains. (B) The 42/34 ratio is calculated based on the sum of intensity values of C42 SMs divided by the sum of intensity values of C34 SMs for each cell or tissue. Because C42 SMs are inhibitory and C34 SMs are weakly activating for T cells, higher ratios predict stronger inhibitory functions of SM profiles. (A and B) Results are representative of two experiments. (C) Collision-induced dissociation of natural 42:2 SM from HEK293T identified the neutral loss of the choline head group and, through chain cleavage products, the length of the sphingosine as predominantly C24:1 (m/z 390.5) acyl chain and C18:1 sphingosine chain in the synthetic standard and CD1a-eluted molecule. Similar analysis of the 34:2 SM demonstrated a C18 sphingosine chain and a C16 fatty acyl unit (Fig. S2). Thus, chain length variation is determined mainly or exclusively in the fatty acyl unit, so that 42 SMs are formed from VLCFAs and 34 SMs and 36 SMs are made from LCFAs. The position and Z or E stereochemistry are inferred from known lipid structures but cannot be established by MS.
Figure 6.
Figure 6.
CD1aSM tetramer staining of polyclonal skin T cells. (A and B) Polyclonal T cells from seven donors were stained with CD1a or CD1b tetramers treated with the indicated lipids and shown as flow cytometry plots (A) and as summary data and statistics (B). Individual patients were tested on different days using the same method. *, P < 0.05; Wilcoxon matched-pairs signed rank test.

Comment in

References

    1. Afonine, P.V., Grosse-Kunstleve R.W., Echols N., Headd J.J., Moriarty N.W., Mustyakimov M., Terwilliger T.C., Urzhumtsev A., Zwart P.H., and Adams P.D.. 2012. Towards automated crystallographic structure refinement with phenix.refine. Acta Crystallogr. D Biol. Crystallogr. 68:352–367. 10.1107/S0907444912001308 - DOI - PMC - PubMed
    1. Birkinshaw, R.W., Pellicci D.G., Cheng T.Y., Keller A.N., Sandoval-Romero M., Gras S., de Jong A., Uldrich A.P., Moody D.B., Godfrey D.I., and Rossjohn J.. 2015. αβ T cell antigen receptor recognition of CD1a presenting self lipid ligands. Nat. Immunol. 16:258–266. 10.1038/ni.3098 - DOI - PMC - PubMed
    1. Bligh, E.G., and Dyer W.J.. 1959. A rapid method of total lipid extraction and purification. Can. J. Biochem. Physiol. 37:911–917. 10.1139/o59-099 - DOI - PubMed
    1. Borg, N.A., Wun K.S., Kjer-Nielsen L., Wilce M.C., Pellicci D.G., Koh R., Besra G.S., Bharadwaj M., Godfrey D.I., McCluskey J., and Rossjohn J.. 2007. CD1d-lipid-antigen recognition by the semi-invariant NKT T-cell receptor. Nature. 448:44–49. 10.1038/nature05907 - DOI - PubMed
    1. Bourgeois, E.A., Subramaniam S., Cheng T.Y., De Jong A., Layre E., Ly D., Salimi M., Legaspi A., Modlin R.L., Salio M., et al. 2015. Bee venom processes human skin lipids for presentation by CD1a. J. Exp. Med. 212:149–163. 10.1084/jem.20141505 - DOI - PMC - PubMed

Publication types