. 2021 May 1;134(9):1-17.
doi: 10.1242/jcs.254763. Epub 2021 May 7.

Luminescence lifetime imaging of three-dimensional biological objects

Affiliations

Luminescence lifetime imaging of three-dimensional biological objects

Ruslan I Dmitriev et al. J Cell Sci. .

Abstract

A major focus of current biological studies is to fill the knowledge gaps between cell, tissue and organism scales. To this end, a wide array of contemporary optical analytical tools enable multiparameter quantitative imaging of live and fixed cells, three-dimensional (3D) systems, tissues, organs and organisms in the context of their complex spatiotemporal biological and molecular features. In particular, the modalities of luminescence lifetime imaging, comprising fluorescence lifetime imaging (FLI) and phosphorescence lifetime imaging microscopy (PLIM), in synergy with Förster resonance energy transfer (FRET) assays, provide a wealth of information. On the application side, the luminescence lifetime of endogenous molecules inside cells and tissues, overexpressed fluorescent protein fusion biosensor constructs or probes delivered externally provide molecular insights at multiple scales into protein-protein interaction networks, cellular metabolism, dynamics of molecular oxygen and hypoxia, physiologically important ions, and other physical and physiological parameters. Luminescence lifetime imaging offers a unique window into the physiological and structural environment of cells and tissues, enabling a new level of functional and molecular analysis in addition to providing 3D spatially resolved and longitudinal measurements that can range from microscopic to macroscopic scale. We provide an overview of luminescence lifetime imaging and summarize key biological applications from cells and tissues to organisms.

Keywords: Fluorescence lifetime; Imaging; Three dimensional.


Conflict of interest statement

Competing interests The authors declare no competing or financial interests.

Figures

Fig. 1.
Fig. 1.
Brief introduction into FLIM, FRET and PLIM. (A) Interaction of luminescent molecules with light results in fluorescence or phosphorescence (top panel), measured either in spectral intensity (left middle panel) or decay times (also known as ‘lifetimes’, Tau; right middle panel). In turn, luminescence lifetime can be measured using FLIM (nanoseconds) or PLIM (microseconds) (right middle panel). Importantly, the same molecule can change its lifetime, as shown by decay fitting, due to quenching and other interactions, which can be used in biosensing (bottom panel). In the top panel, S0 indicates singlet ground state, S1 indicates singlet excited state and T1 indicates triplet excited state. ISC, intersystem crossing. (B) Examples of sensing methodologies employed in FLIM and PLIM with illustration of the effects of the presence of quencher (top; e.g. molecular oxygen in PLIM), reversible changes in molecular structure of the fluorophore (middle; e.g. pH sensing by FLIM) and ligand binding by the FLIM–FRET biosensor (bottom). A, acceptor; D, donor; L, ligand; Q, quencher.
Fig.
2.
Fig. 2.
FLIM and PLIM in 3D imaging of live organoids and tissues. (A) Schematic representation of a 3D tissue imaged using FLIM or PLIM and available biosensor probe types. (B) Two-photon excited 3D FLIM enables the visualization of proliferating (blue, crypts) and non-proliferating (green, differentiated villi regions) cells in live mouse intestinal organoids, using staining with Hoechst 33342 and BrdU pulsing. (C) Dynamic intravital 4D FRET–FLIM in the brain stem of CerT L15 mice, perfused with 100 mM KCl at the indicated time, shows the depolarization of neurons followed by a Ca2+ increase. Colormap (0–70%) demonstrates FRET efficiency, which is proportional to the Ca2+ increase. Numbers 1–3 indicate separate neurons with different kinetics of response. Box highlights neurons undergoing changes. Thus, the dynamics of Ca2+ changes in live brain is measured both at the level of frequency and quantitatively. Images reproduced from Rinnenthal et al. (2013), where they were published under a CC-BY license. (D) Use of FLIM in a lifetime-domain multiplexing experiment (‘Tau contrast imaging’). FLIM (single excitation with 488 nm laser) improves the contrast of live intestinal organoids that are co-stained with two dyes emitting in the same spectral window: SYTO 24 (longer lifetimes, more orange color) and cholera toxin-labeled Alexa Fluor 488 (shorter lifetimes, blue-green colors). This helps to visualize functionally different cell types. Inset shows magnified region of the organoid. The images shown in B and D were prepared in the Dmitriev laboratory, as described in Okkelman et al. (2020c).
Fig. 3.
Fig. 3.
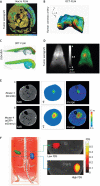
3D FLI and FRET using macroscopy-based approaches. (A) Fluorescence time-resolved macro-imaging of NAD(P)H autofluorescence in a tumor xenograft to assess metabolic heterogeneity at macroscale. The white dashed line marks the tumor border, and the two red boxes indicate two regions with different τm values, inside and outside the tumor; τm indicates amplitude weighted fluorescence lifetime. Scale bar: 2 mm. Image adapted with permission from Shcheslavskiy et al. (2018), ©The Optical Society. (B) OCT volume imaging superimposed with a FLIM map of the human coronary artery. Post mortem human coronary artery was subjected to immunofluorescence using anti-LOX-1 receptors tagged with Alexa Fluor 532-labeled secondary antibodies. LOX-1 receptors are found predominantly in the endothelial cells of the intima and are involved, upon binding to oxidized low-density lipoproteins, in the formation of lipid-rich foam cells on the artery. Image adapted with permission from Shrestha et al. (2016), ©The Optical Society. (C) OPT-rendered 3D images of zebrafish overexpressing a caspase-3 FRET biosensor and controlled by the ubiquitin promoter [Tg(Ubi:Caspase3bios)], following 25 Gy gamma irradiation to induce localized apoptosis. Top: whole OPT–FLIM data set, showing intensity merged false-color lifetime. Bottom: whole OPT–FLIM data set, showing false-color lifetime, without intensity merging, to highlight the short lifetime contribution of the yolk. Image reproduced from Andrews et al. (2016), where it was published under a CC-BY license. (D) Tomography of cancer cells expressing a NIR-fluorescent protein (iRFP720) injected into the brain to allow deep-tissue imaging. Left: planar transmission fluorescence showing autofluorescence and iRFP720 intensity levels (A.U., arbitrary units). Right: fluorescence decay amplitude images to discriminate iRFP720 lifetime (red) from tissue autofluorescence lifetime (green). Whole-body imaging of deep-seated organs is achieved by combining iRFP720 cell labeling with fluorescence lifetime contrast. Image reprinted from Rice et al. (2015) with permission from AACR. (E) Cross-sections from tomographic reconstructions of magnetic resonance imaging (MRI) and eGFP donor fluorescence lifetime from imaging of the hind legs in two live transfected mice. Panel (a) corresponds to a leg containing muscles expressing the FRET construct, GCLink, whilst panel (b) displays the non-FRETing control co-expressing eGFP and mCherry separately. Left, MRI; middle, reconstructed lifetime distribution (τ); right, merged images. Dashed lines show that both mice are imaged from same perspective in MRI and fluorescence lifetime imaging. Image adapted with permission from McGinty et al. (2011), ©The Optical Society. (F) Tomographic estimate of fluorescence lifetime NIR inter-molecular FRET levels in a mouse model. Shown here are a 3D rendering of the CT images (left) and quantitative comparison of FRETing donor fraction (right) from capillary tubes implanted in the abdomen with low (green) FRET and high (blue) FRET signals (FD%, FRET donor fraction indicating FRET donors involved in FRET events.). An antibody–antigen pair, Alexa Fluor 700-labeled mouse IgG1 and Alexa Fluor 750-labeled goat anti-mouse IgG, was used to measure specific intermolecular interactions as detected by NIR FRET MFLI tomography. Images in F were generated as described in Venugopal et al. (2012), with permission from the authors.

Similar articles

Cited by

References

    1. Abdollahi, E., Taucher-Scholz, G. and Jakob, B. (2018). Application of fluorescence lifetime imaging microscopy of DNA binding dyes to assess radiation-induced chromatin compaction changes. Int. J. Mol. Sci. 19, 2399. 10.3390/ijms19082399 - DOI - PMC - PubMed
    1. Abe, K., Zhao, L., Periasamy, A., Intes, X. and Barroso, M. (2013). Non-invasive in vivo imaging of near infrared-labeled transferrin in breast cancer cells and tumors using fluorescence lifetime FRET. PLoS ONE 8, e80269. 10.1371/journal.pone.0080269 - DOI - PMC - PubMed
    1. Ahmed, S., Chauhan, V. M., Ghaemmaghami, A. M. and Aylott, J. W. (2019). New generation of bioreactors that advance extracellular matrix modelling and tissue engineering. Biotechnol. Lett. 41, 1-25. 10.1007/s10529-018-2611-7 - DOI - PMC - PubMed
    1. Alam, S. R., Wallrabe, H., Svindrych, Z., Chaudhary, A. K., Christopher, K. G., Chandra, D. and Periasamy, A. (2017). Investigation of mitochondrial metabolic response to doxorubicin in prostate cancer cells: an Nadh, FAD and tryptophan FLIM assay. Sci. Rep. 7, 1-10. - PMC - PubMed
    1. Alexander, S., Weigelin, B., Winkler, F. and Friedl, P. (2013). Preclinical intravital microscopy of the tumour-stroma interface: invasion, metastasis, and therapy response. Curr. Opin. Cell Biol. 25, 659-671. 10.1016/j.ceb.2013.07.001 - DOI - PubMed

Publication types

LinkOut - more resources