Asymptomatic COVID-19: disease tolerance with efficient anti-viral immunity against SARS-CoV-2
- PMID: 33961735
- PMCID: PMC8185544
- DOI: 10.15252/emmm.202114045
Asymptomatic COVID-19: disease tolerance with efficient anti-viral immunity against SARS-CoV-2
Abstract
The immune responses and mechanisms limiting symptom progression in asymptomatic cases of SARS-CoV-2 infection remain unclear. We comprehensively characterized transcriptomic profiles, cytokine responses, neutralization capacity of antibodies, and cellular immune phenotypes of asymptomatic patients with acute SARS-CoV-2 infection to identify potential protective mechanisms. Compared to symptomatic patients, asymptomatic patients had higher counts of mature neutrophils and lower proportion of CD169+ expressing monocytes in the peripheral blood. Systemic levels of pro-inflammatory cytokines were also lower in asymptomatic patients, accompanied by milder pro-inflammatory gene signatures. Mechanistically, a more robust systemic Th2 cell signature with a higher level of virus-specific Th17 cells and a weaker yet sufficient neutralizing antibody profile against SARS-CoV-2 was observed in asymptomatic patients. In addition, asymptomatic COVID-19 patients had higher systemic levels of growth factors that are associated with cellular repair. Together, the data suggest that asymptomatic patients mount less pro-inflammatory and more protective immune responses against SARS-CoV-2 indicative of disease tolerance. Insights from this study highlight key immune pathways that could serve as therapeutic targets to prevent disease progression in COVID-19.
Keywords: COVID-19; SARS-CoV-2; asymptomatic; disease tolerance.
© 2021 The Authors. Published under the terms of the CC BY 4.0 license.
Conflict of interest statement
The authors declare that they have no conflict of interest.
Figures

RNA‐seq of whole blood from symptomatic (n = 26; median 8 days PIO) and asymptomatic (n = 30; median 3 days post‐hospital admission) COVID‐19 patients at the acute phase of infection (SARS‐CoV‐2 PCR‐positive) was performed. Only samples with RNA integrity number > 6 were sent for sequencing and included in the analysis. Volcano plot indicating DEGs between asymptomatic and symptomatic COVID‐19 patients, with thresholds of FDR < 0.05 and |FC| > 2. Numbers of over‐expressed and under‐expressed genes are indicated.
PCA of symptomatic and asymptomatic COVID‐19 patients based on DEGs, with FDR < 0.05 and |FC| > 2.
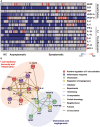
Pie chart showing distribution of the functionally grouped GO terms using ClueGO. Illustrated genes were under‐expressed or over‐expressed in asymptomatic patients compared to symptomatic patients. Each GO term is statistically significant (Benjamini–Hochberg correction < 0.05), with a cutoff set at P < 0.05.

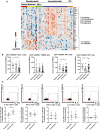
Heatmap of immune mediator levels in plasma samples of healthy controls (HC) (n = 23) and COVID‐19 patients who are asymptomatic (n = 48) or symptomatic (n = 172). First plasma sample from each SARS‐CoV‐2 PCR‐positive patient was extracted for analyses. Each color represents the relative concentration of a particular analyte (blue = low concentration; red=high concentration). Each row represents one patient. Hierarchical clustering was performed on patients in each severity stratum using MeV software.
Network analysis of significant immune mediators between symptomatic and asymptomatic COVID‐19 patients. Interactive relationships between the cytokines or chemokines were determined by STRING (Search Tool for the Retrieval of Interacting Genes/Proteins) analysis, with a confidence threshold of 0.5.

- A–C
(A) Growth factors, (B) T cell‐associated immune mediators, and (C) inflammatory macrophage‐associated cytokine levels in plasma samples of COVID‐19 patients who are asymptomatic (n = 48) or exhibit mild (n = 61), moderate (n = 43), or severe (n = 68) symptoms. Immune mediators were measured in the first plasma sample collected from each SARS‐CoV‐2 PCR‐positive patient. Immune mediator levels for healthy controls (HC) (n = 23) are indicated by the black dotted line. Patient samples with concentrations out of measurement range are presented as the value of limit of quantification (LOQ). Data are presented as mean ± SD. *P < 0.05; **P < 0.01; and ***P < 0.001 (one‐way ANOVA with post hoc t‐test).

Expressions of genes associated with T‐cell functionality were compared between acute asymptomatic (n = 30) and symptomatic (n = 26) COVID‐19 patients. Heatmap of DEGs with FDR‐adjusted P < 0.05, scaled based on log2RPKM values, with blue and red colors indicating low and high expressions, respectively.
Mass cytometry was performed on PBMCs obtained from acute symptomatic (n = 37) and acute asymptomatic (n = 19) COVID‐19 patients and healthy controls (n = 10). Naïve, TEMRA, central memory (CM), and effector memory (EM) T cells were characterized based on CD45RA and CCR7 expressions. Data are presented as mean ± SD. *P < 0.05 and **P < 0.01 (Mann–Whitney U‐test).
SARS‐CoV‐2‐specific CD4+ non‐T follicular helper (TFH) cells from symptomatic (n = 5) and asymptomatic COVID‐19 (n = 5) patients were characterized with flow cytometry based on the expression of IL‐17a, IFN‐γ, TNF‐⍺, IL‐4, and IL‐10 upon SARS‐CoV‐2 peptide stimulation. Representative plot overlay of unstimulated (black) on peptide stimulated (red) was performed on asymptomatic patient. Data are presented as mean ± SD. **P < 0.01 (Mann–Whitney U‐test).

Mass cytometry was performed on PBMCs obtained from acute symptomatic (n = 37) and acute asymptomatic (n = 19) COVID‐19 patients and healthy controls (n = 10). Naïve, TEMRA, central memory (CM), and effector memory (EM) T cells were characterized based on CD45RA and CCR7 expressions. Data are presented as mean ± SD. **P < 0.01 and ***P < 0.001 (Kruskal–Wallis test with Dunn’s multiple comparison).
Representative gating strategy for the characterization of granzyme B expression of CD8+ T cells in isolated PBMCs of COVID‐19 patients by flow cytometry. Representative gating strategy was performed on a symptomatic patient.
Comparison of granzyme B expression in CD8+ T cells from symptomatic (n = 5) and asymptomatic (n = 5) convalescent PBMCs. Data are presented as mean ± SD (Mann–Whitney U‐test).


- A, B
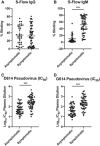
(A) IgG and (B) IgM responses were analyzed by screening plasma samples of asymptomatic (n = 39, median study day 29) and symptomatic (n = 57, median study day 31) COVID‐19 patients. Data are presented as mean ± SD. ***P < 0.001 (Mann–Whitney U‐test).
- C, D
Plasma samples of asymptomatic (median study day 29) and symptomatic (median study day 31) COVID‐19 were assessed for their anti‐SARS‐CoV‐2 neutralization capacity using luciferase expressing lentiviruses pseudotyped with SARS‐CoV‐2 spike (S) protein of either the original strain, D614, or the mutant variant, G614. Log10 neutralization IC50 profiles against (C) D614 and (D) G614 pseudoviruses at 1 month post‐admission (asymptomatic, n = 49; symptomatic, n = 57 (D614) or 55 (G614)). Data are presented as mean ± SD. ***P < 0.001 (Welch’s t‐test).

Flow cytometry acquisition of patient whole blood was performed, and a number of mature and immature neutrophils were compared between asymptomatic (n = 16) and symptomatic (n = 52) COVID‐19 patients and healthy controls (n = 17). Data are presented as mean ± SD. *P < 0.05; **P < 0.01; and ***P < 0.001 (Kruskal–Wallis test with Dunn’s multiple comparison).
Mass cytometry was performed on PBMCs obtained from acute asymptomatic (n = 19) and acute symptomatic (n = 37) COVID‐19 patients and healthy donors (n = 10). Monocytes were characterized based on their CD14 and CD16 expression. Data are presented as mean ± SD. **P < 0.01 and ***P < 0.001 (Kruskal–Wallis test with Dunn’s multiple comparison).
Classical, intermediate, and non‐classical monocytes were further defined in acute asymptomatic (n = 19) and acute symptomatic (n = 37) COVID‐19 patients and healthy donors (n = 10) with inflammatory marker CD169. Data are presented as mean ± SD. **P < 0.01 and ***P < 0.001 (Kruskal–Wallis test with Dunn’s multiple comparison).
Expression data of genes associated with inflammatory monocytes, activated neutrophils, and pro‐inflammatory cytokines were compared between acute asymptomatic (n = 30) and asymptomatic (n = 26) COVID‐19 patients and were represented by ratio with respect to expression in asymptomatic patients. Bar graphs show DEGs with FDR‐adjusted P < 0.05, and fold change values are represented in the log2 scale.
Pro‐inflammatory‐associated immune mediator levels in plasma fraction samples from first collection timepoint during hospital admission were quantified with 45‐plex microbead‐based immunoassay. Immune mediator levels were compared between asymptomatic patients (n = 48) and symptomatic patients stratified by COVID‐19 severity (mild, n = 61; moderate, n = 43; and severe, n = 68). Immune mediator levels for healthy controls (HC) (n = 23) are indicated by the black dotted line. Patient samples with concentrations out of measurement range are presented as the value of limit of quantification (LOQ). Data are presented as mean ± SD. *P < 0.05; **P < 0.01; and ***P < 0.001 (one‐way ANOVA with post hoc t‐test).


Growth factors in the plasma of asymptomatic (n = 48), symptomatic patients (n = 173), and healthy controls (n = 23) were analyzed by Luminex. A ratio of VEGF‐A/VEGF‐D was calculated and used to perform receiver operating characteristics analysis. The area under the curve was shown. Data are presented as mean ± SD. **P < 0.01 and ***P < 0.001 (Kruskal–Wallis test with Dunn’s multiple comparison).
RNA‐seq analysis was performed on whole blood, and selected transcripts that are over‐expressed in asymptomatic patients over symptomatic patients are shown. Genes with false discovery rate less than 0.05 (*), 0.01 (**), or 0.001 (***) are indicated.
Cell counts of DCs, CD4 T cells, CD8 T cells, and B cells that express specific chemokine markers between asymptomatic (n = 19), symptomatic patients (n = 37), and healthy controls (n = 10) are analyzed by CyTOF and shown. Data are presented as mean ± SD. *P < 0.05; **P < 0.01; and ***P < 0.001 (Kruskal–Wallis test with Dunn’s multiple comparison).
References
Publication types
MeSH terms
Substances
Grants and funding
LinkOut - more resources
Full Text Sources
Other Literature Sources
Medical
Miscellaneous

