. 2021 Sep 2;28(9):1657-1670.e10.
doi: 10.1016/j.stem.2021.04.006. Epub 2021 May 6.

Generation of hypothalamic arcuate organoids from human induced pluripotent stem cells

Affiliations

Generation of hypothalamic arcuate organoids from human induced pluripotent stem cells

Wei-Kai Huang et al. Cell Stem Cell. .

Abstract

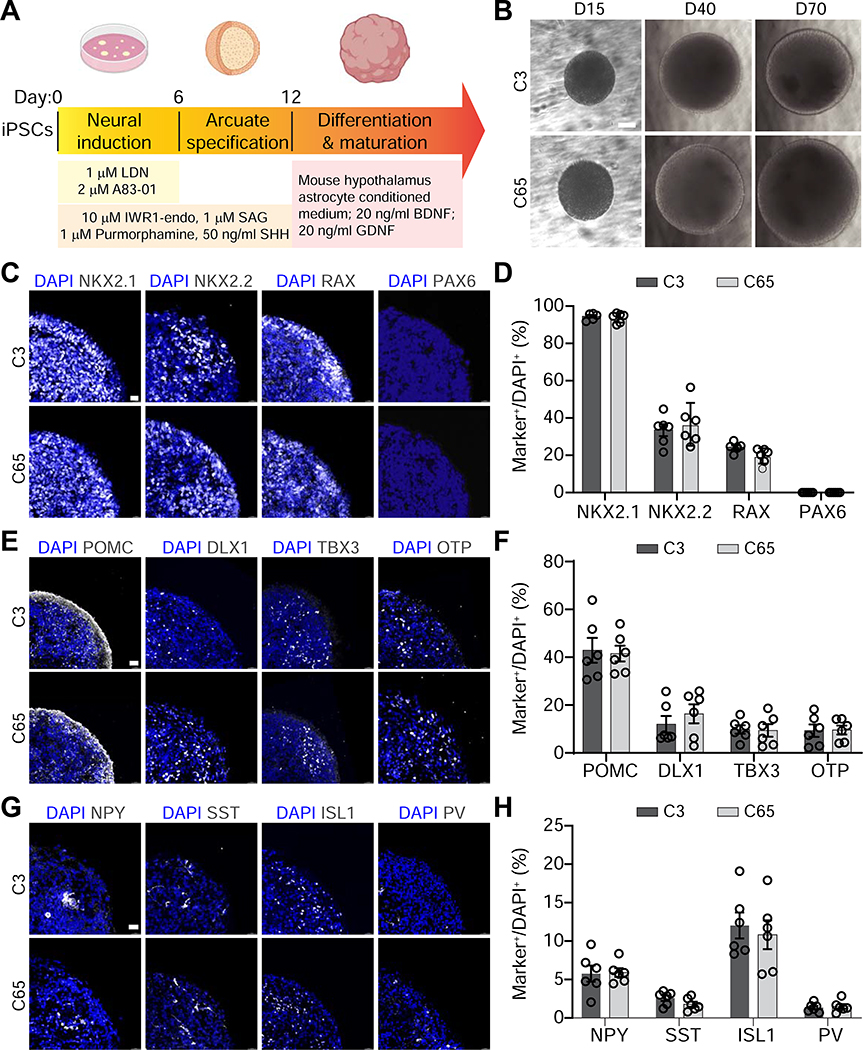
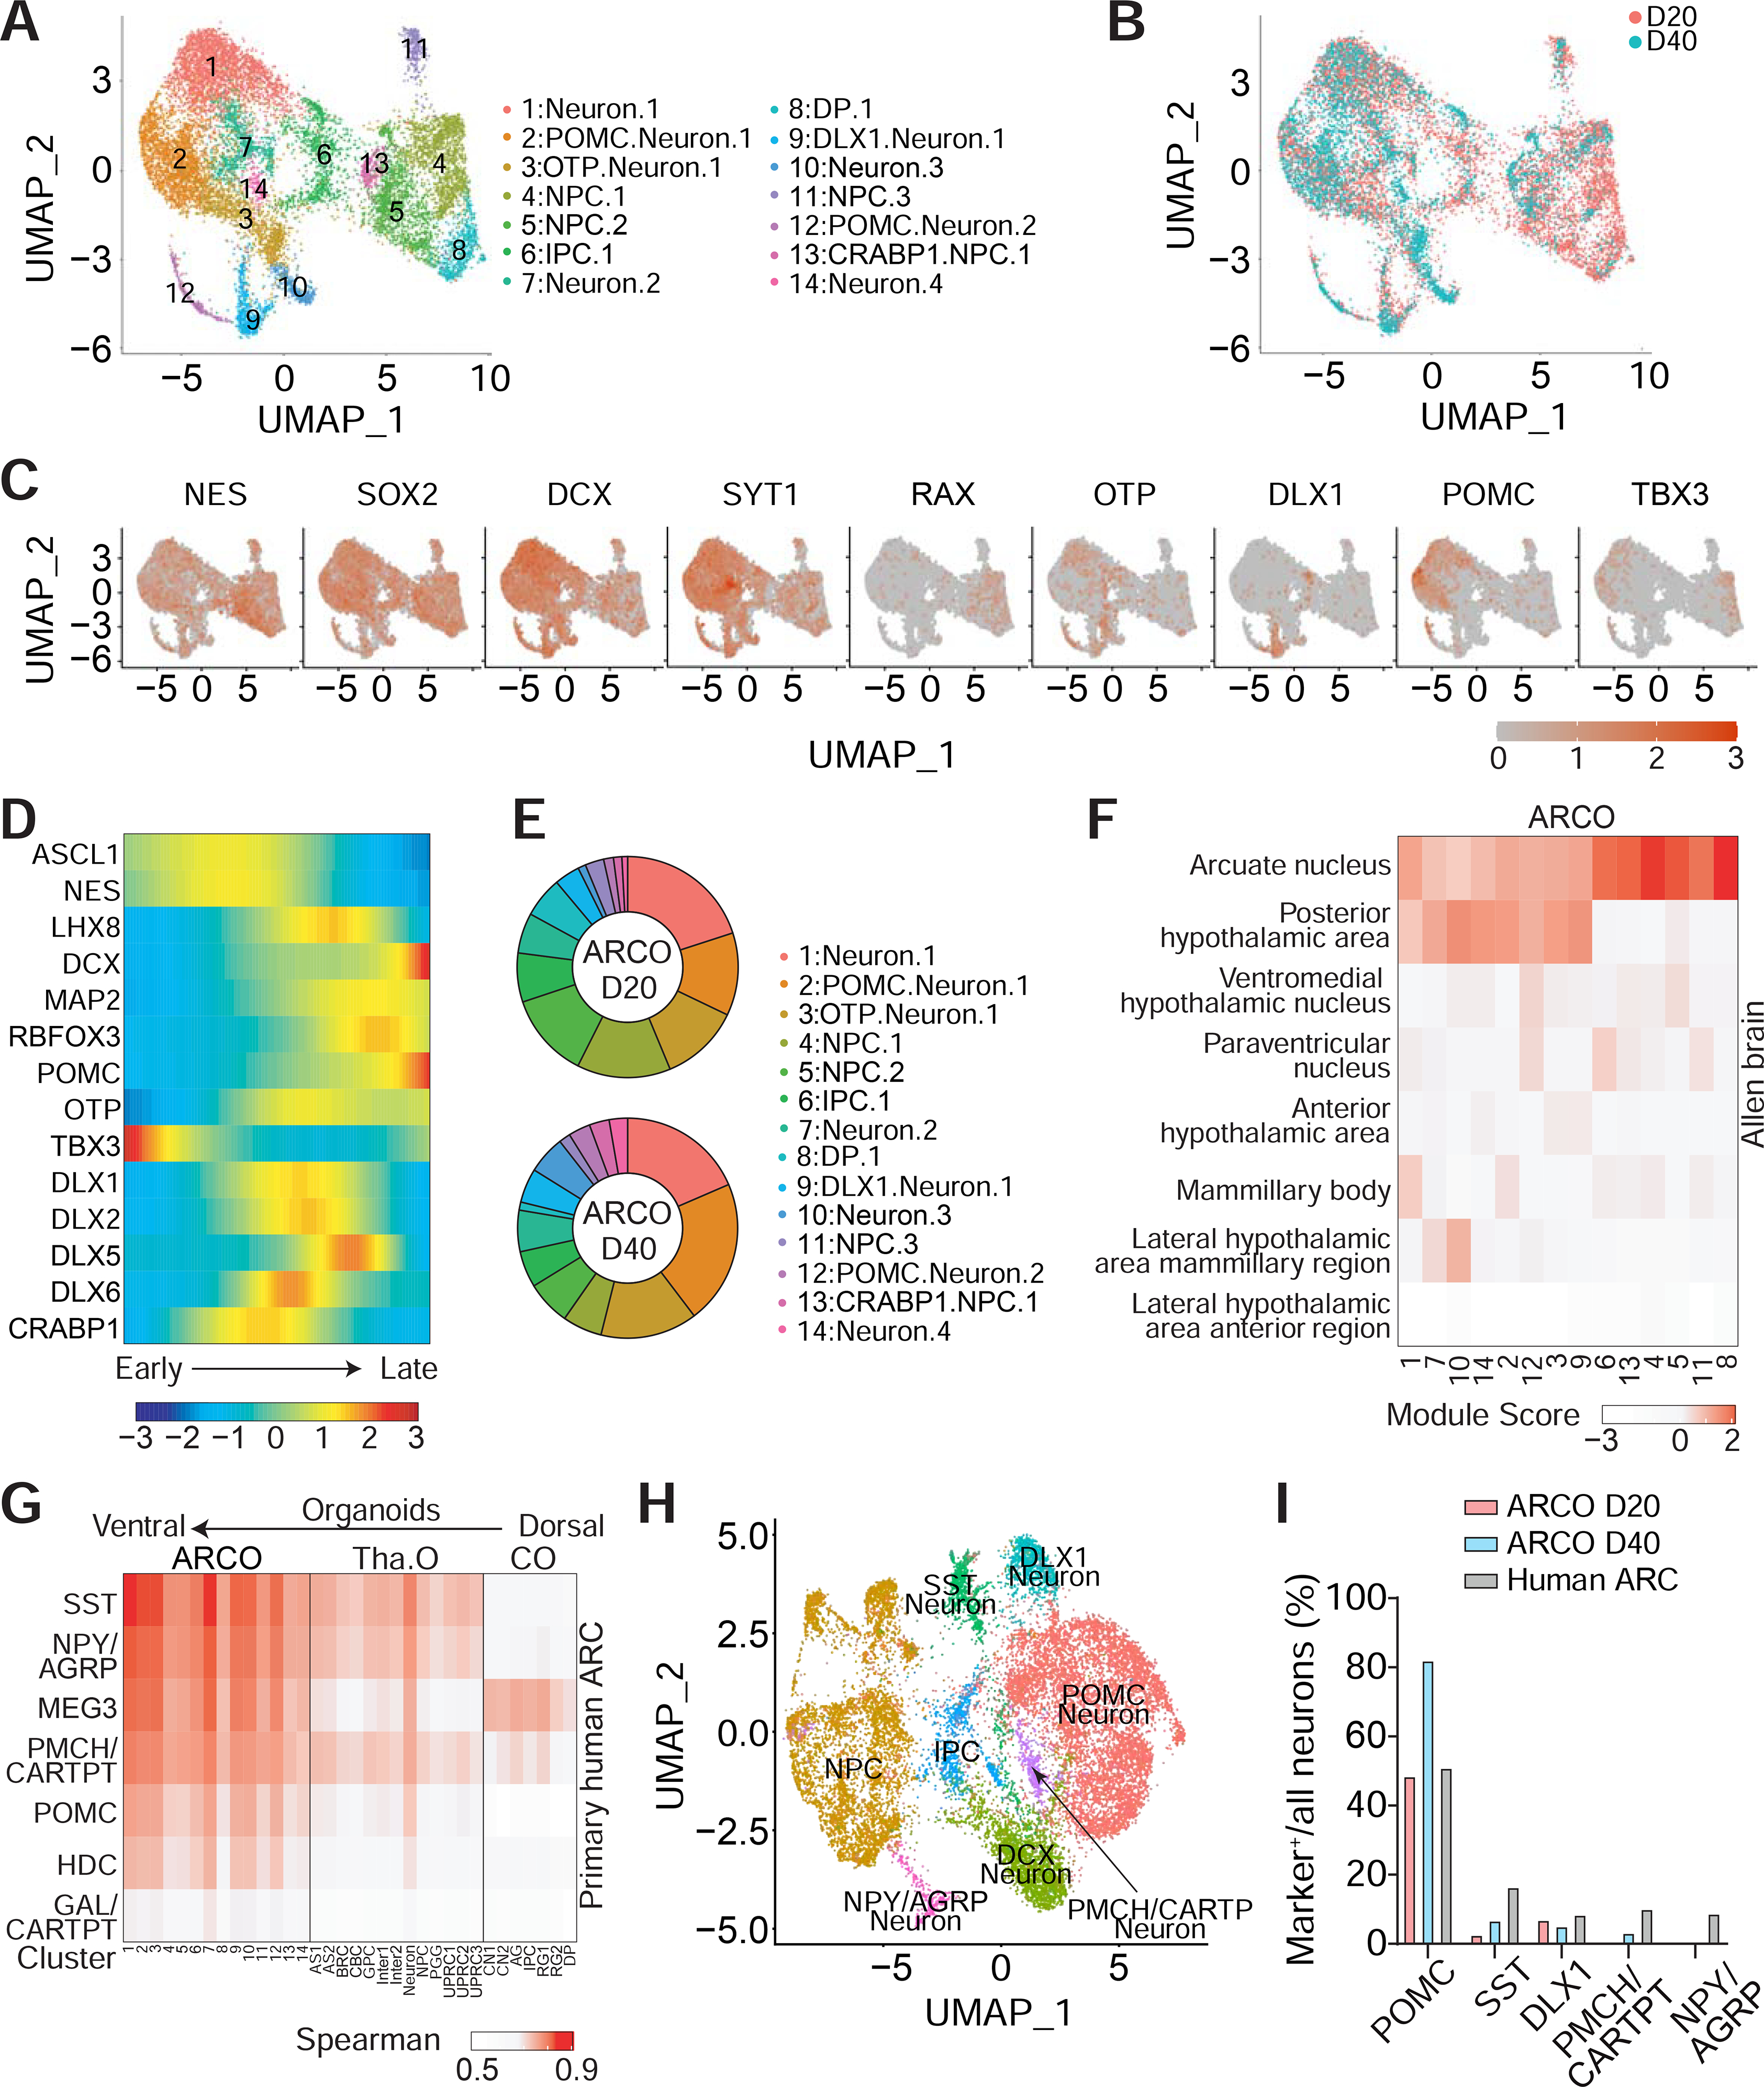
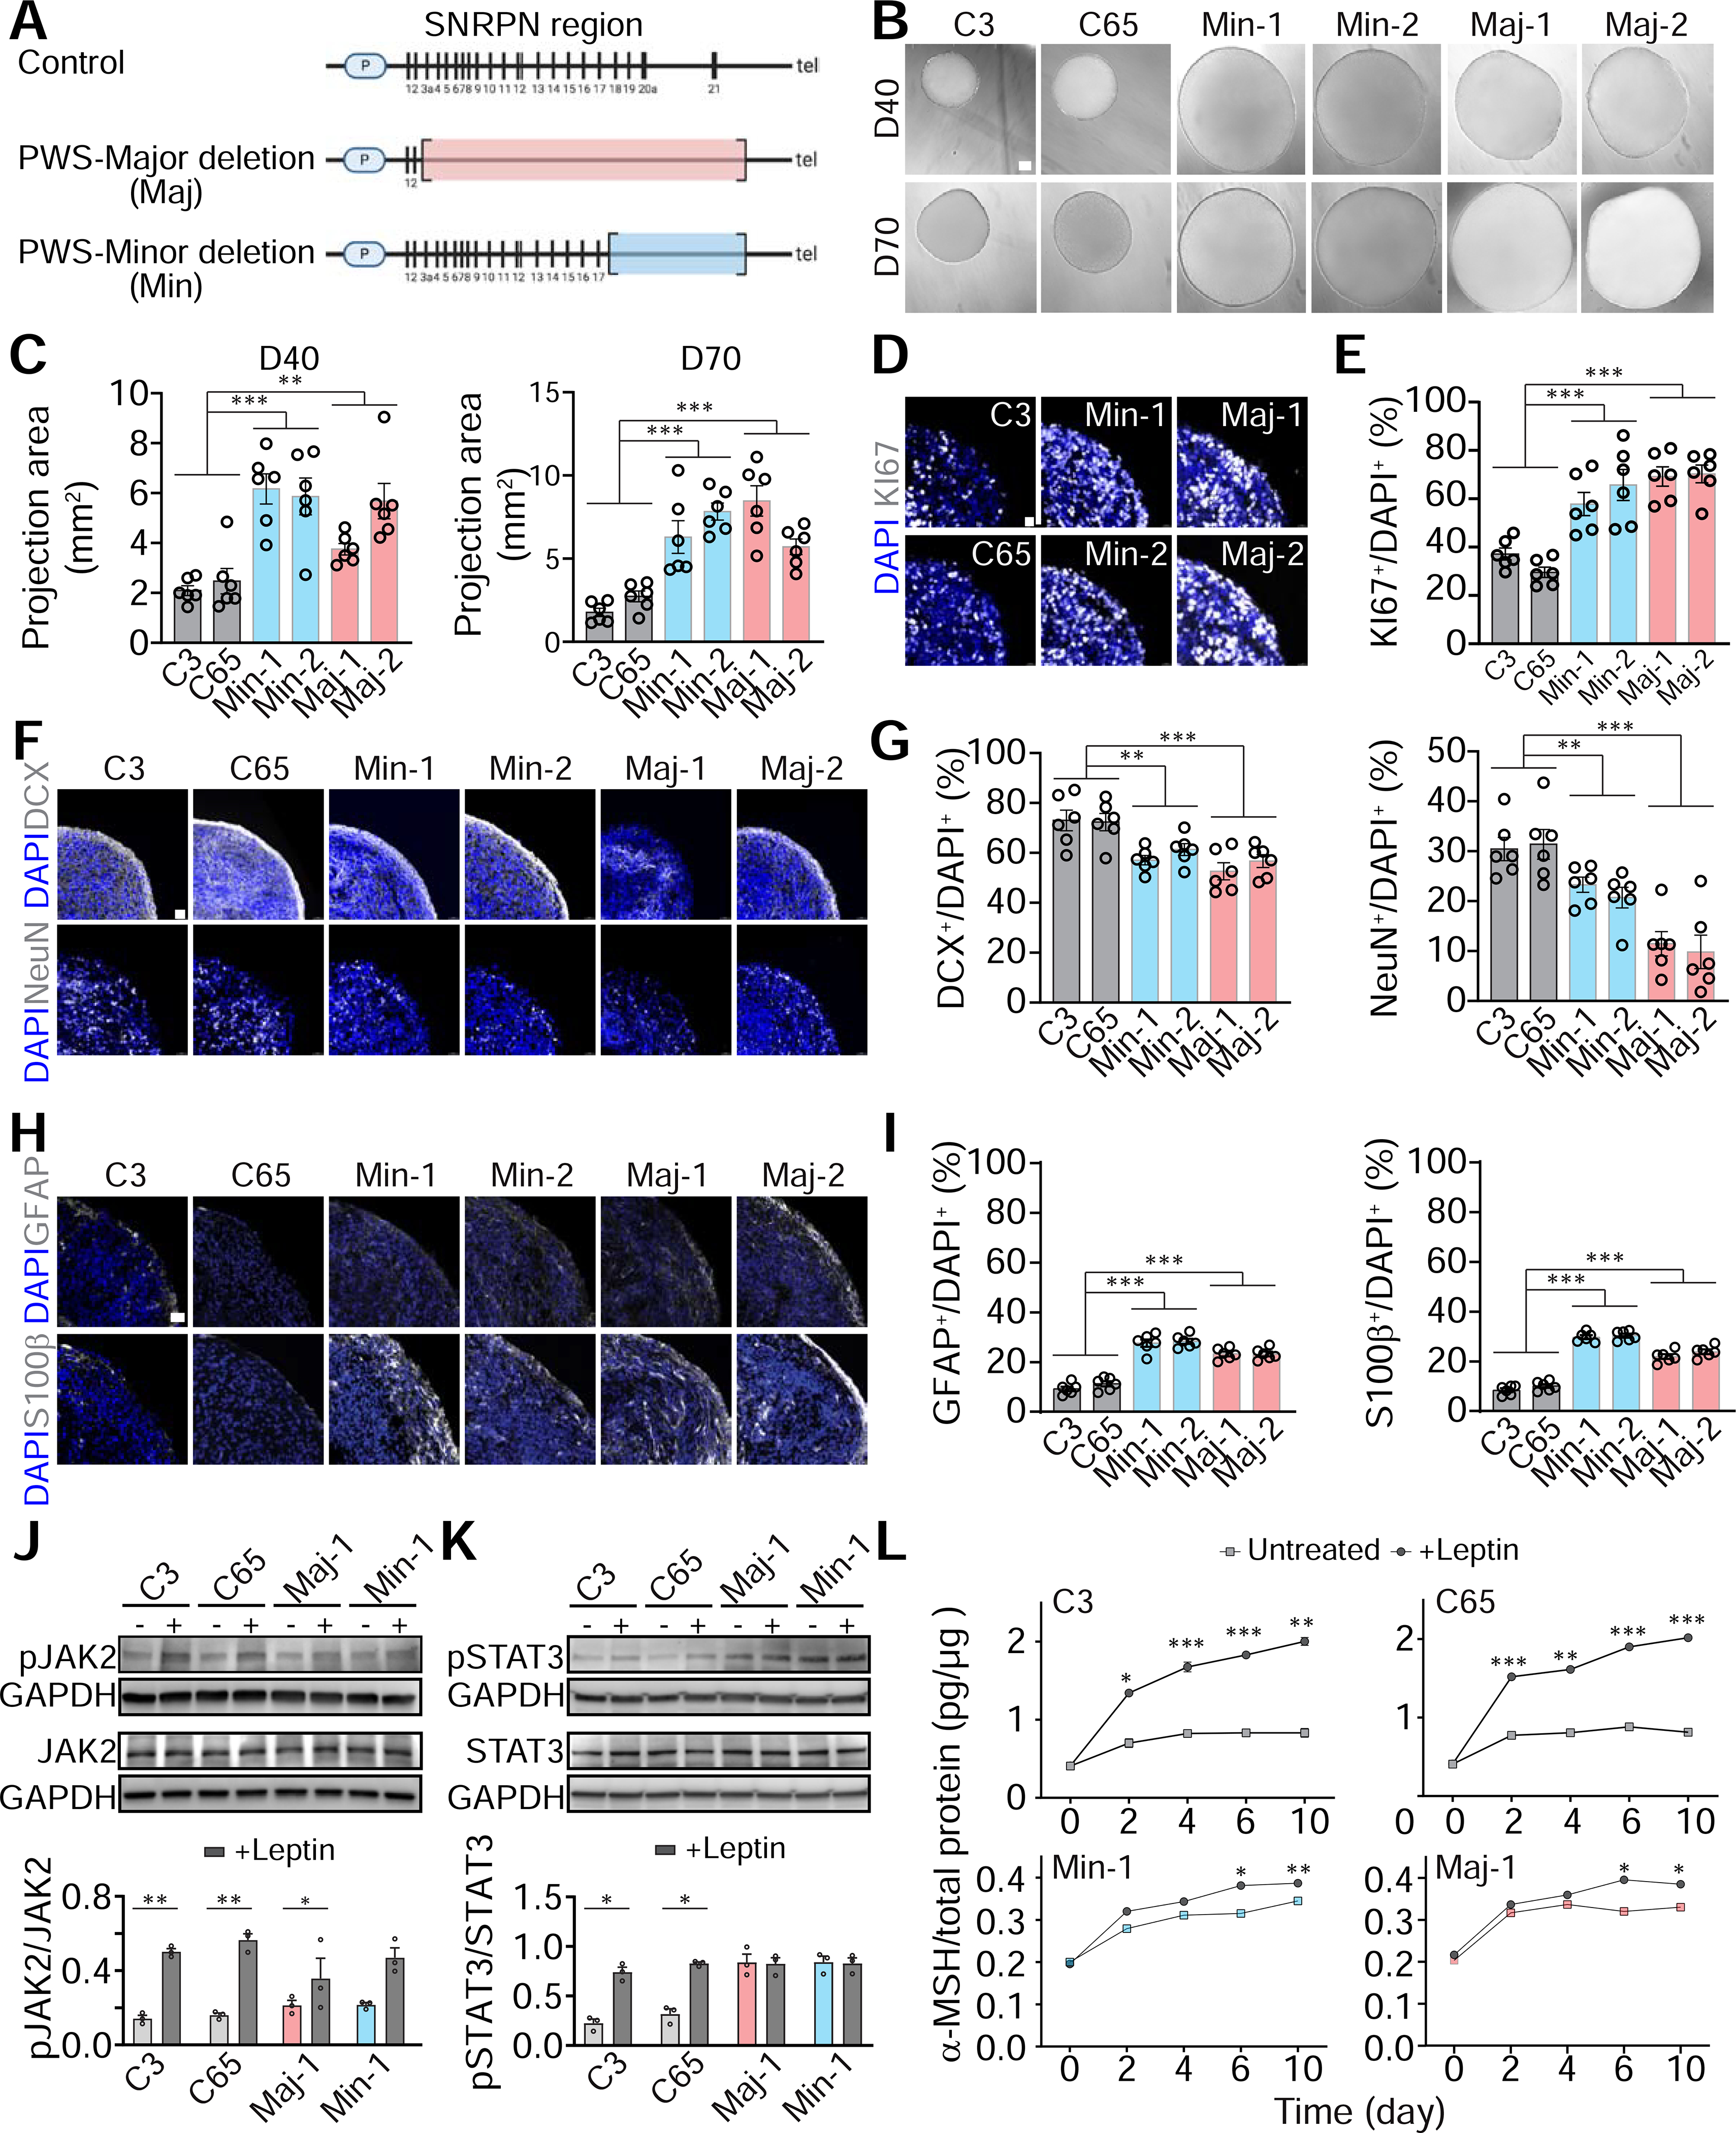
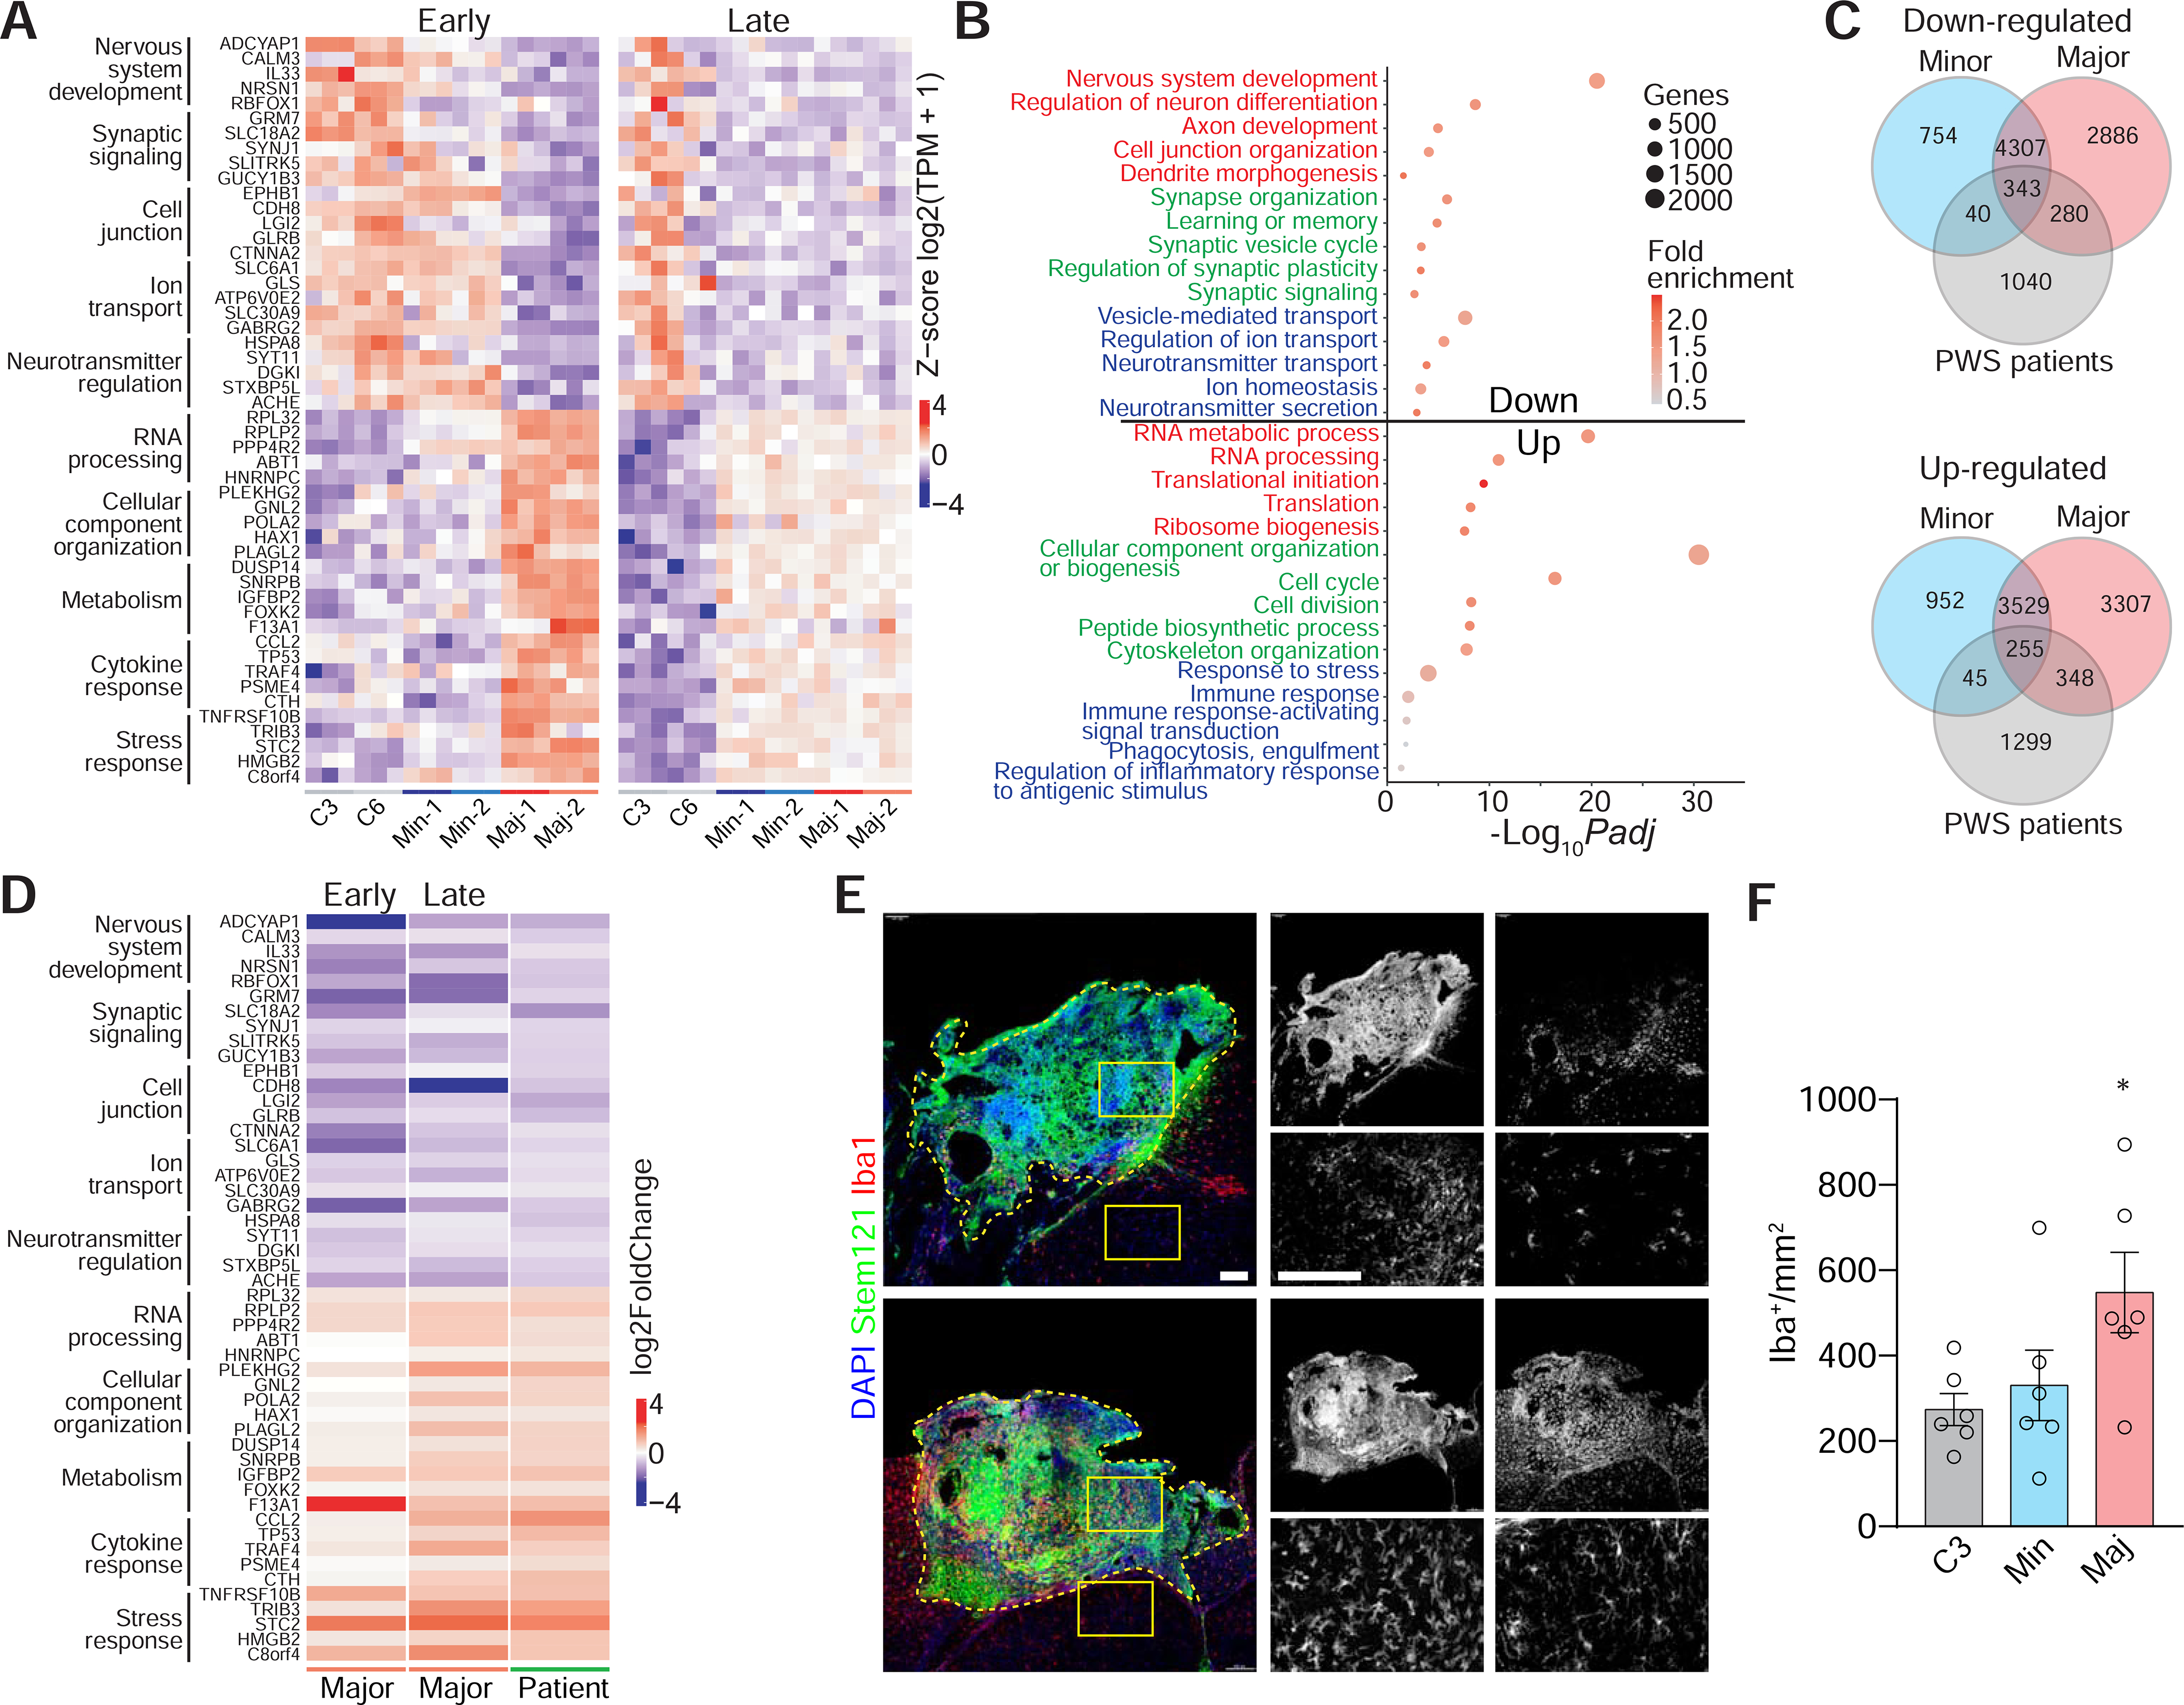
Human brain organoids represent remarkable platforms for recapitulating features of human brain development and diseases. Existing organoid models do not resolve fine brain subregions, such as different nuclei in the hypothalamus. We report the generation of arcuate organoids (ARCOs) from human induced pluripotent stem cells (iPSCs) to model the development of the human hypothalamic arcuate nucleus. Single-cell RNA sequencing of ARCOs revealed significant molecular heterogeneity underlying different arcuate cell types, and machine learning-aided analysis based on the neonatal human hypothalamus single-nucleus transcriptome further showed a human arcuate nucleus molecular signature. We also explored ARCOs generated from Prader-Willi syndrome (PWS) patient iPSCs. These organoids exhibit aberrant differentiation and transcriptomic dysregulation similar to postnatal hypothalamus of PWS patients, indicative of cellular differentiation deficits and exacerbated inflammatory responses. Thus, patient iPSC-derived ARCOs represent a promising experimental model for investigating nucleus-specific features and disease-relevant mechanisms during early human arcuate development.

Keywords: PWS patient iPSCs; Prader-Willis syndrome; arcuate nucleus; arcuate organoids; human hypothalamus single-cell RNA-seq; human iPSCs; hypothalamus; machine learning; transplantation.


Conflict of interest statement

Declaration of interests G.M. is on the advisory board of Cell Stem Cell. The authors declare no other competing interests.

Figures

Figure 1.
Figure 1.. Generation and Characterization of Arcuate Organoids from Human iPSCs.
(A) Schematic describing the protocol for generating arcuate organoids (ARCOs) from human iPSCs. (B) Sample bright-field images of ARCOs at 15, 40 and 70 days in vitro (DIV). Scale bar, 300 μm. (C-H) Sample confocal images of immunostaining for NKX2.1, NKX2.2, RAX and PAX6 in ARCOs at 15 DIV (C, scale bar, 15 μm), for POMC, DLX1, TBX3 and OTP at 40 DIV (E, scale bar, 30 μm), for NPY, SST, ISL1 and PV at 40 DIV (G, scale bar, 30 μm), and quantifications (D, F, H). Values represent mean ± SEM with individual data points plotted (n = 6 organoids per iPSC line). See also Figure S1 and Tables S1 and S2
Figure 2.
Figure 2.. Single-Cell RNA-Seq Analyses of ARCOs.
(A-C) Sample UMAP plots of single-cell RNA-seq analysis of ARCOs at 20 and 40 DIV, colored and labeled by cluster (A) or by timepoint (B), and representative feature plots of genes expressed in ARCOs (C). (D-E) Pseudotime trajectory analysis of selected genes in ARCOs (E) and proportion of cellular subtypes in ARCOs at 20 and 40 DIV (E). (F) Heatmap showing average module scores across all ARCO clusters for each hypothalamic nuclei-specific gene list compiled from the published Allen Brain Adult Human database (Hawrylycz et al., 2012; Jones et al., 2009; Shen et al., 2012; Sunkin et al., 2013), plotted as the column Z-score per ARCO cluster for visualization. See Methods section for detailed explanation of the module score. (G) Transcriptomic comparison of the predicted human ARC neuronal subtypes with different cell clusters from ARCOs, thalamus organoids (Tha. O) (Xiang et al., 2019) and neocortical organoids (CO) (Qian et al., 2020). (H-I) Integrated analysis of single-cell RNA-seq of ARCOs and predicted neonatal human ARC populations. Shown are UMAP of different clusters of the integrated dataset (H) and quantification of different neuronal subtypes as percentages of total neurons from ARCOs at 20 or 40 DIV and predicted human neonatal ARC populations (I). See also Figure S2 and Table S1 and S2.
Figure 3.
Figure 3.. Aberrant Differentiation and Leptin Responses of ARCOs Derived from PWS Patient iPSCs.
(A) Schematic map of the human paternal chromosome region 15q11-q13 comparison between control, PWS major and minor deletion iPSC lines. (B-C) Sample bright-field images of ARCOs generated from control and PWS iPSC lines at 40 and 70 DIV (B, scale bar, 300 μm) and quantification of projected area (mm2; C). Values represent mean ± SEM with individual data points plotted (n = 6 organoids per iPSC line; **p < 0.01; ***p < 0.001; One-way ANOVA) (D-I) Sample confocal images of immunostaining for KI67 in ARCOs from control and PWS iPSC lines at 15 DIV (D, scale bar, 15 μm), for DCX and NeuN at 40 DIV (F, scale bar, 30 μm), for GFAP and s100β at 100 DIV (H, scale bar, 20 μm), and quantifications (E, G, I). Values represent mean ± SEM with individual data points plotted (n = 6 organoids per iPSC line; **p < 0.01; ***p < 0.001; One-way ANOVA). (J-K) Leptin-induced activation of JAK2 (J) and STAT3 (K) signaling pathway. ARCOs at 60 DIV were treated with Leptin (2 μg/ml) and lysates were subject to Western blot analysis 1 hr later. Shown are sample Western blot images (top panel) and quantification (bottom panel). Values represent mean ± SEM (n = 3; *p < 0.05; ***p < 0.01; Paired t test). (L) Leptin-induced release of MCH. ARCOs at 60 DIV were treated with Leptin (2 μg/ml) every two days and conditioned medium was subjected to ELSA analysis of MCH. Values represent mean ± SEM (n = 3; *p < 0.05; **p < 0.01; ***p < 0.001; Paired t test). See also Figure S3 and Tables S1 and S2
Figure 4.
Figure 4.. Convergent Dysregulated Transcriptomic Signatures in PWS ARCOs and PWS Patient Hypothalamus.
(A) Heatmap of selected downregulated and upregulated genes comparing PWS minor and major deletion iPSC-derived ARCOs with control ARCOs at early (20 DIV) and late (100 DIV) stages. Genes related to different biological functions are grouped and labeled. Values are shown for each biological replicate as the row Z-score per gene of Log2(TPM+1)-transformed values. (B) Dot plot of selected enriched gene ontology (GO) terms for downregulated and upregulated genes comparing PWS major deletion iPSC-derived ARCOs with control ARCOs. Differentially expressed genes at both 20 and 100 DIV were combined. (C) Venn diagrams comparing the overlap of downregulated and upregulated genes in PWS minor and major deletion iPSC-derived ARCOs and PWS patient hypothalamus (Bochukova et al., 2018). Differentially expressed genes in ARCOs at both 20 and 100 DIV were combined. The overlap of downregulated genes between PWS major deletion ARCOs and PWS patient hypothalamus is significant (p = 7.26e-07; Fisher’s exact test). (D) Comparison of selected downregulated and upregulated gene fold-changes in PWS major deletion ARCOs at early (20 DIV) and later (100 DIV) stages and PWS patient hypothalamus. Genes related to different biological functions are grouped and labeled. (E-F) Sample confocal images of immunostaining for microglia marker IBA1 and human cell marker STEM121 in transplanted ARCOs derived from control and PWS major deletion iPSC lines (E) and quantification (F). Note increased densities of IBA1+ microglia both within (box 1) and near (box 2) the transplanted ARCO derived from PWS major deletion iPSCs compared to the ARCO derived from the control iPSCs. Scale bars, 100 μm. Values represent mean ± SEM with individual data points plotted (n = 6 organoids per iPSC line; *p < 0.05; Student’s t test). See also Figure S4 and Tables S2, S3 and S4

Similar articles

Cited by

References

    1. Andermann ML, and Lowell BB (2017). Toward a Wiring Diagram Understanding of Appetite Control. Neuron 95, 757–778. - PMC - PubMed
    1. Angulo MA, Butler MG, and Cataletto ME (2015). Prader-Willi syndrome: a review of clinical, genetic, and endocrine findings. J Endocrinol Invest 38, 1249–1263. - PMC - PubMed
    1. Arlotta P, and Pasca SP (2019). Cell diversity in the human cerebral cortex: from the embryo to brain organoids. Curr Opin Neurobiol 56, 194–198. - PubMed
    1. Ashburner M, Ball CA, Blake JA, Botstein D, Butler H, Cherry JM, Davis AP, Dolinski K, Dwight SS, Eppig JT, et al. (2000). Gene ontology: tool for the unification of biology. The Gene Ontology Consortium. Nat Genet 25, 25–29. - PMC - PubMed
    1. Berg DA, Su Y, Jimenez-Cyrus D, Patel A, Huang N, Morizet D, Lee S, Shah R, Ringeling FR, Jain R, et al. (2019). A Common Embryonic Origin of Stem Cells Drives Developmental and Adult Neurogenesis. Cell 177, 654–668 e615. - PMC - PubMed

Publication types