. 2021 May 11;35(6):109108.
doi: 10.1016/j.celrep.2021.109108. Epub 2021 Apr 23.

Transcriptional and epi-transcriptional dynamics of SARS-CoV-2 during cellular infection

Affiliations

Transcriptional and epi-transcriptional dynamics of SARS-CoV-2 during cellular infection

Jessie J-Y Chang et al. Cell Rep. .

Abstract

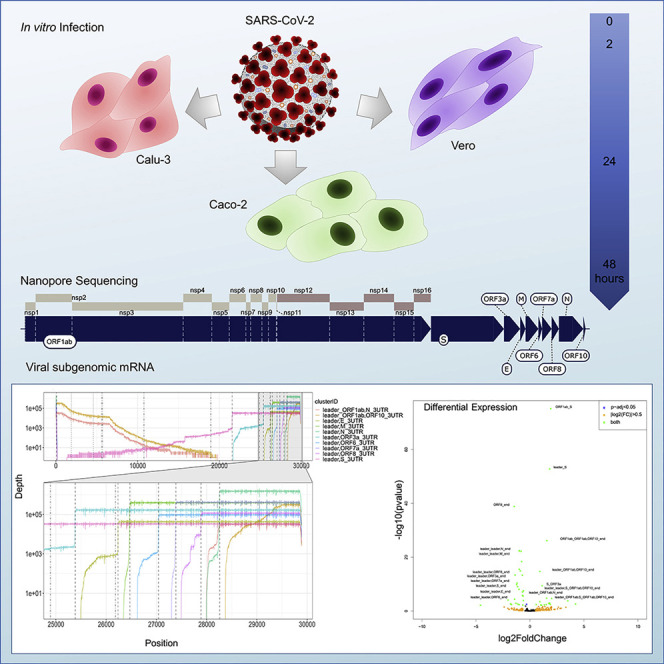
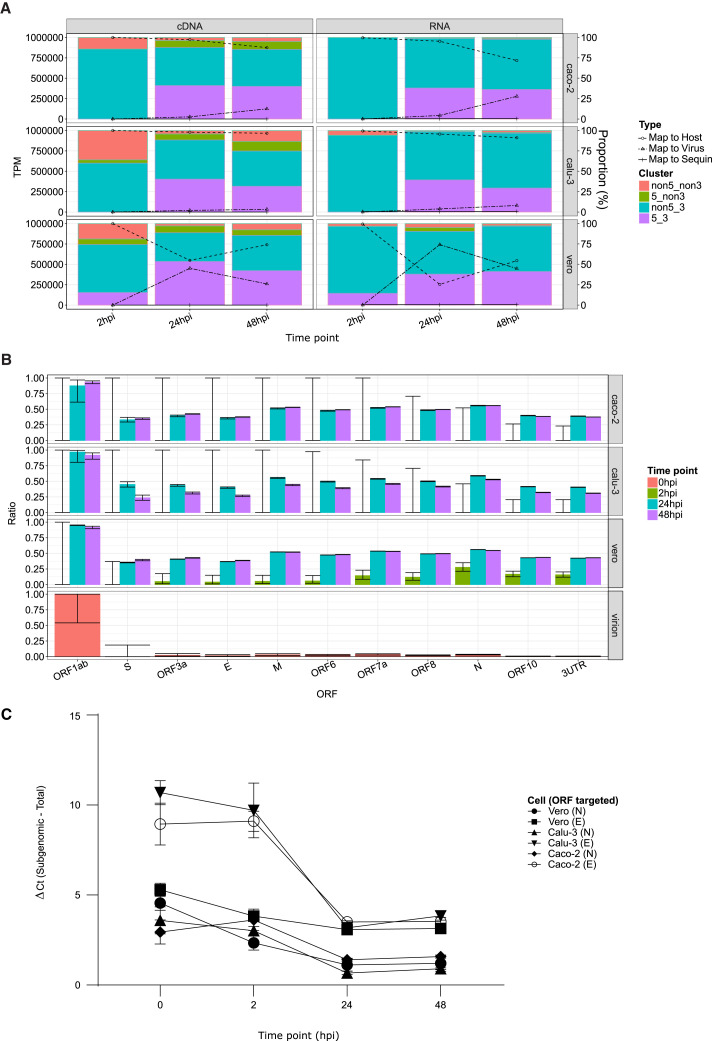
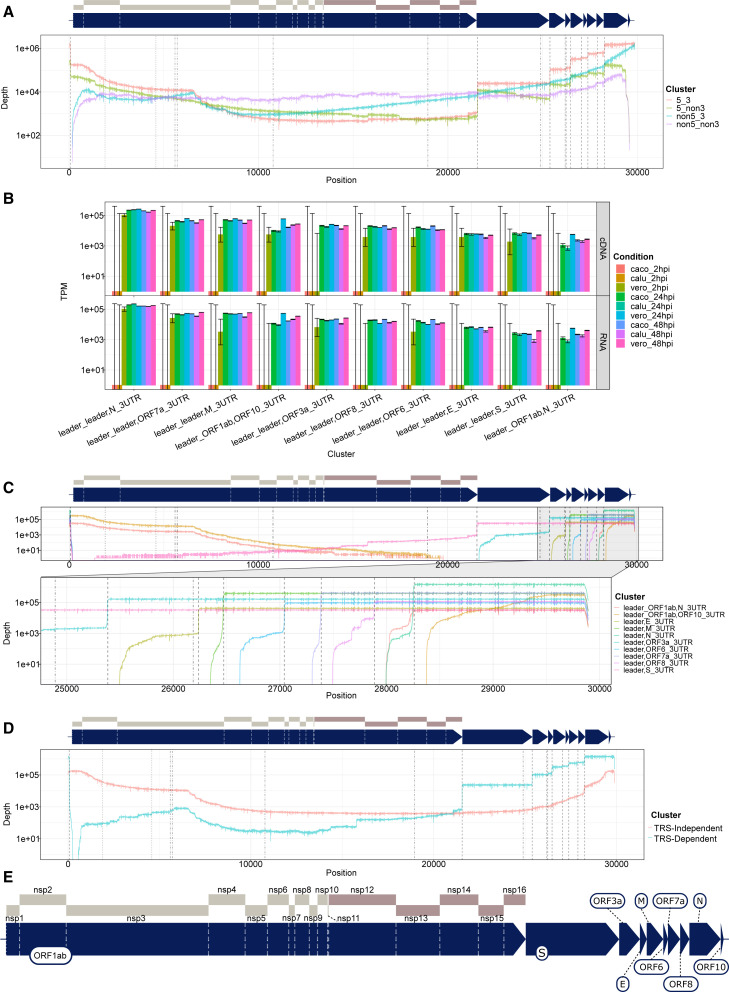
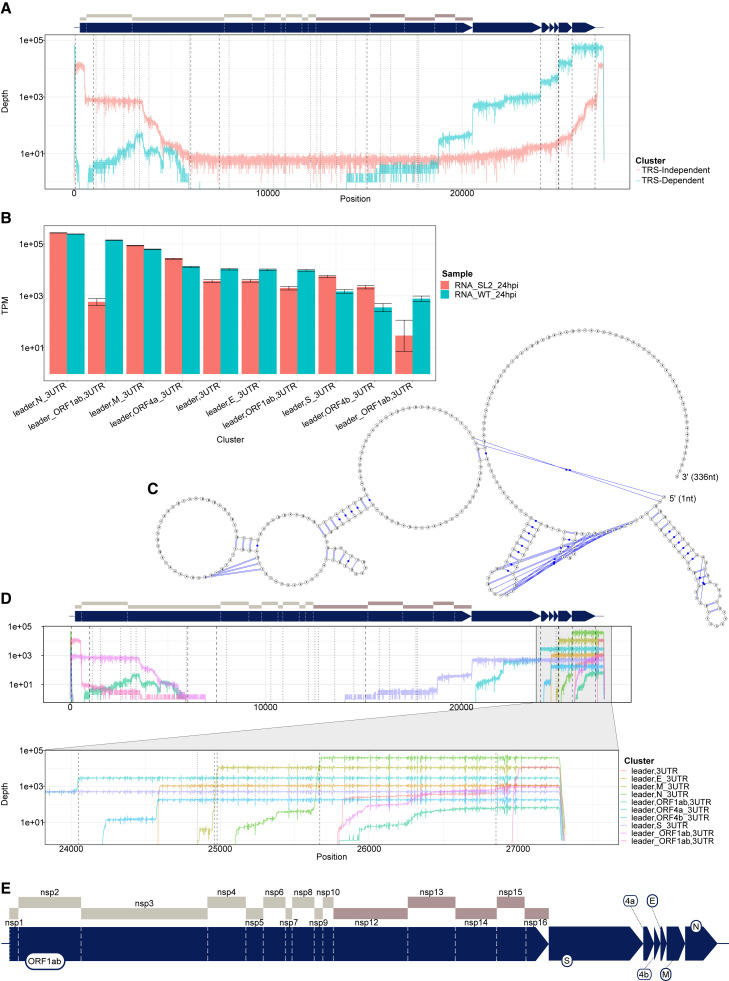
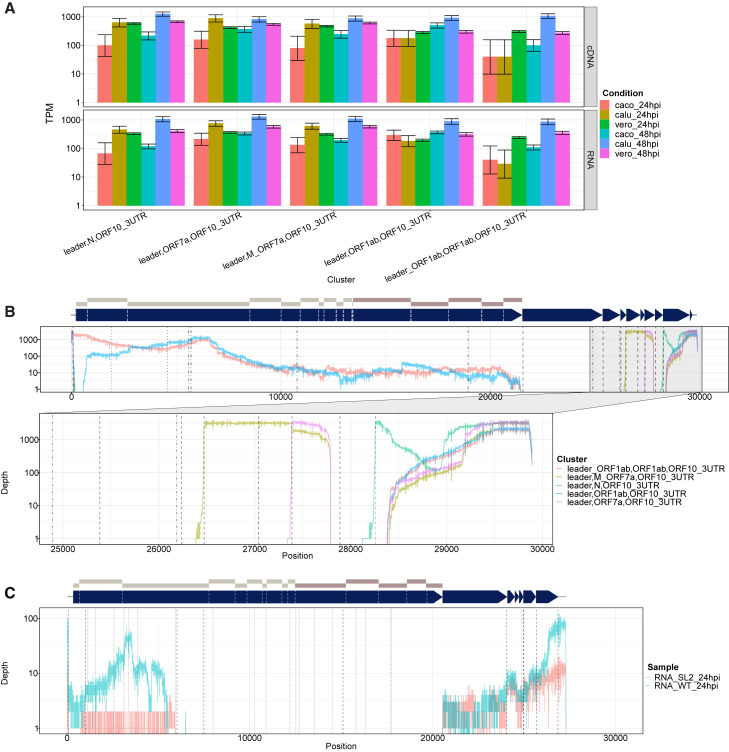
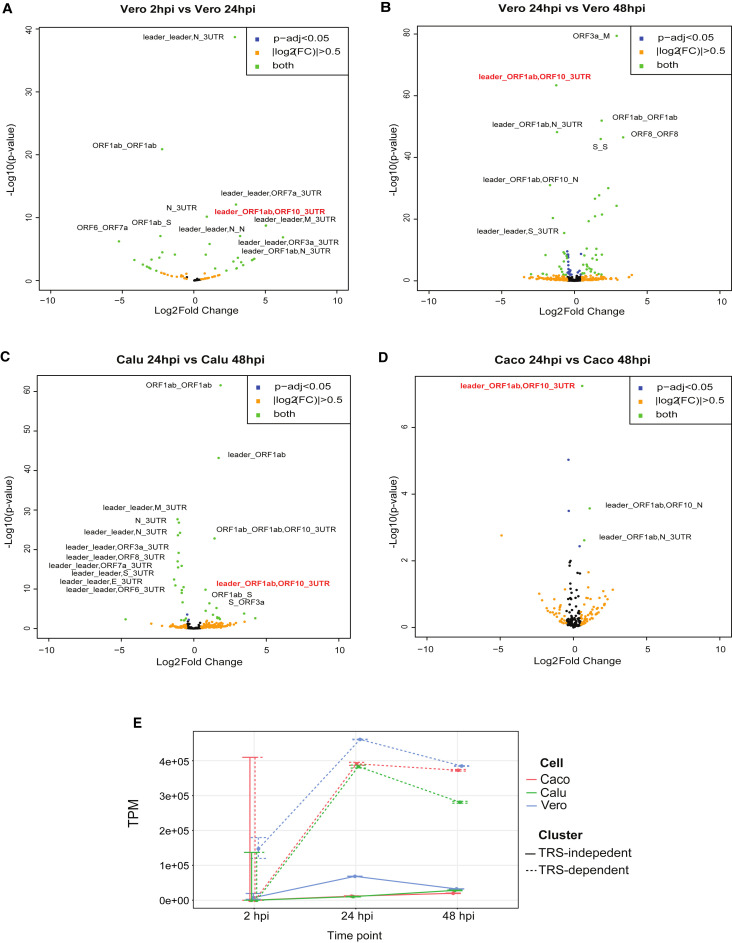
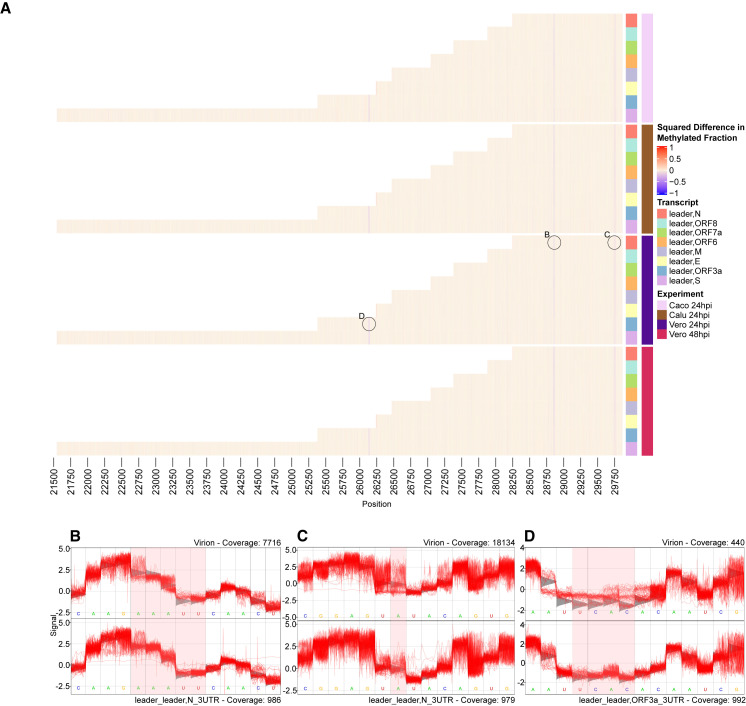
Severe acute respiratory syndrome coronavirus 2 (SARS-CoV-2) uses subgenomic RNA (sgRNA) to produce viral proteins for replication and immune evasion. We apply long-read RNA and cDNA sequencing to in vitro human and primate infection models to study transcriptional dynamics. Transcription-regulating sequence (TRS)-dependent sgRNA upregulates earlier in infection than TRS-independent sgRNA. An abundant class of TRS-independent sgRNA consisting of a portion of open reading frame 1ab (ORF1ab) containing nsp1 joins to ORF10, and the 3' untranslated region (UTR) upregulates at 48 h post-infection in human cell lines. We identify double-junction sgRNA containing both TRS-dependent and -independent junctions. We find multiple sites at which the SARS-CoV-2 genome is consistently more modified than sgRNA and that sgRNA modifications are stable across transcript clusters, host cells, and time since infection. Our work highlights the dynamic nature of the SARS-CoV-2 transcriptome during its replication cycle.

Keywords: COVID-19; Nanopore sequencing; RNA modification; SARS-CoV-2; coronavirus; differential expression; direct RNA sequencing; direct cDNA sequencing; discontinuous transcription; poly(A) tail.


Conflict of interest statement

Declaration of interests L.J.M.C., M.E.P., J.G., R.D.P.-I., and M.B.C. have received support from ONT to present their findings at scientific conferences. ONT played no role in study design, execution, analysis, or publication. L.J.M.C. has received research funding from ONT unrelated to this project.

Figures

None
Graphical abstract
Figure 1
Figure 1
Infection dynamics are represented by changes in proportion of sgRNA Time points sequenced: 2, 24, and 48 hpi; cells infected: Caco-2, Calu-3, and Vero. (A) Bar chart (left axis) indicate classification of viral mapping reads based on whether they include 5′ (e.g., leader), as well as 3′ (i.e., UTR and poly(A) tail), in terms of transcripts per million (TPMs) mapped viral reads. Line graph (right axis) indicates proportion of host, viral, or sequin mapping reads. (B) Proportion of reads covering each ORF, which are sgRNA by virtue of containing 5′ leader sequence for direct RNA sequencing datasets. Error bar indicates 95% binomial confidence interval (CI) of proportion estimate using the logistic parameterization. (C) sgRNA activity of SARS-CoV-2 measured by comparing mean differences in Ct values between subgenomic and total N and E genes across technical replicate wells of infected cells (n = 2–3) from all cell lines and across four time points (0, 2, 24, and 48 hpi), shown with ± SD error bars. The mean difference between subgenomic and total transcripts decreases over time and reaches a minimum at 24 hpi, indicating that sgRNA reaches its peak transcriptional activity at 24 hpi across all cell lines. See also Figures S1–S3 and S5 and Table S1.
Figure 2
Figure 2
SARS-CoV-2 produces classes of TRS-independent sgRNA, which are abundantly expressed The transcript nomenclature W_X,Y_Z indicates that the transcript consists of the continuous segment from W to X joined with the segment from Y to Z. (A) Total depth of coverage summed over all cDNA sequencing runs by categorization of reads based on mapping to 5′ and 3′ end of virus (within 10 base pairs [bp]) plotted on a log y scale. Dashed lines indicate location of TRS motifs, with alternative motifs detected using FIMO shown in dotted and dot-dash lines. (B) Transcript abundance of major classes of sgRNA in TPMs mapped viral reads, plotted on a log scale for dRNA experiments (bottom row) and direct cDNA (top line). 95% CIs estimated from binomial model using the logistic parameterization. (C) Transcript coverage of major classes of sgRNA in terms of total read depth across all cDNA samples, shown on log scale. Dashed lines indicate positions of TRS motif. (D) Coverage of TRS-dependent sgRNA (blue) versus TRS-independent RNA (orange), summed over all cDNA sequencing experiments. Black dashed lines indicate position of TRS motifs. y axis is on log scale. (E) Enlarged schematic of genome annotation for SARS-CoV-2. Regions are to scale. See also Figure S1.
Figure 3
Figure 3
Alphacoronavirus HCoV-229E produces classes of TRS-independent sgRNA that are abundantly expressed The transcript nomenclature W_X,Y_Z indicates that the transcript consists of the segment from W to X joined with the segment from Y to Z. (A) Total depth of TRS-independent versus TRS-dependent sgRNA in HCoV-229E. Dashed vertical lines indicate positions of TRS motifs, with alternative motifs detected using FIMO shown in dotted and dot-dash lines. (B) Normalized transcript counts (TPM viral-mapped reads) of major sgRNA from HCoV-229E for wild-type (WT) or with stem loop 2 replaced (SL2). Error bars indicate 95% binomial CI of TPM estimate using the logistic parameterization. (C) Predicted secondary structure of ORF10 + 3′ UTR from SARS-CoV-2 showing bulged stem loop in ORF10. Prediction calculated with IPknot software. (D) Transcript coverage of major classes of sgRNA in terms of total read depth across all cDNA samples, shown on log scale. Dotted lines indicate positions of TRS. (E) Enlarged schematic of genome annotation for HCoV-229E. Regions are to scale. See also Figure S1.
Figure 4
Figure 4
SARS-CoV-2 produces double-junction sgRNA The transcript nomenclature U_V,W_X,Y_Z indicates that the transcript consists of the segments U to V, W to X, and Y to Z. (A) Normalized counts (in TPM mapped viral reads) of double-junction reads in SARS-CoV-2 cDNA datasets. Error bars indicate 95% binomial CI of TPM estimate using the logistic parameterization. (B) Depth of coverage of double-junction sgRNA in SARS-CoV-2 (summed over all cDNA sequencing experiments), shown on log scale. Dashed lines indicate positions of TRS motifs. (C) Coverage of double-junction reads in 229E for WT and samples with modified SL2. See also Figures S1 and S4.
Figure 5
Figure 5
Viral sgRNA expression patterns change during the course of cellular infection with delayed responses in TRS-independent transcripts Volcano plots of differentially expressed SARS-CoV-2 transcripts from direct cDNA datasets (n = 3, where n is the number of technical replicates). (A) Vero cells between 2 versus 24 hpi. (B–D) Vero (B), Calu-3 (C), and Caco-2 (D) cell lines between 24 versus 48 hpi analyzed using DESeq2. Thresholds of p-adj < 0.05 and |log2FC| > 0.5 were applied to the data. Orange dots indicate transcripts that have |log2FC| > 0.5, blue dots indicate transcripts that have p-adj < 0.05, and green dots indicate transcripts that satisfy both criteria. Positive and negative log2FC indicate upregulation and downregulation at the latter time point, respectively. The transcript nomenclature W_X,Y_Z indicates that the transcript consists of the segment from W to X joined with the segment from Y_Z. (E) Changes in TRS-dependent (dotted) and TRS-independent (continuous) TPM mapped viral reads across multiple time points (2, 24, and 48 hpi) in Caco-2 (orange), Calu-3 (green), and Vero (blue) cell lines. Error bars indicate 95% binomial CI of TPM estimate using the logistic parameterization. See also Figures S1 andS7 and Table S2.
Figure 6
Figure 6
RNA modifications vary between genomic and sgRNA, but not throughout the course of infection (A) Heatmap indicates (% age methylated reads cell line − % age methylated reads virion)2. sgRNAs are color coded on the y axis, and genome position is mapped on the x axis. 5′ leader sequence and final 30 bases of 3′ end are excluded because of insufficient coverage. Raw heatmap values are included in Data S1. (B–D) Squiggle plots of selected significant locations from Vero 24 hpi as highlighted on heatmap. Bases of interest are highlighted in red windows. Gray triangles behind squiggle indicate expected signal distribution under the standard model (i.e., no modification). For (B), unmodified region of the N mRNA (bottom) is compared with squiggle from genomic RNA from the virion (top) signal information at genome position 28852–28862. For (C), unmodified base at N mRNA (bottom) position 29750A compared with predicted modification on virion. For (D), unmodified region 26310–26135 of ORF3a mRNA (bottom) compared with predicted modification on virion (top). See also Figure S6 and Data S1.

Similar articles

Cited by

References

    1. Bailey T.L., Boden M., Buske F.A., Frith M., Grant C.E., Clementi L., Ren J., Li W.W., Noble W.S. MEME SUITE: tools for motif discovery and searching. Nucleic Acids Res. 2009;37:W202–W208. - PMC - PubMed
    1. Batista F.M., Stapleton T., Lowther J.A., Fonseca V.G., Shaw R., Pond C., Walker D.I., van Aerle R., Martinez-Urtaza J. Whole Genome Sequencing of Hepatitis A Virus Using a PCR-Free Single-Molecule Nanopore Sequencing Approach. Front. Microbiol. 2020;11:874. - PMC - PubMed
    1. Chen Y., Su C., Ke M., Jin X., Xu L., Zhang Z., Wu A., Sun Y., Yang Z., Tien P. Biochemical and structural insights into the mechanisms of SARS coronavirus RNA ribose 2′-O-methylation by nsp16/nsp10 protein complex. PLoS Pathog. 2011;7:e1002294. - PMC - PubMed
    1. Corman V.M., Landt O., Kaiser M., Molenkamp R., Meijer A., Chu D.K., Bleicker T., Brünink S., Schneider J., Schmidt M.L. Detection of 2019 novel coronavirus (2019-nCoV) by real-time RT-PCR. Euro Surveill. 2020;25:2000045. - PMC - PubMed
    1. Davidson A.D., Williamson M.K., Lewis S., Shoemark D., Carroll M.W., Heesom K.J., Zambon M., Ellis J., Lewis P.A., Hiscox J.A., Matthews D.A. Characterisation of the transcriptome and proteome of SARS-CoV-2 reveals a cell passage induced in-frame deletion of the furin-like cleavage site from the spike glycoprotein. Genome Med. 2020;12:68. - PMC - PubMed