. 2021 Jul:337:108614.
doi: 10.1016/j.mbs.2021.108614. Epub 2021 May 4.

COVID-19 optimal vaccination policies: A modeling study on efficacy, natural and vaccine-induced immunity responses

Affiliations

COVID-19 optimal vaccination policies: A modeling study on efficacy, natural and vaccine-induced immunity responses

Manuel Adrian Acuña-Zegarra et al. Math Biosci. 2021 Jul.

Abstract

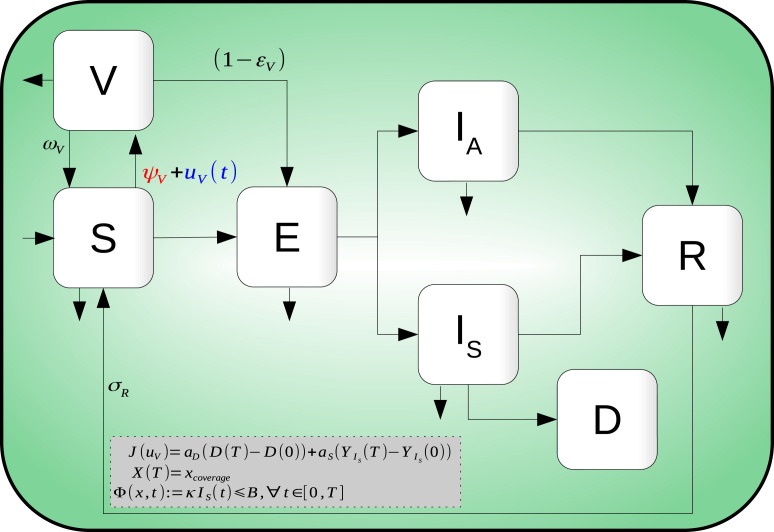
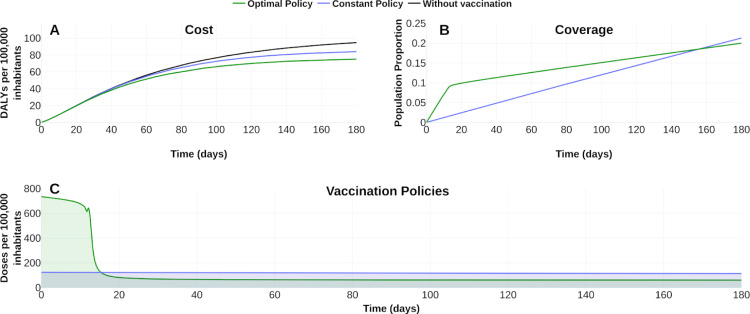
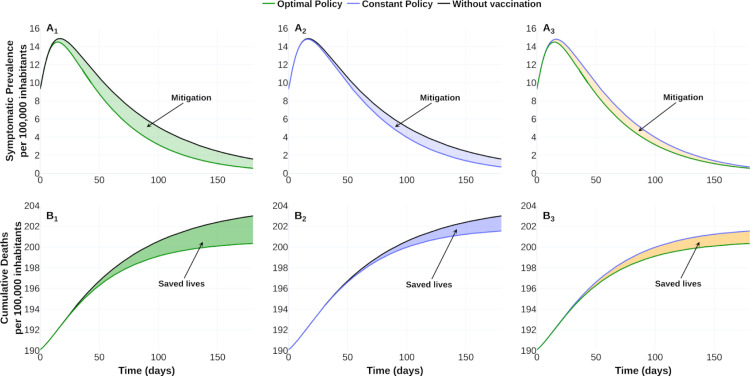
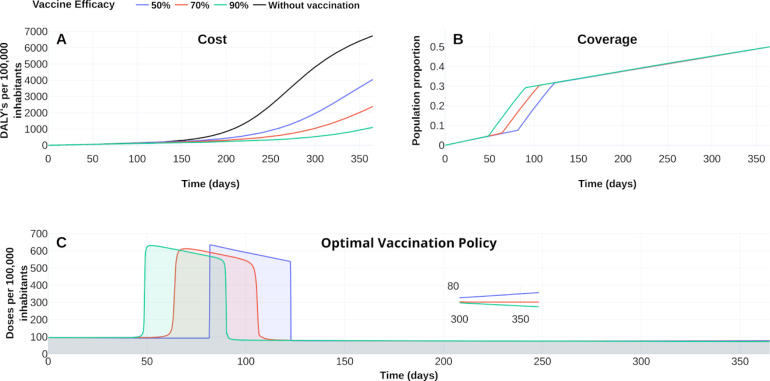
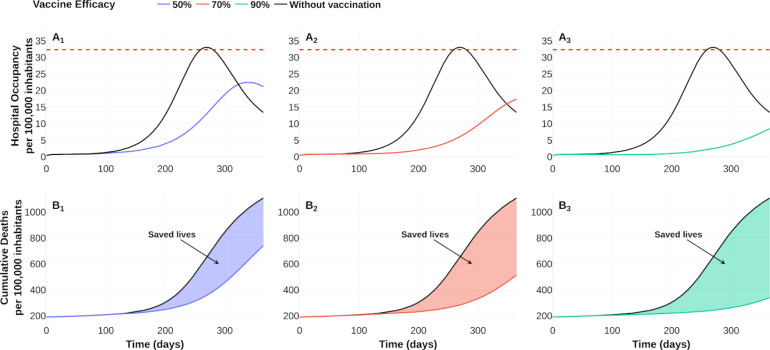
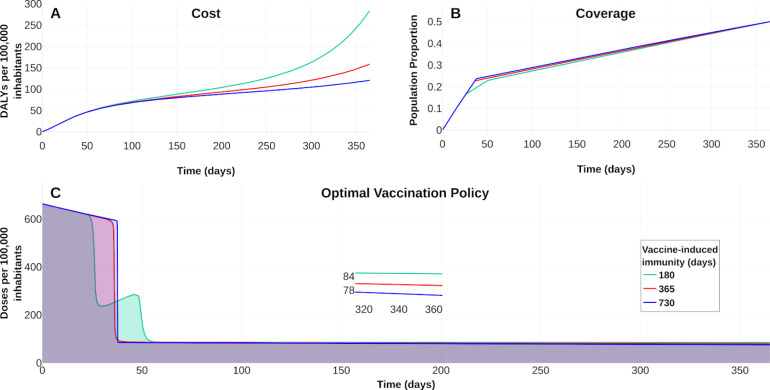
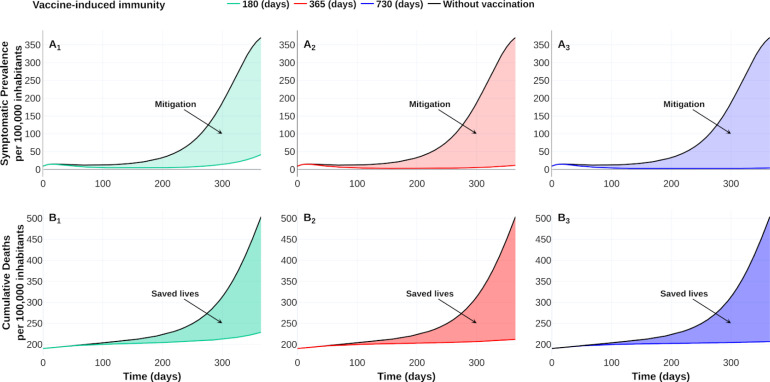
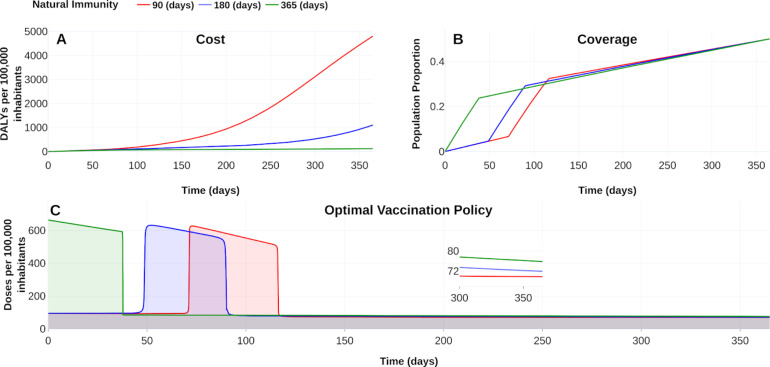
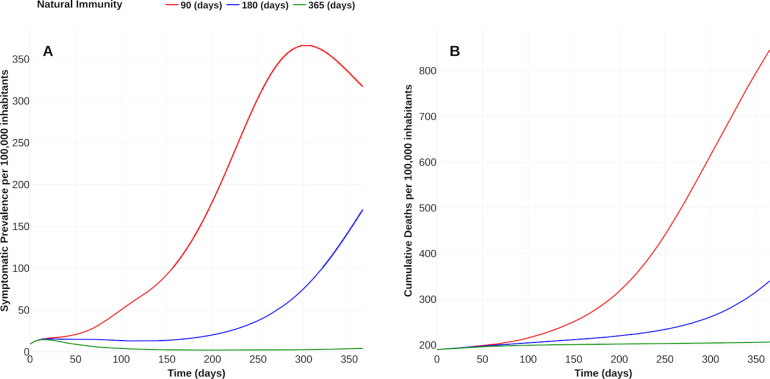
About a year into the pandemic, COVID-19 accumulates more than two million deaths worldwide. Despite non-pharmaceutical interventions such as social distance, mask-wearing, and restrictive lockdown, the daily confirmed cases remain growing. Vaccine developments from Pfizer, Moderna, and Gamaleya Institute reach more than 90% efficacy and sustain the vaccination campaigns in multiple countries. However, natural and vaccine-induced immunity responses remain poorly understood. There are great expectations, but the new SARS-CoV-2 variants demand to inquire if the vaccines will be highly protective or induce permanent immunity. Further, in the first quarter of 2021, vaccine supply is scarce. Consequently, some countries that are applying the Pfizer vaccine will delay its second required dose. Likewise, logistic supply, economic and political implications impose a set of grand challenges to develop vaccination policies. Therefore, health decision-makers require tools to evaluate hypothetical scenarios and evaluate admissible responses. Following some of the WHO-SAGE recommendations, we formulate an optimal control problem with mixed constraints to describe vaccination schedules. Our solution identifies vaccination policies that minimize the burden of COVID-19 quantified by the number of disability-adjusted years of life lost. These optimal policies ensure the vaccination coverage of a prescribed population fraction in a given time horizon and preserve hospitalization occupancy below a risk level. We explore "via simulation" plausible scenarios regarding efficacy, coverage, vaccine-induced, and natural immunity. Our simulations suggest that response regarding vaccine-induced immunity and reinfection periods would play a dominant role in mitigating COVID-19.

Keywords: COVID-19; DALYs; Natural immunity; Optimal control; Reinfection; Vaccination policy; Vaccine efficacy; Vaccine profile; Vaccine-induced immunity; WHO-SAGE.


Conflict of interest statement

Declaration of Competing Interest The authors declare that they have no known competing financial interests or personal relationships that could have appeared to influence the work reported in this paper.

Figures

Fig. 1
Fig. 1
Compartmental diagram of COVID-19 transmission dynamics which including vaccination dynamics. Here, there are seven different classes: Susceptible (S), exposed (E), symptomatic infected (IS), asymptomatic infected (IA), recovered (R), death (D) and vaccinated (V) individuals.
Fig. 2
Fig. 2
Fitting death curve of the COVID-19 outbreak in Mexico-City and Mexico-State. Panel A shows new reported deaths per day. Panel B represents cumulative deaths per day. Reported deaths data are shown in blue bars from February 19, 2020, to October 31, 2020.
Fig. 3
Fig. 3
Feasibility region for vaccine reproduction number. The vaccine reproduction number RV is plotted as a function of vaccine efficacy (εV) and vaccination rate (ψV). Gray shaded region, corresponds to RV>1. White region, denotes when RV<1. Red region is biologically unfeasible.
Fig. 4
Fig. 4
Contour plot of RV, as a function of vaccine efficacy (εV) and vaccination rate (ψV) for the case where the average vaccine-induced immunity period is six month. Dark green line represents the value of ψVbase=0.000 611, corresponding to a coverage xcoverage=0.2 and a time horizon T=365 days. Red lines show a scenario in which it is possible to reduce the RV value below one, considering a vaccine efficacy of 0.8 and a vaccination rate of 0.007.
Fig. 5
Fig. 5
Compartmental diagram of COVID-19 transmission dynamics that includes optimal vaccination dynamics (19), penalization and a path constraint.
Fig. 6
Fig. 6
Effect of the vaccination policy on the burden COVID-19 for a 20% coverage at time horizon of half year. (A) Vaccination policies’ response regarding constant (ψV) and optimal (ψV+uV(t)) vaccination rates in the burden of COVID-19 quantified in DALYs. (B) Evolution of the vaccination covering according to each policy. (C) Vaccination schedule for each vaccination policy. Blue line corresponds to policies with constant vaccination rate 0.001 239 69. Green line corresponds to optimal vaccination policy. For counterfactual reference (panel A), black line represents the burden of COVID-19 without vaccination. See https://plotly.com/ MAAZ/366/ for plotly visualization and data.
Fig. 7
Fig. 7
Effect of the vaccination policy on outbreak evolution. Optimal policy versus no vaccination (first column), constant policy versus no vaccination (second column) and optimal versus constant policy (third column). Upper row shows the symptomatic prevalence per 100 000 inhabitants. Lower row illustrates cumulative deaths (per 100 000 inhabitants). The shaded area represents the improvement of one policy over its corresponding. Data and web visualization in https://plotly.com/ MAAZ/474/.
Fig. 8
Fig. 8
The response of COVID-19 burden on vaccine efficacy. (A) COVID-19 burden response quantified in DALYs per 100 000 inhabitants to vaccines with efficacy of 50 % (blue), 70 % (red) and 90 %(green). (B) Coverage evolution to reach 50 % of the total population vaccinated. (C) Optimal vaccination doses schedule according to the different efficacies. See https://plotly.com/ MAAZ/358/ for visualization and data.
Fig. 9
Fig. 9
Effect of vaccine-efficacy on hospital occupancy and on the number of saved lives compared to no vaccination dynamics. Vaccine-efficacy of 50 % (blue), 70 % (red) and 90 % (green). Dotted red line represents 90 % of hospital beds per 100 000 inhabitants. See https://plotly.com/ MAAZ/470/ for data and visualization.
Fig. 10
Fig. 10
Vaccine-induced immunity effect on the COVID-19 burden. (A) Effect on the burden of COVID-19 quantified in DALYs per 100 000 inhabitants due to vaccine-induced immunity of 180 days (green), 365 days (red) and 730 days (blue). (B) Coverage evolution to reach 50 % of the total population vaccinated. (C) Optimal vaccination doses schedule according to the different vaccine-induced immunity periods. Visualization and data in https://plotly.com/ MAAZ/407/.
Fig. 11
Fig. 11
Effect of vaccine-induced immunity on mitigation and saved lives of COVID-19 outbreak. Upper row shows the improvement of optimal vaccination policy over no vaccination dynamics on the symptomatic prevalence per 100 000 inhabitants. Lower row shows a comparison of the saved lives (per 100 000 inhabitants) between optimal policies and no vaccination dynamics. Optimal policy with vaccine-induced immunity of a half year versus no vaccination dynamics (first column), optimal policy with vaccine-induced immunity of a year versus no vaccination dynamics (second column), and optimal policy with vaccine-induced immunity of two years versus no vaccination dynamics (third column). See https://plotly.com/ MAAZ/465/ for data and visualization.
Fig. 12
Fig. 12
Effect of natural immunity on the burden of COVID-19. (A) Effect on the burden of COVID-19 quantified in DALYs per 100,000 inhabitants due to natural immunity of 90 days (red), 180 days (blue) and 365 days (green). (B) Coverage evolution to reach 50 % of the total population vaccinated. (C) Optimal vaccination doses schedule according to the different natural immunities. https://plotly.com/ MAAZ/402/.
Fig. 13
Fig. 13
Effect of natural immunity on COVID-19 outbreak. (A) Effect of natural immunity over the symptomatic prevalence per 100 000 inhabitants. (B) Improvement of natural immunity over the cumulative deaths per 100 000 inhabitants. Plotly visualization and data in https://plotly.com/ MAAZ/451/.
Fig. A.14
Fig. A.14
Reported deaths by COVID-19 of Mexico-City and Mexico-State. Data from February 19, 2020, to October 31, 2020.

Similar articles

Cited by

References

    1. 2020. United States Food and Drug Adminsitration, FDA news release. Coronavirus (COVID-19) update: FDA authorizes drug combination for treatment of COVID-19. URL: https://www.fda.gov/news-events/press-announcements/coronavirus-covid-19....
    1. 2021. World Health Organization, WHO coronavirus disease (COVID-19) dashboard. URL: https://covid19.who.int/ (Accessed 24 February 2021)
    1. 2020. World Health Organization, strategic advisory group of experts (SAGE) on immunization working group on COVID-19 vaccines: WHO strategic advisory group of experts (SAGE) URL: https://www.who.int/immunization/policy/sage/SAGE_WG_COVID19_Vaccines_Mo....
    1. 2021. Johnson & Johnson, Johnson & Johnson announces single-shot janssen COVID-19 vaccine candidate met primary endpoints in interim analysis of its phase 3 ensemble trial. URL: https://www.jnj.com/johnson-johnson-announces-single-shot-janssen-covid-... (Accessed 15 February 2021)
    1. Scherer A., McLean A. Mathematical models of vaccination. Br. Med. Bull. 2002;62:187–199. doi: 10.1093/bmb/62.1.187. - DOI - PubMed

Publication types

MeSH terms

Substances