. 2021 Nov:53:101240.
doi: 10.1016/j.molmet.2021.101240. Epub 2021 May 4.

A survey of the mouse hindbrain in the fed and fasted states using single-nucleus RNA sequencing

Affiliations

A survey of the mouse hindbrain in the fed and fasted states using single-nucleus RNA sequencing

Georgina K C Dowsett et al. Mol Metab. 2021 Nov.

Abstract

Objective: The area postrema (AP) and nucleus tractus solitarius (NTS) located in the hindbrain are key nuclei that sense and integrate peripheral nutritional signals and consequently regulate feeding behaviour. While single-cell transcriptomics have been used in mice to reveal the gene expression profile and heterogeneity of key hypothalamic populations, similar in-depth studies have not yet been performed in the hindbrain.

Methods: Using single-nucleus RNA sequencing, we provide a detailed survey of 16,034 cells within the AP and NTS of mice in the fed and fasted states.

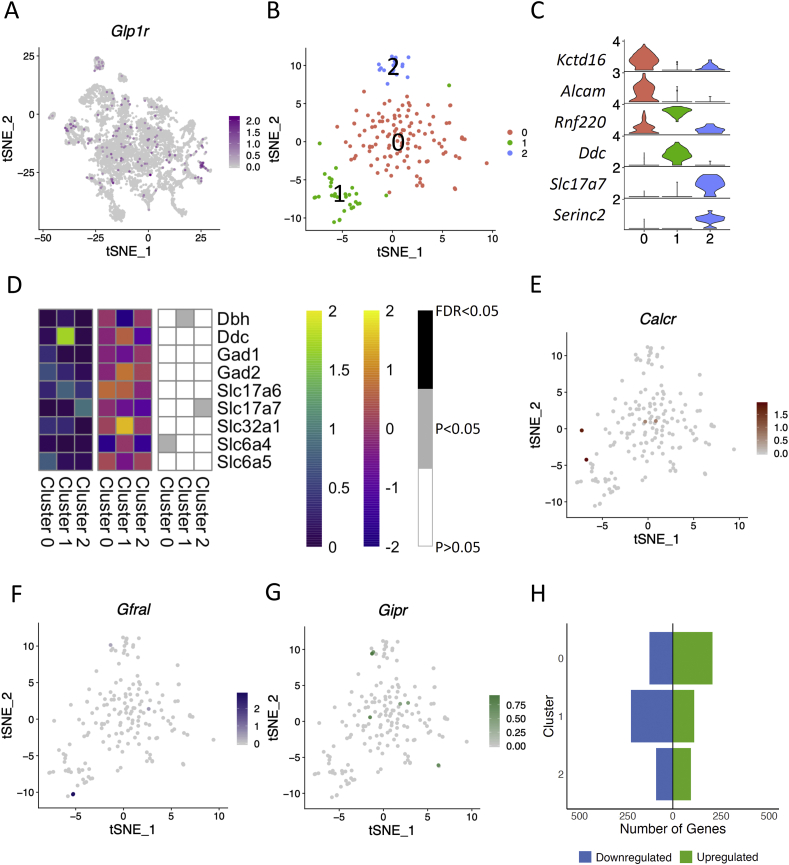
Results: Of these, 8,910 were neurons that group into 30 clusters, with 4,289 from mice fed ad libitum and 4,621 from overnight fasted mice. A total of 7,124 nuclei were from non-neuronal cells, including oligodendrocytes, astrocytes, and microglia. Interestingly, we identified that the oligodendrocyte population was particularly transcriptionally sensitive to an overnight fast. The receptors GLP1R, GIPR, GFRAL, and CALCR, which bind GLP1, GIP, GDF15, and amylin, respectively, are all expressed in the hindbrain and are major targets for anti-obesity therapeutics. We characterise the transcriptomes of these four populations and show that their gene expression profiles are not dramatically altered by an overnight fast. Notably, we find that roughly half of cells that express GIPR are oligodendrocytes. Additionally, we profile POMC-expressing neurons within the hindbrain and demonstrate that 84% of POMC neurons express either PCSK1, PSCK2, or both, implying that melanocortin peptides are likely produced by these neurons.

Conclusion: We provide a detailed single-cell level characterisation of AP and NTS cells expressing receptors for key anti-obesity drugs that are either already approved for human use or in clinical trials. This resource will help delineate the mechanisms underlying the effectiveness of these compounds and also prove useful in the continued search for other novel therapeutic targets.

Keywords: Area postrema; Gene expression; Nucleus tractus solitarius; Obesity; Therapeutics.


Figures

Figure 1
Figure 1
Single-nucleus RNA sequencing of the AP and NTS reveals 41 populations. (A) tSNE plot showing 41 clusters including 8 Oligodendrocyte and Oligodendrocyte Precursor Cells (OPC) clusters, 1 Astrocyte cluster, 1 microglia cluster, 1 epithelial cell cluster and 30 neuronal clusters. (B) Phylogenetic tree showing the hierarchy of the clusters. Similar cell clusters are grouped together. (Abbreviations: O = Oligodendrocytes, A = Astrocytes, E = Epithelial cells, M = Microglia, N = Neurons). (C) Feature plots displaying the relative expression levels of cell type markers for neurons (green, top left), Oligodendrocytes and OPC's (blue, top right), astrocytes (red, bottom left), epithelial cells (pink, bottom centre) and microglia (orange, bottom right). (D) tSNE plot showing the 30 neuronal clusters (8910 nuclei). Cluster numbers remain unchanged from Figure 1A. (E) Scaled expression levels of Slc17a6 (blue) and Slc32a1 (orange) in neuronal nuclei displayed as a combined feature plot.
Figure 2
Figure 2
The effect of nutritional state on transcriptomic expression in mouse AP/NTS cells. (A) tSNE plot revealing the nutritional status of each cell within the dataset. A total of 7667 nuclei came from mice fed ad libitum (pink), and 8367 cells came from mice who were fasted overnight (blue). (B) Graph showing the proportion of nuclei within each cluster that originated from mice fed ad libitum (pink) or overnight fasted mice (blue). (C) Graph showing the number of genes upregulated (green) and downregulated (blue) in response to an overnight fast in each cluster. Genes included were significantly differentially regulated (P < 0.05). (B–C) Cluster numbers listed down the left-hand side and the cell types of each cluster identified: N = neurons, O = Oligodendrocytes and OPCs, M = Microglia, E = Epithelial cells, A = Astrocytes. (D) A tSNE displaying a subset of oligodendrocyte nuclei (not including the OPC cluster), revealing the nutritional status of each cell (ad libitum in pink, fasted in blue). (E) Relative expression levels of top differentially expressed genes within the oligodendrocyte subset, displayed as feature plots. (F) Top 10 canonical pathways affected by an overnight fast in the oligodendrocyte population. A negative z-score represents an overall downregulation of the pathway, and a positive z score represents an overall upregulation of the pathway in the fasted state. Genes involved in each pathway whose expression was differentially regulated were highlighted for each pathway.
Figure 3
Figure 3
Characterisation of GLP1R expression in AP and NTS neurons. (A) Feature plot revealing relative expression levels of Glp1r in the 30 neuronal clusters. (B) tSNE plot of the 173 GLP1R neurons, grouped into 3 clusters. (C) Violin plots showing relative expression levels of 2 marker genes for each cluster of the GLP1R subset. The highest relative expression value for each gene is displayed on the left of the plot. (D) Heatmaps profiling the expression of canonical neuronal markers in each GLP1R cluster. Left: Average relative expression level in each cluster; Middle: Differential expression of each gene per cluster (LogFC values); Right: Determining whether gene expression was significantly changed in the fasted state. (E–G) Feature plots showing relative expression levels of Calcr (E), Gfral (F), and Gipr (G) in the GLP1R subset. (H) Graph showing the number of genes upregulated (green) and downregulated (blue) in response to an overnight fast in each cluster. Genes included were significantly differentially regulated (P < 0.05).
Figure 4
Figure 4
GIPR is expressed in neuronal and non-neuronal cells within the mouse AP and NTS. (A) Feature plot displaying the relative expression levels of Gipr in the overall dataset. (B) tSNE plot of the 436 GIPR cells, which grouped into 4 clusters. (C) Violin plots showing relative expression levels of 2 marker genes for each cluster of the GIPR subset. (D–E) Heatmaps profiling the expression of canonical neuronal (D) and oligodendrocyte (E) markers in each GIPR cluster. Left: Average relative expression level in each cluster; Middle: Differential expression of each gene per cluster (LogFC values); Right: Identifying whether gene expression was significantly changed in the fasted state. (F) Graph showing the number of genes upregulated (green) and downregulated (blue) in response to an overnight fast in each cluster. Genes included were significantly differentially regulated (P < 0.05).
Figure 5
Figure 5
Profiling CALCR neurons in the AP and NTS. (A) Feature plot revealing relative expression levels of Calcr in the neuronal clusters. (B) tSNE plot of the 185 CALCR neurons, grouped into 3 clusters. (C) Violin plots showing relative expression levels of 2 marker genes for each cluster of the CALCR neurons. (D) Feature plots showing the relative expression levels of Ramp1, Ramp2 and Ramp3 in the CALCR subset. (E) Heatmaps profiling the expression of canonical neuronal markers in each CALCR cluster. Left: Average relative expression level in each cluster; Middle: Differential expression of each gene per cluster (LogFC values); Right: Determining whether gene expression was significantly changed in the fasted state. (F) Graph showing the number of genes upregulated (green) and downregulated (blue) in response to an overnight fast in each cluster. Genes included were significantly differentially regulated (P < 0.05).
Figure 6
Figure 6
Characterising GFRAL neurons in the AP and NTS. (A) Feature plot of Gfral expression in the neuronal dataset. (B) tSNE plot of the 114 GFRAL neurons, grouped into 2 clusters. (C) Violin plots showing relative expression levels of marker genes for both GFRAL clusters. (D) Heatmaps profiling the expression of canonical neuronal markers in both GFRAL clusters. Left: Average relative expression level in each cluster; Middle: Differential expression of each gene per cluster (LogFC values); Right: Determining whether gene expression was significantly changed in the fasted state. (E) Graph showing the number of genes upregulated (green) and downregulated (blue) in response to an overnight fast in both clusters. Genes included were significantly differentially regulated (P < 0.05).
Figure 7
Figure 7
Characterising POMC cells in the AP and NTS. (A) Feature plot showing relative expression levels of Pomc in the overall dataset. (B) tSNE plot of the 346 POMC nuclei, grouped into 4 clusters. (C) Violin plots showing relative expression levels of marker genes for each cluster of the POMC subset. (D) The relative expression levels of Pcsk1 and Pcsk1 in the POMC subset. (E) Table displaying the number (and percentage) of Pomc neurons expressing Lepr, Cckar, Cckbr, Mc3r and Mc4r in each of the neuronal clusters, and total expression numbers in the neuronal clusters. (F) Graph showing the number of genes upregulated (green) and downregulated (blue) in response to an overnight fast in each cluster. Genes included were significantly differentially regulated (P < 0.05). (G-H) Heatmaps profiling the expression of canonical neuronal (G) and oligodendrocyte (H) markers in each POMC cluster. Left: Average relative expression level in each cluster; Middle: Differential expression of each gene per cluster (LogFC values); Right: Determining whether gene expression was significantly changed in the fasted state.

References

    1. Price C.J., Hoyda T.D., Ferguson A.V. The area postrema: a brain monitor and integrator of systemic autonomic state. The Neuroscientist. 2007;14(2):182–194. - PubMed
    1. Gasparini S., Howland J.M., Thatcher A.J., Geerling J.C. Central afferents to the nucleus of the solitary tract in rats and mice. Journal of Comparative Neurology. 2020;528(16):2708–2728. - PMC - PubMed
    1. Grill H.J., Hayes M.R. Hindbrain neurons as an essential hub in the neuroanatomically distributed control of energy balance. Cell Metabolism. 2012;16(3):296–309. - PMC - PubMed
    1. Pi-Sunyer X., Astrup A., Fujioka K., Greenway F., Halpern A., Krempf M. A randomized, controlled trial of 3.0 mg of liraglutide in weight management. New England Journal of Medicine. 2015;373(1):11–22. - PubMed
    1. Wilding J.P.H., Batterham R.L., Calanna S., Davies M., Van Gaal L.F., Lingvay I. Once-weekly semaglutide in adults with overweight or obesity. New England Journal of Medicine. 2021 - PubMed

Publication types