Prognostic value of members of NFAT family for pan-cancer and a prediction model based on NFAT2 in bladder cancer
- PMID: 33962392
- PMCID: PMC8202856
- DOI: 10.18632/aging.202982
Prognostic value of members of NFAT family for pan-cancer and a prediction model based on NFAT2 in bladder cancer
Abstract
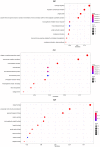
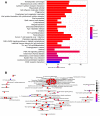
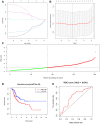
Bladder cancer (BLCA) is one of the common malignant tumors of the urinary system. The poor prognosis of BLCA patients is due to the lack of early diagnosis and disease recurrence after treatment. Increasing evidence suggests that gene products of the nuclear factor of activated T-cells (NFAT) family are involved in BLCA progression and subsequent interaction(s) with immune surveillance. In this study, we carried out a pan-cancer analysis of the NFAT family and found that NFAT2 is an independent prognostic factor for BLCA. We then screened for differentially expressed genes (DEGs) and further analyzed such candidate gene loci using gene ontology enrichment to curate the KEGG database. We then used Lasso and multivariate Cox regression to identify 4 gene loci (FER1L4, RNF128, EPHB6, and FN1) which were screened together with NFAT2 to construct a prognostic model based on using Kaplan-Meier analysis to predict the overall survival of BLCA patients. Moreover, the accuracy of our proposed model is supported by deposited datasets in the Gene Expression Omnibus (GEO) database. Finally, a nomogram of this prognosis model for BLCA was established which could help to provide better disease management and treatment.
Keywords: NFAT; bladder cancer; nomogram; overall survival; prognostic risk score.
Conflict of interest statement
Figures


Similar articles
-
Construction of a novel mRNA-signature prediction model for prognosis of bladder cancer based on a statistical analysis.BMC Cancer. 2021 Jul 27;21(1):858. doi: 10.1186/s12885-021-08611-z. BMC Cancer. 2021. PMID: 34315402 Free PMC article.
-
The construction and validation of an RNA binding protein-related prognostic model for bladder cancer.BMC Cancer. 2021 Mar 8;21(1):244. doi: 10.1186/s12885-021-07930-5. BMC Cancer. 2021. PMID: 33685397 Free PMC article.
-
Development and validation of a novel lipid metabolism-related gene prognostic signature and candidate drugs for patients with bladder cancer.Lipids Health Dis. 2021 Oct 27;20(1):146. doi: 10.1186/s12944-021-01554-1. Lipids Health Dis. 2021. PMID: 34706720 Free PMC article.
-
A co-expression network for differentially expressed genes in bladder cancer and a risk score model for predicting survival.Hereditas. 2019 Jul 9;156:24. doi: 10.1186/s41065-019-0100-1. eCollection 2019. Hereditas. 2019. PMID: 31333338 Free PMC article.
-
Screening and Identification of Key Biomarkers for Bladder Cancer: A Study Based on TCGA and GEO Data.Biomed Res Int. 2020 Jan 23;2020:8283401. doi: 10.1155/2020/8283401. eCollection 2020. Biomed Res Int. 2020. PMID: 32047816 Free PMC article.
Cited by
-
SAFB2 Inhibits the Progression of Breast Cancer by Suppressing the Wnt/β-Catenin Signaling Pathway via NFAT5.Mol Biotechnol. 2023 Sep;65(9):1465-1475. doi: 10.1007/s12033-022-00649-z. Epub 2023 Jan 18. Mol Biotechnol. 2023. PMID: 36652182
-
CENPA regulates tumor stemness in lung adenocarcinoma.Aging (Albany NY). 2022 Jul 11;14(13):5537-5553. doi: 10.18632/aging.204167. Epub 2022 Jul 11. Aging (Albany NY). 2022. PMID: 35816352 Free PMC article.
-
NFAT2 Induces Tumor Cell Proliferation and Metastasis by Acting as a Transcriptional Co-activator of the TGF-β1/SMAD Signaling Pathway and Inducing the Epithelial-Mesenchymal Transition in Liver Cancer.Dig Dis Sci. 2025 May;70(5):1799-1812. doi: 10.1007/s10620-025-08890-7. Epub 2025 Mar 4. Dig Dis Sci. 2025. PMID: 40038210
-
Towards precision medicine strategies using plasma proteomic profiling for suspected gallbladder cancer: A pilot study.JHEP Rep. 2025 Feb 21;7(6):101365. doi: 10.1016/j.jhepr.2025.101365. eCollection 2025 Jun. JHEP Rep. 2025. PMID: 40470116 Free PMC article.
-
Long Non-Coding RNAs as Novel Targets for Phytochemicals to Cease Cancer Metastasis.Molecules. 2023 Jan 18;28(3):987. doi: 10.3390/molecules28030987. Molecules. 2023. PMID: 36770654 Free PMC article. Review.
References
-
- Babjuk M, Böhle A, Burger M, Capoun O, Cohen D, Compérat EM, Hernández V, Kaasinen E, Palou J, Rouprêt M, van Rhijn BW, Shariat SF, Soukup V, et al.. EAU Guidelines on Non-Muscle-invasive Urothelial Carcinoma of the Bladder: Update 2016. Eur Urol. 2017; 71:447–61. 10.1016/j.eururo.2016.05.041 - DOI - PubMed
Publication types
MeSH terms
Substances
LinkOut - more resources
Full Text Sources
Other Literature Sources
Medical
Miscellaneous

