

Characterizing all-cause excess mortality patterns during COVID-19 pandemic in Mexico
- PMID: 33962563
- PMCID: PMC8104040
- DOI: 10.1186/s12879-021-06122-7
Characterizing all-cause excess mortality patterns during COVID-19 pandemic in Mexico
Abstract
Background: Low testing rates and delays in reporting hinder the estimation of the mortality burden associated with the COVID-19 pandemic. During a public health emergency, estimating all cause excess deaths above an expected level of death can provide a more reliable picture of the mortality burden. Here, we aim to estimate the absolute and relative mortality impact of COVID-19 pandemic in Mexico.
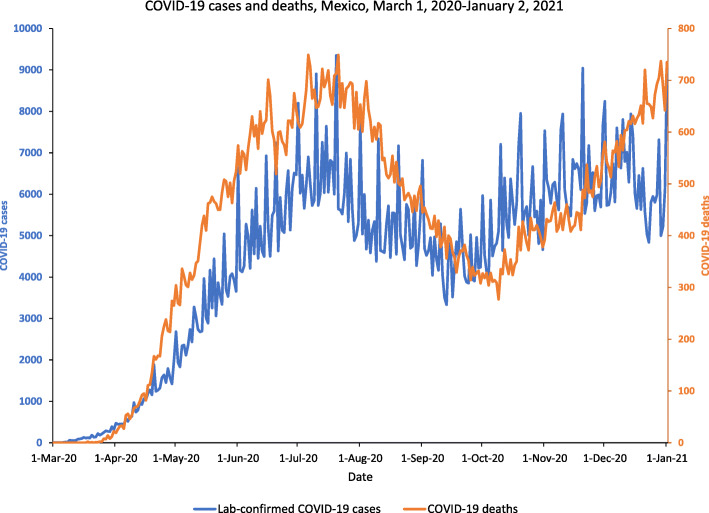
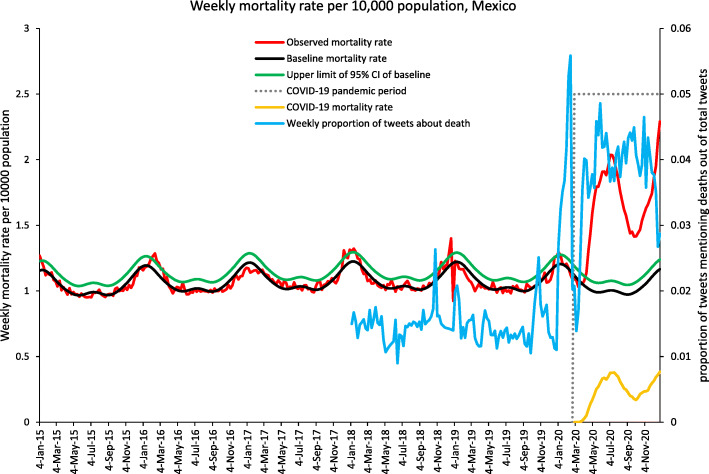
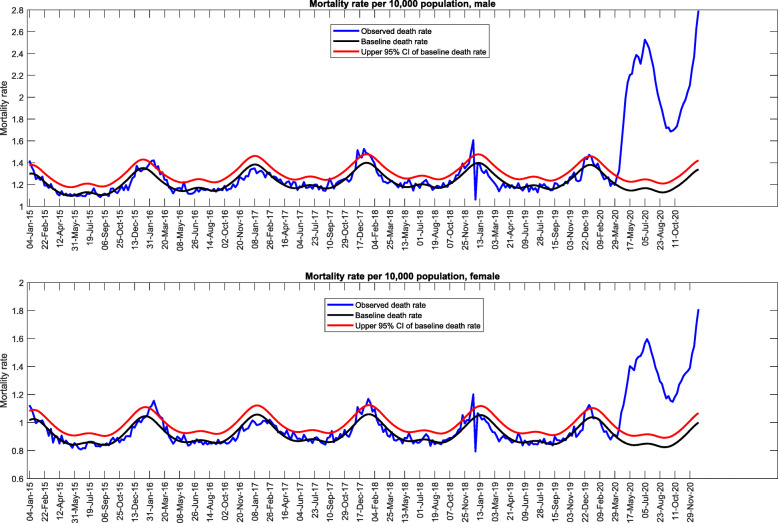
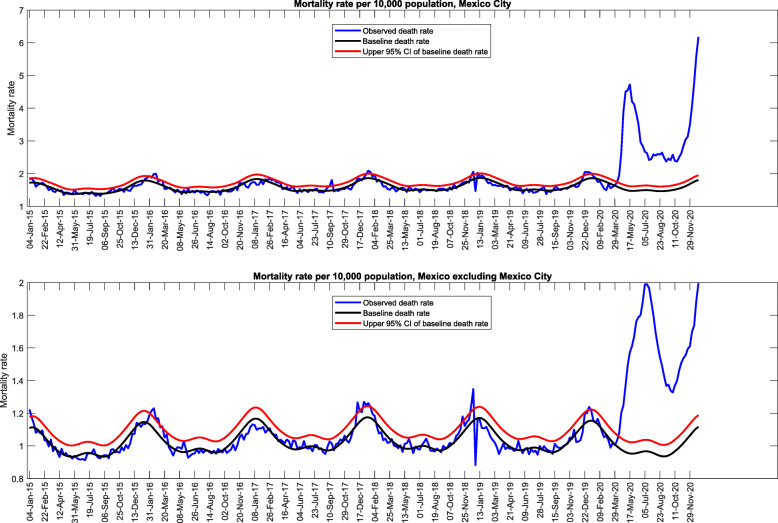
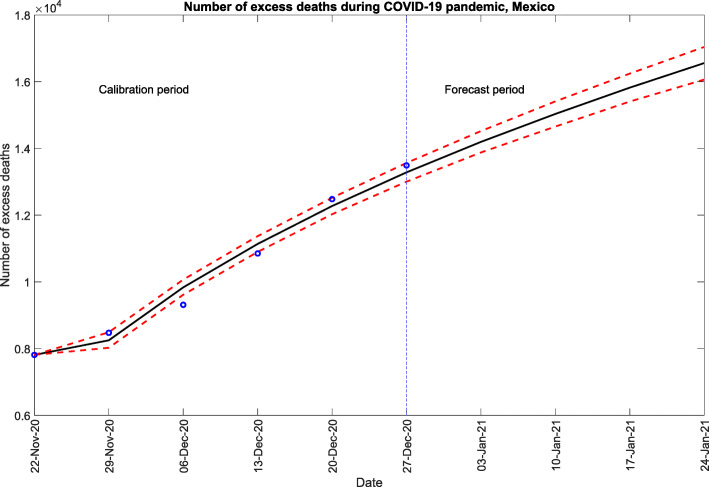
Methods: We obtained weekly mortality time series due to all causes for Mexico, and by gender, and geographic region from 2015 to 2020. We also compiled surveillance data on COVID-19 cases and deaths to assess the timing and intensity of the pandemic and assembled weekly series of the proportion of tweets about 'death' from Mexico to assess the correlation between people's media interaction about 'death' and the rise in pandemic deaths. We estimated all-cause excess mortality rates and mortality rate ratio increase over baseline by fitting Serfling regression models and forecasted the total excess deaths for Mexico for the first 4 weeks of 2021 using the generalized logistic growth model.
Results: We estimated the all-cause excess mortality rate associated with the COVID-19 pandemic in Mexico in 2020 at 26.10 per 10,000 population, which corresponds to 333,538 excess deaths. Males had about 2-fold higher excess mortality rate (33.99) compared to females (18.53). Mexico City reported the highest excess death rate (63.54) and RR (2.09) compared to rest of the country (excess rate = 23.25, RR = 1.62). While COVID-19 deaths accounted for only 38.64% of total excess deaths in Mexico, our forecast estimate that Mexico has accumulated a total of ~ 61,610 [95% PI: 60,003, 63,216] excess deaths in the first 4 weeks of 2021. Proportion of tweets was significantly correlated with the excess mortality (ρ = 0.508 [95% CI: 0.245, 0.701], p-value = 0.0004).
Conclusion: The COVID-19 pandemic has heavily affected Mexico. The lab-confirmed COVID-19 deaths accounted for only 38.64% of total all cause excess deaths (333,538) in Mexico in 2020. This reflects either the effect of low testing rates in Mexico, or the surge in number of deaths due to other causes during the pandemic. A model-based forecast indicates that an average of 61,610 excess deaths have occurred in January 2021.
Keywords: 2020; All-cause mortality; COVID-19; Excess mortality; Mexico; Pandemic.
Conflict of interest statement
The authors declare that they have no competing interest.
Figures
References
-
- WHO Coronavirus (COVID-19) dashboard [https://covid19.who.int/ ].
-
- Number of people living in poverty in Mexico between 2008 and 2018 (in millions) [https://www.statista.com/statistics/1039479/mexico-people-living-poverty/].
-
- Ortega RP: Mexico’s coronavirus czar faces criticism as COVID-19 surges In: Science. December 9 2020. [https://www.sciencemag.org/news/2020/12/mexico-s-coronavirus-czar-faces-...].
MeSH terms
Grants and funding
LinkOut - more resources
Full Text Sources
Other Literature Sources
Medical
Research Materials
Miscellaneous
