. 2021 May 7;9(1):104.
doi: 10.1186/s40168-021-01052-7.

Iron status influences non-alcoholic fatty liver disease in obesity through the gut microbiome

Affiliations

Iron status influences non-alcoholic fatty liver disease in obesity through the gut microbiome

Jordi Mayneris-Perxachs et al. Microbiome. .

Abstract

Background: The gut microbiome and iron status are known to play a role in the pathophysiology of non-alcoholic fatty liver disease (NAFLD), although their complex interaction remains unclear.

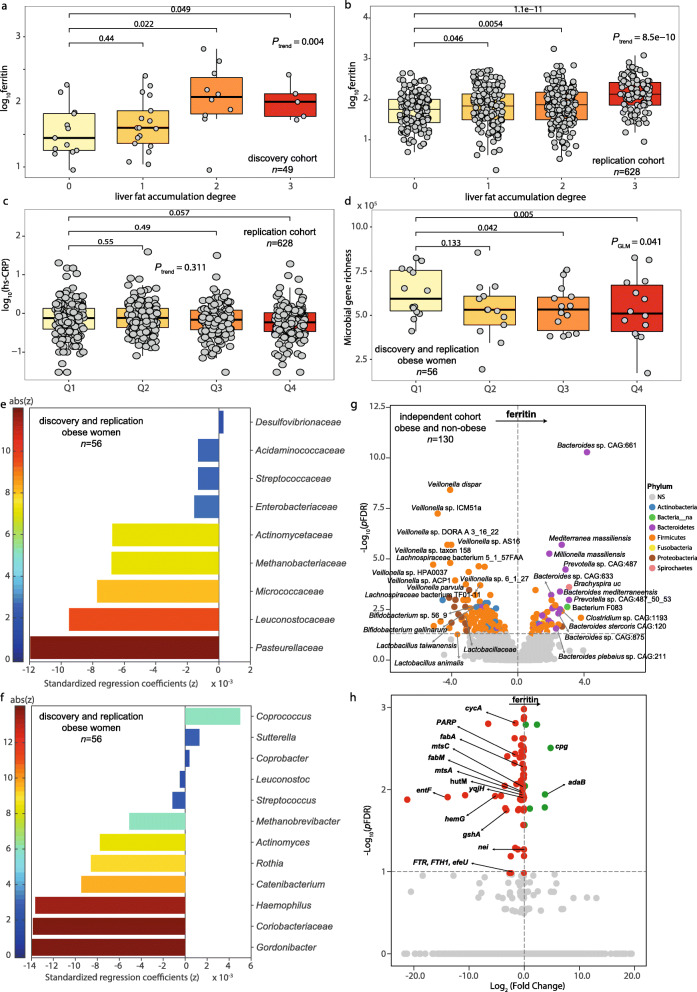
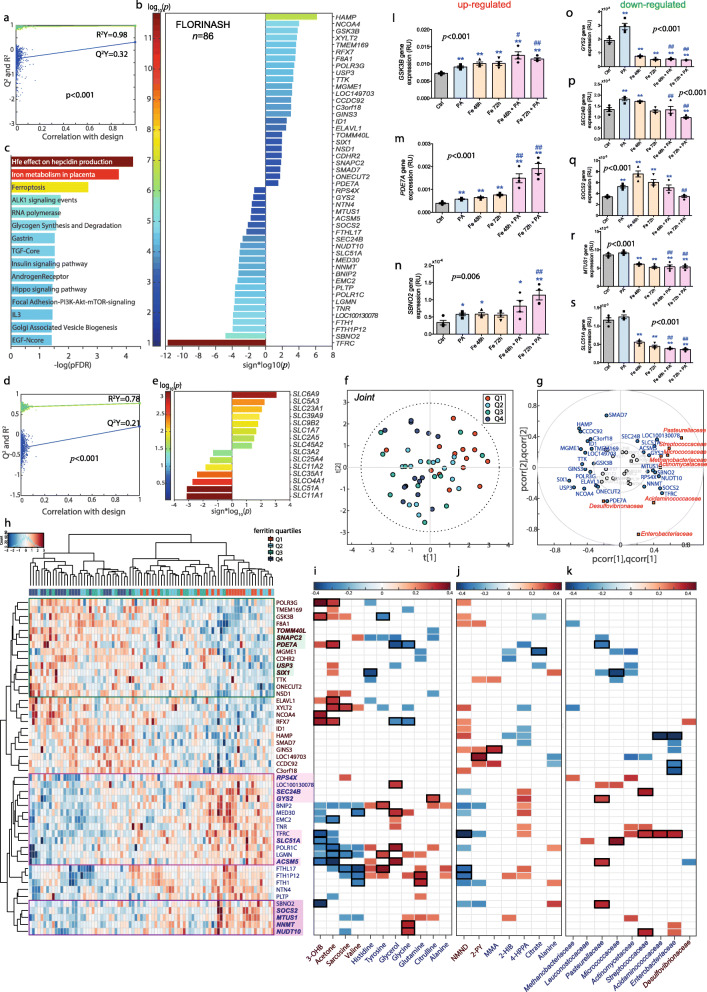
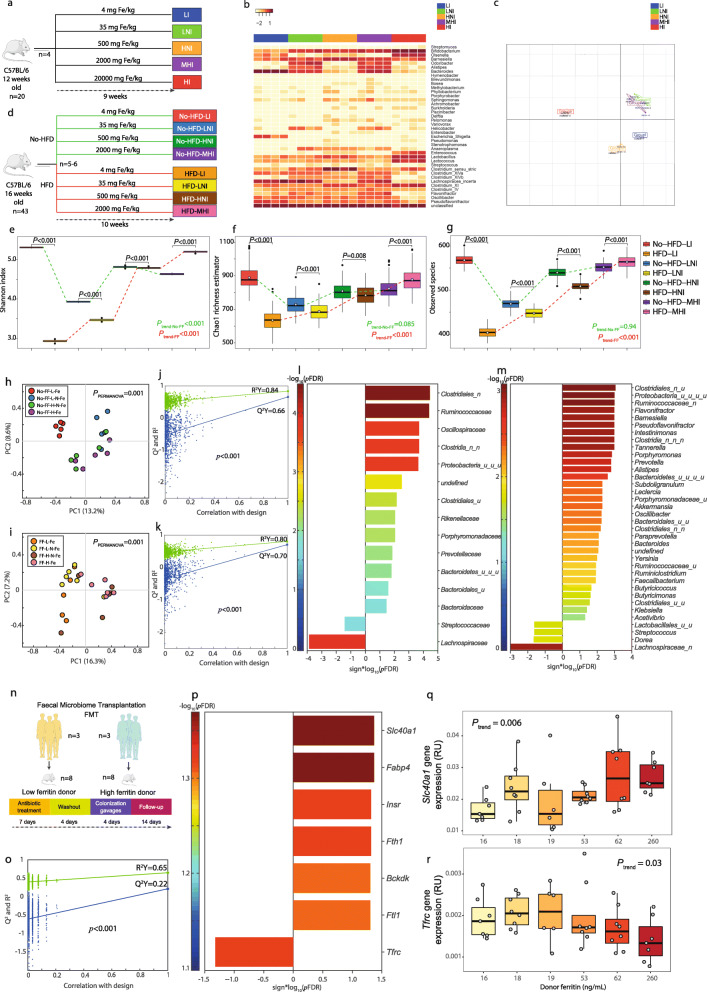
Results: Here, we applied an integrative systems medicine approach (faecal metagenomics, plasma and urine metabolomics, hepatic transcriptomics) in 2 well-characterised human cohorts of subjects with obesity (discovery n = 49 and validation n = 628) and an independent cohort formed by both individuals with and without obesity (n = 130), combined with in vitro and animal models. Serum ferritin levels, as a markers of liver iron stores, were positively associated with liver fat accumulation in parallel with lower gut microbial gene richness, composition and functionality. Specifically, ferritin had strong negative associations with the Pasteurellaceae, Leuconostocaceae and Micrococcaea families. It also had consistent negative associations with several Veillonella, Bifidobacterium and Lactobacillus species, but positive associations with Bacteroides and Prevotella spp. Notably, the ferritin-associated bacterial families had a strong correlation with iron-related liver genes. In addition, several bacterial functions related to iron metabolism (transport, chelation, heme and siderophore biosynthesis) and NAFLD (fatty acid and glutathione biosynthesis) were also associated with the host serum ferritin levels. This iron-related microbiome signature was linked to a transcriptomic and metabolomic signature associated to the degree of liver fat accumulation through hepatic glucose metabolism. In particular, we found a consistent association among serum ferritin, Pasteurellaceae and Micrococcacea families, bacterial functions involved in histidine transport, the host circulating histidine levels and the liver expression of GYS2 and SEC24B. Serum ferritin was also related to bacterial glycine transporters, the host glycine serum levels and the liver expression of glycine transporters. The transcriptomic findings were replicated in human primary hepatocytes, where iron supplementation also led to triglycerides accumulation and induced the expression of lipid and iron metabolism genes in synergy with palmitic acid. We further explored the direct impact of the microbiome on iron metabolism and liver fact accumulation through transplantation of faecal microbiota into recipient's mice. In line with the results in humans, transplantation from 'high ferritin donors' resulted in alterations in several genes related to iron metabolism and fatty acid accumulation in recipient's mice.

Conclusions: Altogether, a significant interplay among the gut microbiome, iron status and liver fat accumulation is revealed, with potential significance for target therapies. Video abstract.

Keywords: Ferritin; Gut microbiome; Iron status; Metagenomics; Non-alcoholic fatty liver disease; Obesity; Shotgun sequencing; Systems medicine.


Conflict of interest statement

The authors declare that they have no competing interests.

Figures

Fig. 1
Fig. 1
Association of serum ferritin with liver fat accumulation, gene richness and the gut microbiome composition. Association of serum ferritin with degree of liver fat accumulation in a the discovery and b replication cohorts (Mann-Kendall trend test and Wilcoxon tests). c Association of hs-CRP with serum ferritin quartiles in the replication cohort (Mann-Kendall trend test and Wilcoxon tests). d Association of microbial gene richness with ferritin quartiles in a subsample of obese women from the discovery and replication cohorts (generalized linear model GLM). e Bacterial families and f genera associated with serum ferritin in a subsample of obese women from the discovery and replication cohorts. Mnet penalized regression models were built on bacterial data including age, BMI, country and hs-CRP as covariates. g Volcano plot of differential bacterial abundance and h metagenome KEGG functions associated with ferritin as calculated from shotgun metagenomic sequencing in an independent cohort of obese and non-obese subjects, adjusting for age, BMI, sex and hs-CRP. Significantly different taxa are coloured according to phylum. adaB, methylated-DNA-[protein]-cysteine S-methyltransferase; cpg; glutamate carboxypeptidase; cycA; d-serine/d-alanine/glycine transporter; fabA, 3-hydroxyacyl-[acyl-carrier protein] dehydratase/trans-2-decenoyl-[acyl-carrier protein] isomerase; fabM; trans-2-decenoyl-[acyl-carrier protein] isomerase; gshA, glutamate-cysteine ligase; nei endonuclease VIII; entF, enterobactin synthetase component F; FTR, FTH1, efeU, high-affinity iron transporter; hemG; menaquinone-dependent protoporphyrinogen oxidase; hutM, histidine permease; mtsC; iron/zinc/manganese/copper transport system permease protein; mtsA; iron/zinc/manganese/copper transport system substrate-binding protein; PARP, poly [ADP-ribose] polymerase; seqA; negative modulator of initiation of replication; yqjH, ferric-chelate reductase (NADPH)
Fig. 2
Fig. 2
Association of transcriptomic data with serum ferritin. a Permutation test for the goodness-of-fit (R2Y) and goodness of prediction (Q2Y) obtained from the O-PLS model between serum ferritin and hepatic transcriptome in a subsample of the discovery and replication cohorts from Italy and Spain (n = 86). b Significant transcripts associated with serum ferritin after further validation of the O-PLS significant variables by pSC adjusting for age, sex, BMI and country. c Pathways significantly associated with serum ferritin based on mapping associated transcripts by over-representation analysis with hypergeometric test. d Permutation tests for the O-PLS model between serum ferritin and SLCs (n = 86). e Significant SLCs associated with serum ferritin after further validation of the O-PLS results by pSC adjusting for age, sex, BMI, and country. f O2-PLS scores for the joint variation between microbial families and genes associated with serum ferritin. A model with 2 predictive components, and 1 orthogonal component for the genes and bacterial families blocks, was constructed based on 7-fold cross-validation. g O2-PLS joint loadings plots, where pcorr represents the correlation-scaled loadings from the gene block and qcorr represents the correlation-scaled loadings from the bacterial families block. h Heatmap displaying z-scores of the ferritin-associated transcripts for each subject. Clustering was based on Euclidean distances and Ward linkage. Genes associated with liver fat accumulation from O-PLS modelling are highlighted in bold, whereas those associated with bacterial families from O2-PLS modelling are highlighted in colour boxes. i Heatmap for the pSC adjusted by age, BMI, sex, and country between ferritin-associated plasma and j urine metabolites with ferritin-associated transcripts (n = 86). k Significant (p < 0.05) pSC adjusted for age, BMI and country, between ferritin-associated families and transcripts (n = 56). Only significant associations (p < 0.05) are displayed. Significant associations after a pFDR correction (pFDR < 0.05) are highlighted with a black box. l–n Expression of upregulated (GSK3B, PDE7A, SBNO2) and os downregulated genes (GYS2, SEC24B, SOCS2, MTUS1 and SLC51A) in human primary hepatocytes after treatment with iron and palmitic acid. Data are mean ± SEM. Comparisons by one-way ANOVA. *p < 0.05, **p < 0.01, ***p < 0.001 compared to control group based on t test. #p < 0.05, ##p < 0.01, ###p < 0.001 compared to PA group based on t test. Ctrl, control group; PA, palmitic acid; Fe48h, pre-treatment iron 50 μM for 48h; Fe72h, pre-treatment iron 50 μM for 72h; Fe48h + PA, pre-treatment iron 50 μM for 48h + palmitic acid 200 μM for 24 h; Fe72h + PA, pre-treatment iron 50 μM for 72 h + palmitic acid 200 μM for 24 h
Fig. 3
Fig. 3
Associations of metabolomic data with serum ferritin. Permutation tests for the goodness-of-fit (R2Y) and goodness of prediction (Q2Y) obtained from the O-PLS model between serum ferritin and a the serum (n = 48) and e urine metabolome (n = 47) in the discovery cohort, and b the serum (n = 328) and f urine metabolome (n = 322) in the replication cohort. Significant c, d serum and g, h urine metabolites associated with serum ferritin after further validation of O-PLS identified metabolites by pSC adjusting for age, sex, BMI and country. i O2-PLS scores for the joint variation between plasma and urine metabolites and microbial families associated with serum ferritin. A model with 2 predictive components, and 0 and 1 orthogonal component for the metabolites and bacterial families blocks, was constructed based on 7-fold cross-validation. j O2-PLS joint loadings plots, where pcorr represents the correlation-scaled loadings from the gene block and qcorr represents the correlation-scaled loadings from the bacterial families block. k Heatmap for the pSC adjusted by age, BMI and country between ferritin-associated urine and l plasma metabolites with ferritin-associated bacterial families (n = 56). Only significant associations (p < 0.05) are displayed. Significant associations after a pFDR correction (pFDR < 0.05) are highlighted with a black box
Fig. 4
Fig. 4
Validation studies in primary hepatocytes and FMT mice. a Scheme of the experimental design for study 1. Mice were fed for 9 weeks diets containing low- (LI), low-normal- (LNI), high-normal- (HNI), moderately high- (MHI) and high- (HI) iron doses. b Heatmap displaying genus relative abundances for each mouse. c Principal coordinate analysis (PCoA) depicting dissimilarities between groups based on unifrac distance metrics. d Scheme of the experimental design for study 2. Mice were fed either a high fat diet (HFD) or a no-HFD diet containing four different iron doses (LI, LNI, HNI, MHI) for 10 weeks. e Variations in the Shannon diversity index, f Chao1 richness estimator and g observed species of mice fed either a HFD or a no-HFD with different iron doses (LI, LNI, HNI, MHI). h PCoA based on Canberra distance metric for the no-HFD-fed mice and i the HFD-fed mice with different iron doses. Differences in microbial composition between iron doses for each diet were assessed by PERMANOVA using 999 permutations. j, k Permutation tests for the O-PLS models between iron dose and bacterial families or genera in HFD-fed mice, respectively. l Significant families and m genera identified from O-PLS regression loadings to be associated with iron dose. n Scheme of the experimental design for study 3. Low-ferritin (n = 3) and high-ferritin (n = 3) microbiota human donors were selected and for each donor their faecal samples were transplanted n = 6–8 mice after antibiotic treatment. After 14 days following colonization gavage mice were sacrificed and iron and liver fat accumulation-related genes (n = 22) were measured by PCR. o Permutation test for the O-PLS-DA model between mice genes and the human donor group (low- or high- ferritin). p Significant mouse genes associated with donor group from O-PLS-DA regression loadings. q Ferroportin (Slc40a1) and r Tfrc expression according to the donor ferritin concentration

Similar articles

Cited by

References

    1. Younossi ZM, Koenig AB, Abdelatif D, Fazel Y, Henry L, Wymer M. Global epidemiology of nonalcoholic fatty liver disease-meta-analytic assessment of prevalence, incidence, and outcomes. Hepatology. 2016;64(1):73–84. doi: 10.1002/hep.28431. - DOI - PubMed
    1. Pietrangelo A. Iron in NASH, chronic liver diseases and HCC: how much iron is too much? J Hepatol. 2009;50(2):249–251. doi: 10.1016/j.jhep.2008.11.011. - DOI - PubMed
    1. Vecchi C, Montosi G, Garuti C, Corradini E, Sabelli M, Canali S, et al. Gluconeogenic signals regulate iron homeostasis via hepcidin in mice. Gastroenterology. 2014;146(4):1060–1069. doi: 10.1053/j.gastro.2013.12.016. - DOI - PMC - PubMed
    1. Kowdley KV, Belt P, Wilson LA, Yeh MM, Neuschwander-Tetri BA, Chalasani N, et al. Serum ferritin is an independent predictor of histologic severity and advanced fibrosis in patients with nonalcoholic fatty liver disease. Hepatology. 2012;55(1):77–85. doi: 10.1002/hep.24706. - DOI - PMC - PubMed
    1. Hoyles L, Fernández-Real J-M, Federici M, Serino M, Abbott J, Charpentier J, et al. Molecular phenomics and metagenomics of hepatic steatosis in non-diabetic obese women. Nat Med. 2018;24(7):1070–1080. doi: 10.1038/s41591-018-0061-3. - DOI - PMC - PubMed

Publication types