. 2021 May 7;7(19):eabe0809.
doi: 10.1126/sciadv.abe0809. Print 2021 May.

A diverse member of the fungal Avr4 effector family interacts with de-esterified pectin in plant cell walls to disrupt their integrity

Affiliations

A diverse member of the fungal Avr4 effector family interacts with de-esterified pectin in plant cell walls to disrupt their integrity

Li-Hung Chen et al. Sci Adv. .

Abstract

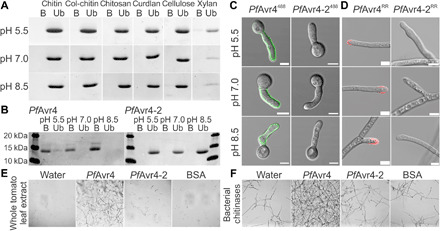
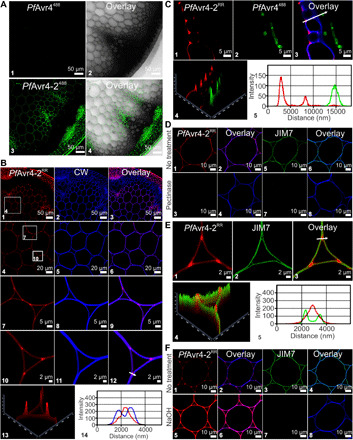
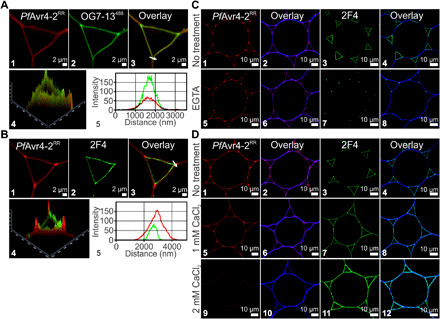
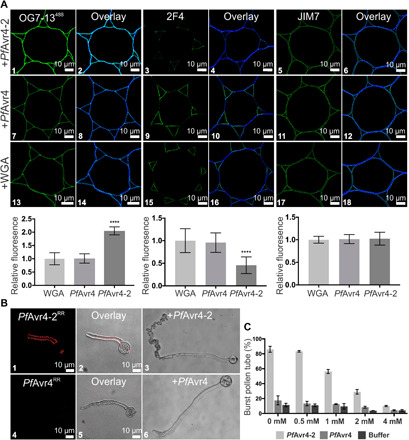
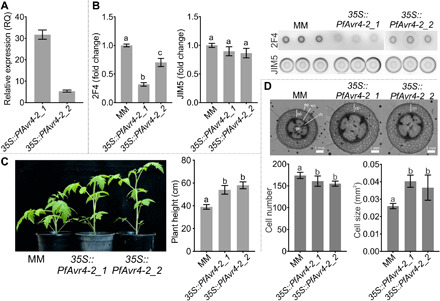
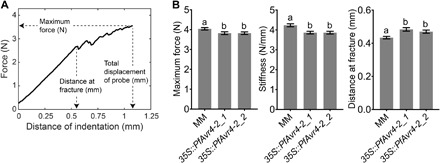
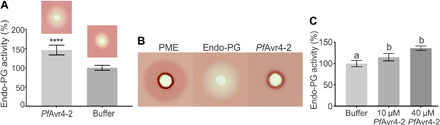
Effectors are small, secreted proteins that promote pathogen virulence. Although key to microbial infections, unlocking the intrinsic function of effectors remains a challenge. We have previously shown that members of the fungal Avr4 effector family use a carbohydrate-binding module of family 14 (CBM14) to bind chitin in fungal cell walls and protect them from host chitinases during infection. Here, we show that gene duplication in the Avr4 family produced an Avr4-2 paralog with a previously unknown effector function. Specifically, we functionally characterize PfAvr4-2, a paralog of PfAvr4 in the tomato pathogen Pseudocercospora fuligena, and show that although it contains a CBM14 domain, it does not bind chitin or protect fungi against chitinases. Instead, PfAvr4-2 interacts with highly de-esterified pectin in the plant's middle lamellae or primary cell walls and interferes with Ca2+-mediated cross-linking at cell-cell junction zones, thus loosening the plant cell wall structure and synergizing the activity of pathogen secreted endo-polygalacturonases.


Figures

Fig. 1
Fig. 1. PfAvr4-2 does not bind chitin or protects fungal hyphae against chitinases.
(A and B) In vitro polysaccharide precipitation assay testing binding of PfAvr4-2 to insoluble polysaccharides of fungal (chitin, colloidal chitin, chitosan, and curdlan) and plant (cellulose and xylan) origin (A) or binding of PfAvr4 (control) and PfAvr4-2 to shrimp shell chitin (B). Binding was tested at pH 5.5, pH 7.0, and pH 8.5. B, bound fraction; Ub, unbound fraction. (C and D) Localization of PfAvr4 and PfAvr4-2 conjugated to Alexa Fluor 488 (488) or Rhodamine Red (RR) on germlings of T. viride (C) and mycelia of P. fuligena (D), following their treatment with β-1,3-glucanases to remove the overlaying β-glucan layer in the fungal cell wall. White bars correspond to 5 μm. (E and F) In vitro assays testing whether PfAvr4 and PfAvr4-2 protect germlings of T. viride against plant-derived (E) and bacterial-derived (F) chitinases. Bovine serum albumin (BSA) is used as control.
Fig. 2
Fig. 2. PfAvr4-2 localizes to pectin-rich regions of the plant cell wall.
(A) Binding of PfAvr4488 and PfAvr4-2488 conjugated to Alexa Fluor 488 onto Arabidopsis stem cross section; only a quarter of the cross section is shown. (B) Dual labeling of Arabidopsis stem cross sections with PfAvr4-2RR conjugated to Rhodamine Red (RR) (red signal) and the cellulose-binding protein calcofluor white (CW) (blue signal). White boxes in (B1) and (B4) indicate the sections shown at higher magnification in succeeding panels. Panel (B13) is a 2.5D representation of (B10), whereas the fluorescence intensities of PfAvr4-2RR and CW at the region marked by an arrow in (B12) are shown in (B14). (C) Labeling with PfAvr4-2RR, PfAvr4488, and CW of cross sections of tomato leaves infected with P. fuligena and sampled at 9 days after inoculation. Panel (C4) is a 2.5D representation of (C3), whereas the fluorescence intensities of PfAvr4-2RR and PfAvr4488 at the region marked by an arrow in (C3) are shown in (C5). (D) Localization of PfAvr4-2RR, CW, and the JIM7 monoclonal antibody (mAb) on Arabidopsis stem cross sections before and after pectinase treatment. A secondary mAb conjugated to Alexa Fluor 488 is used for detecting JIM7. (E) Labeling of Arabidopsis stem cross sections with PfAvr4-2RR and JIM7. Cells are pith parenchyma and labeling was performed sequentially with the two probes. Panel (E10) is a 2.5D representation of (E9), whereas the fluorescence intensities of PfAvr4-2RR and JIM7 at the region marked by an arrow in (E9) are shown in (E11). (F) Labeling of the Arabidopsis stem cross sections with PfAvr4-2RR, CW, and JIM7 after pretreatment of the stem with NaOH to chemically de-esterify plant cell walls.
Fig. 3
Fig. 3. PfAvr4-2 competes with Ca2+ for binding to de-esterified homogalacturonan at junction zones.
(A) Labeling of cross sections of Arabidopsis stems with PfAvr4-2RR and the OG7-13488 probe. PfAvr4-2RR is conjugated to the red fluorochrome Rhodamine Red (RR), whereas the OG7-13488 probe is conjugated to the green fluorophore Alexa Fluor 488. Cells are pith parenchyma, and labeling was performed sequentially with the two probes. Panel (A4) is a 2.5D representation of (A3), whereas the fluorescence intensities of PfAvr4-2RR and the OG7-13488 probe at the corner of the tricellular junction marked by an arrow in (A3) are shown in (A5). (B) Labeling of cross sections of Arabidopsis stems with PfAvr4-2RR and the 2F4 mAb. A secondary mAb conjugated to the green fluorophore Alexa Fluor 488 was used for detecting the 2F4 mAb. Cells are pith parenchyma, and labeling was performed sequentially with the two probes. Panel (B4) is a 2.5D representation of (B3), whereas the fluorescence intensities of PfAvr4-2RR and the 2F4 mAb at the corner of the tricellular junction marked by an arrow in (B3) are shown in (B5). (C) Labeling of cross sections of Arabidopsis stems with PfAvr4-2RR, the 2F4 mAb, or CW (blue signal) after pretreatment of the stems with the Ca2+ chelating agent EGTA. Cells are pith parenchyma. (D) Labeling of Arabidopsis stem cross sections with PfAvr4-2RR, the 2F4 mAb, or CW in increasing calcium concentrations ([Ca2+]).
Fig. 4
Fig. 4. PfAvr4-2 can disrupt existing Ca2+-mediated cross-links formed between adjacent homogalacturonan chains.
(A) Labeling of cross sections of Arabidopsis stems with the OG7-13488 probe and the 2F4 and JIM7 monoclonal antibodies (mAbs) after pretreatment of the stems with 10 μM PfAvr4-2, PfAvr4, or WGA. The OG7-13488 probe is conjugated to the green fluorophore Alexa Fluor 488, whereas a secondary mAb also conjugated to Alexa Fluor 488 was used for detecting the 2F4 and JIM7 mAbs. Cells are pith parenchyma. Labeling with the OG7-13488 probe necessitates the addition of 1 mM Ca2+ in the labeling buffer. Bottom graphs show the fluorescence intensity of the OG7-13488 probe, the 2F4, and JIM7 mAbs, relative to WGA (signal set to 1.0). Error bars indicate SD (OG7-13488, n = 15; 2F4488, n = 20; JIM7, n = 12). Statistical differences between PfAvr4-2 and other treatments were determined by ANOVA using Tukey’s test. ****P < 0.0001. (B) Microscope images of germinating pollen tubes of tomato incubated at increasing calcium concentrations ([Ca2+]) with PfAvr4-2RR or PfAvr4RR conjugated to the red fluorochrome Rhodamine Red (RR). Shown are the images where 1 mM CaCl2·2H2O was used in the labeling buffer. (C) Effect of PfAvr4-2, PfAvr4, and a buffer control under increasing [Ca2+] on bursting of tomato pollen tubes. The experiment was repeated in triplicate, and 100 pollen tubes were counted in each of the replicates. Error bars indicate SD from three replicates.
Fig. 5
Fig. 5. The 35S::PfAvr4-2 transgenic tomato plants have altered anatomical characteristics.
(A) PfAvr4-2 expression levels in the two 35S::PfAvr4-2 tomato lines (35S::PfAvr4-2_1 and 35S::PfAvr4-2_2), relative to the tomato RLP2 gene (set to 1.0 RQ). Error bars indicate SD from six samples. (B) immunodot blot analysis of Ca2+-mediated cross-linked homogalacturonan and of pectin extracted from the cell walls of 6-week-old plants. An equal amount of 33 μg of Ca2+-mediated cross-linked homogalacturonan or of pectin was spotted on each dot and probed with the 2F4 or JIM5 monoclonal antibodies, respectively. Bars indicate signal intensity, error bars are SD from minimum nine spots per line, and letters are significant differences based on a Tukey’s test (α = 0.05). (C) Height of 6-week-old 35S::PfAvr4-2 and control cv. Moneymaker (MM) plants. Bars represent the average height of seven plants per line, error bars are SD, and letters are significant differences based on a Tukey’s test (α = 0.05). (D) Cell size and cell number comparisons between the 35S::PfAvr4-2 and control Moneymaker plants in stem cross sections made at 1 cm from the crown base. Main anatomical features are indicated; ep, epidermis; co, cortex; en, endodermis; vb, vascular bundle (xylem-cambium-phloem); pi, pith. Bars represent the average cell number or size in the cortex of 2-week-old plants per line. Cell numbers were quantified by measuring the number of the cells in the cortex of seven plants, and cell size was quantified by measuring the area of the cortex and dividing it by the number of cells. Error bars indicate SD and letters are significant differences based on a Tukey’s test (α = 0.05). Photo credit: Li-Hung Chen, University of California, Davis.
Fig. 6
Fig. 6. The 35S::PfAvr4-2 transgenic tomato plants have altered textural characteristics.
(A) Exemplary texture curve showing the parameters that were defined using texture analysis. The textural properties of the petioles were tested by an indentation test. Parameters measured were “maximum force (in newton),” which refers to the maximum normal force exerted by the petiole on the probe during the test; “distance at fracture (in millimeter),” which refers to the displacement of the probe when the first significant fracture (breakage) of the tissue occurred; and “stiffness (in newton per millimeter),” which refers to the maximum force (in newton) achieved during the test divided by the total distance traveled by the probe (in millimeter) (achieved at 33% strain). (B) Textural properties of the two 35S::PfAvr4-2–expressing lines (35S::PfAvr4-2_1 and 35S::PfAvr4-2_2) and the control cv. Moneymaker (MM) tomato line, as measured with the indentation test. Bars show that maximum force and stiffness, which positively correlate with tissue firmness, and the distance at fracture, which indicates the extent to which the tissue can be deformed before fracture occurs. Error bars indicate SD and were obtained from performing indentation tests at four equally distanced sites per petiole. At least 29 petioles were tested for each line (resulting in a minimum of 115 total compression tests per line). Letters show significant differences based on a Tukey’s test (α = 0.05).
Fig. 7
Fig. 7. PfAvr4-2 is a virulence factor.
(A) Disease symptoms at 15 days post inoculation (dpi) induced by P. fuligena on leaves of the 35S::PfAvr4-2 tomato lines (35S::PfAvr4-2_1 and 35S::PfAvr4-2_2) and the control cv. Moneymaker (MM) line. (B) Magnification of the sections marked by white boxes in (A). (C) Quantification (9 dpi) of P. fuligena biomass in leaves of the 35S::PfAvr4-2 plants relative to its biomass in leaves of Moneymaker (set to 1.0). Error bars indicate SEM from three assays and letters significant differences based on a Tukey’s test (α = 0.05). (D) Infection lesions (3 dpi) of B. cinerea on leaves of Moneymaker and 35S::PfAvr4-2 plants. (E) Mean diameter of the infection lesions produced on the 35S::PfAvr4-2 plants relative to the Moneymaker line (set to 1.0). Error bars indicate SD in lesion diameters from three assays and ten leaves per line. Letters show significant differences based on a Tukey’s test (α = 0.05). (F) In vitro and in planta PfAvr4-2 expression levels, relative to the P. fuligena GAPDH gene (set to 1.0 RQ). Shown are average RQ values from two inoculation assays on the Moneymaker line. Error bars indicate SE from four qPCRs. (G) Virulence (15 dpi) of a wild-type (WT) P. fuligena and of two PfAvr4-2 deletion mutants (∆PfAvr4-2_1 and ∆PfAvr4-2_2) on Moneymaker plants. (H) Quantification of fungal biomass in tomato leaves infected with the ∆PfAvr4-2 mutants, relative to the biomass of the wild-type (WT) strain (set to 1.0 RQ). Error bars indicate SEs from three virulence assays. Letters show significant differences based on a Tukey’s test (α = 0.05). Photo credit: Li-Hung Chen, University of California, Davis.
Fig. 8
Fig. 8. PfAvr4-2 enhances the activity of fungal endo-PGs.
(A) Relative quantification of fungal endo-PG activity in the presence of PfAvr4-2 using the PECTOPLATE. The bar graph shows relative quantification based on the intensity of Ruthenium Red staining around the inoculation wells of endo-PG activity when the enzyme is applied alone or in a mixture with PfAvr4-2. Experiments were done in triplicate, and the intensity of the fuchsia-colored halo produced by the activity of the endo-PG is set to 100%. Error bars indicate SD from the three experiments. Student’s t test was used to evaluate statistical significance of the difference between the two treatments. ****P < 0.001. The images above the bars provide a visual representation of the results. (B) Visual representation of the PECTOPLATE radial diffusion assay used to compare the pectin-related enzymatic activity of PME, endo-PG, and PfAvr4-2. The enzymatic activity of the three pectin-related proteins is assessed on the basis of the size of the fuchsia-stained haloes in the PECTOPLATE. (C) Relative quantification of endo-PG activity in the presence of increasing amounts of PfAvr4-2. The enzymatic activity of endo-PG was monitored by measuring using 2-cyanoacetamide, the amount of oligogalacturonides (OGs) released in the buffer. The activity of endo-PG alone was set to 100%, and the activity of the enzyme in mixtures with different amounts of PfAvr4-2 was expressed relative to this activity. Experiments were done in triplicate, and error bars indicate SD. Treatments with the same letter were not significantly different by a Tukey’s test (α = 0.05).

Similar articles

Cited by

References

    1. Jones J. D. G., Dangl J. L., The plant immune system. Nature 444, 323–329 (2006). - PubMed
    1. Bacete L., Mélida H., Miedes E., Molina A., Plant cell wall-mediated immunity: Cell wall changes trigger disease resistance responses. Plant J. 93, 614–636 (2018). - PubMed
    1. De Lorenzo G., Ferrari S., Giovannoni M., Mattei B., Cervone F., Cell wall traits that influence plant development, immunity, and bioconversion. Plant J. 97, 134–147 (2019). - PubMed
    1. Caffall K. H., Mohnen D., The structure, function, and biosynthesis of plant cell wall pectic polysaccharides. Carbohydr. Res. 344, 1879–1900 (2009). - PubMed
    1. Sénéchal F., Wattier C., Rustérucci C., Pelloux J., Homogalacturonan-modifying enzymes: Structure, expression, and roles in plants. J. Exp. Bot. 65, 5125–5160 (2014). - PMC - PubMed

Publication types