. 2021 May 7;7(19):eabe2584.
doi: 10.1126/sciadv.abe2584. Print 2021 May.

The impact of relaxing interventions on human contact patterns and SARS-CoV-2 transmission in China

Affiliations

The impact of relaxing interventions on human contact patterns and SARS-CoV-2 transmission in China

Juanjuan Zhang et al. Sci Adv. .

Abstract

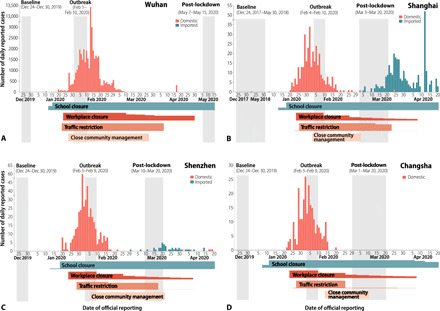
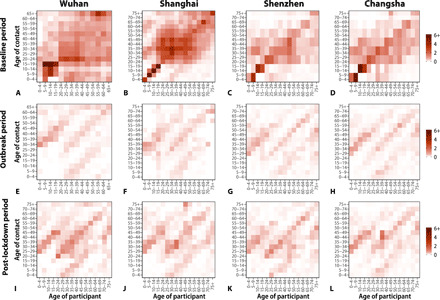
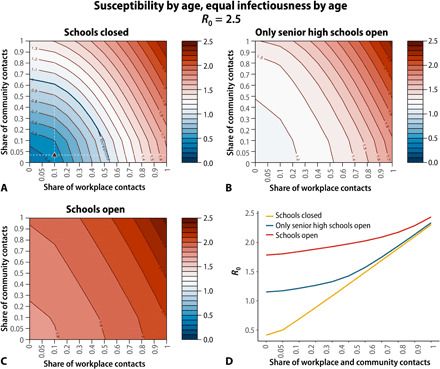
Nonpharmaceutical interventions to control SARS-CoV-2 spread have been implemented with different intensity, timing, and impact on transmission. As a result, post-lockdown COVID-19 dynamics are heterogeneous and difficult to interpret. We describe a set of contact surveys performed in four Chinese cities (Wuhan, Shanghai, Shenzhen, and Changsha) during the pre-pandemic, lockdown and post-lockdown periods to quantify changes in contact patterns. In the post-lockdown period, the mean number of contacts increased by 5 to 17% as compared to the lockdown period. However, it remains three to seven times lower than its pre-pandemic level sufficient to control SARS-CoV-2 transmission. We find that the impact of school interventions depends nonlinearly on the intensity of other activities. When most community activities are halted, school closure leads to a 77% decrease in the reproduction number; in contrast, when social mixing outside of schools is at pre-pandemic level, school closure leads to a 5% reduction in transmission.


Figures

Fig. 1
Fig. 1. Number of COVID-19 reported cases, timing of the surveys, and the main interventions in place over time.
(A) Wuhan. (B) Shanghai. (C) Shenzhen. (D) Changsha. COVID-19 cases by local transmission and international importation are indicated in light red and blue. The contact surveys for Shanghai, Shenzhen, and Changsha were conducted from 1 to 20 March, corresponding to the period of relaxation of interventions, and 7 to 15 May for Wuhan. The contact diaries for the baseline and outbreak periods were derived from retrospective interviews or previous surveys. The horizontal bars at the bottom of each panel represent the intensity over time of the four main performed interventions, where the height of the bar refers to the relative share of population affected by the intervention with the exception of close community management. With relatively small number of cases, the close community management was limited to subcity areas where cases were identified. The detailed timeline of the interventions is reported in table S1. Note that the school and university closure starting in mid-January was the regular winter break before the Lunar New Year holiday. In the absence of the pandemic, schools were set to reopen around mid-February 2020, while universities were scheduled to reopen between 4 February and 1 March 2020. However, because of the pandemic, these closures were extended.
Fig. 2
Fig. 2. Contact matrices by age.
(A) Baseline period contact matrix for Wuhan (regular weekday only). Each cell of the matrix represents the mean number of contacts that an individual in a given age group has with other individuals, stratified by age groups. The color intensity represents the numbers of contacts. To construct the matrix, we performed bootstrap sampling with replacement of survey participants weighted by the age distribution of the actual population of Wuhan. Every cell of the matrix represents an average over 100 bootstrapped realizations. (B) Same as (A), but the contact matrix weighted by weekday and weekends for Shanghai. (C and D) Same as (A), but for Shenzhen and Changsha. (E to H) Same as (A), but for the outbreak contact matrices for Wuhan, Shanghai, Shenzhen, and Changsha. (I to L) Same as (A), but for the post-lockdown contact matrices weighted by weekday and weekends for Wuhan, Shanghai, Shenzhen, and Changsha.
Fig. 3
Fig. 3. Effect of relaxing interventions on epidemic spread (assuming equal infectiousness by age).
(A) Estimated R0 during the outbreak and post-lockdown periods [mean and 95% confidence interval (CI)] as a function of baseline R0 (i.e., that derived by using the contact matrix estimated from the baseline period). The distribution of the transmission rate is estimated through the next-generation matrix approach by using 100 bootstrapped contact matrices for the baseline period to obtain the desired R0 values. We then use the estimated distribution of the transmission rate and the bootstrapped outbreak and post-lockdown contact matrices to estimate R0 for the outbreak period and the post-lockdown period, respectively. The 95% CIs account for uncertainty in the distribution of the transmission rate, mixing patterns, and susceptibility to infection by age. (B to D) Same as (A), but for Shanghai, Shenzhen, and Changsha. The figure includes both the scenario accounting for susceptibility to infection by age and the scenario where we assume that all individuals are equally susceptible to infection. (A) to (D) refer to the first scenario, and (E) to (H) refer to the second scenario.
Fig. 4
Fig. 4. Estimated R0 for Shanghai under different assumptions on the number of contacts in workplaces, community, and schools.
(A) Heatmap of the estimated mean value of R0 for a different combination of number of contacts in the workplaces and community under the assumption that all schools are closed. Share equal to 1 corresponds to the pre-pandemic contact pattern. The triangle corresponds to the measured share of contacts in the workplace and the community during the post-lockdown period. Baseline period R0 was set to 2.5, and we considered age-specific susceptibility to infection as in (9), and no differences in infectiousness by age. R0 values are estimated through the next-generation matrix approach. (B) Same as (A), but assuming that contacts in senior high schools are as in the pre-pandemic period. (C) Same as (A), but assuming that contacts in all schools (corresponding to the entire student population except for college students) are as in the pre-pandemic period. (D) Estimated mean value of R0 for different shares of workplace and community contacts under different levels of school closure.

Update of

References

    1. World Health Organization, WHO Director-General’s opening remarks at the media briefing on COVID-19 - 11 March 2020 (2020); www.who.int/dg/speeches/detail/who-director-general-s-opening-remarks-at... [accessed 9 July 2020].
    1. National Health Commission of the People’s Republic of China, Update on COVID-19 as of 24:00 on July 30, 2020 (2020); www.nhc.gov.cn/xcs/yqtb/202007/f81f2c2e757240a88bbc0a265f4249de.shtml [accessed 31 July 2020].
    1. “Workplaces resume operations from February 10,” Tencent News, 2020; https://new.qq.com/omn/20200131/20200131A0L4GF00.html [accessed 9 July 2020].
    1. “COVID-19 resurgence threatens South Korea’s success story,” The Diplomat, 2020; https://thediplomat.com/2020/06/covid-19-resurgence-threatens-south-kore... [accessed 12 June 2020].
    1. University of Minnesota, US posts largest single-day jump in new COVID-19 cases (2020); www.cidrap.umn.edu/news-perspective/2020/07/us-posts-largest-single-day-... [accessed 9 July 2020].

Publication types

MeSH terms