. 2021 May 7;7(19):eabe4323.
doi: 10.1126/sciadv.abe4323. Print 2021 May.

A distinct parabrachial-to-lateral hypothalamus circuit for motivational suppression of feeding by nociception

Affiliations

A distinct parabrachial-to-lateral hypothalamus circuit for motivational suppression of feeding by nociception

Siew Cheng Phua et al. Sci Adv. .

Abstract

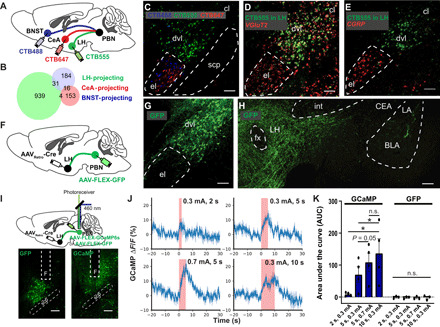
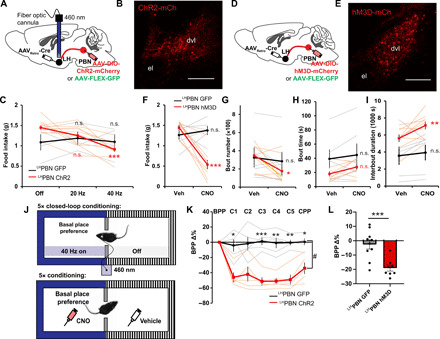
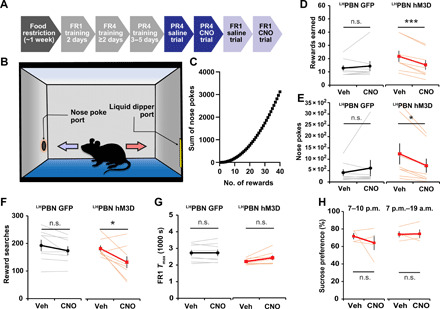
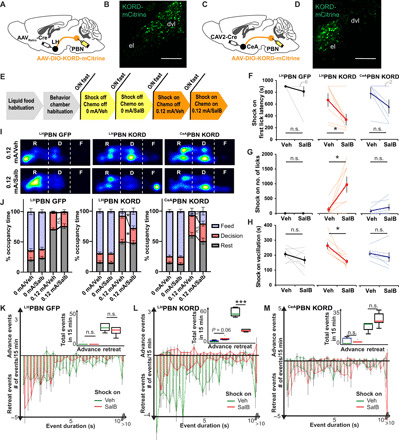
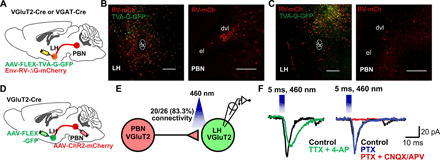
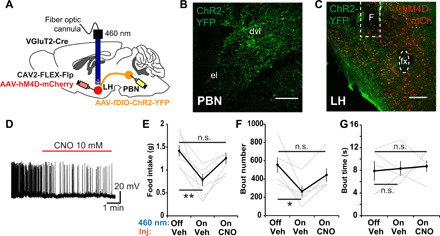
The motivation to eat is not only shaped by nutrition but also competed by external stimuli including pain. How the mouse hypothalamus, the feeding regulation center, integrates nociceptive inputs to modulate feeding is unclear. Within the key nociception relay center parabrachial nucleus (PBN), we demonstrated that neurons projecting to the lateral hypothalamus (LHPBN) are nociceptive yet distinct from danger-encoding central amygdala-projecting (CeAPBN) neurons. Activation of LHPBN strongly suppressed feeding by limiting eating frequency and also reduced motivation to work for food reward. Refined approach-avoidance paradigm revealed that suppression of LHPBN, but not CeAPBN, sustained motivation to obtain food. The effect of LHPBN neurons on feeding was reversed by suppressing downstream LHVGluT2 neurons. Thus, distinct from a circuit for fear and escape responses, LHPBN neurons channel nociceptive signals to LHVGluT2 neurons to suppress motivational drive for feeding. Our study provides a new perspective in understanding feeding regulation by external competing stimuli.


Figures

Fig. 1
Fig. 1. LHPBN neurons are segregated from CeAPBN neurons and nociceptive.
(A) Viral injection of retrograde CTB tracers conjugated with different fluorophores in the indicated brain regions. (B) Venn diagram of PBN neurons projecting to LH, CeA, and BNST (number shown in diagram is averaged from eight mice). (C) Representative image showing PBN neurons projecting to LH (green), CeA (red), and BNST (cyan) retrogradely labeled as shown in (A). (D) After injecting CTB555 retrograde tracer in LH (green), a representative coronal PBN section was stained for VGluT2 (red) by RNA-FISH. (E) After injecting CTB555 retrograde tracer in LH (green), a coronal PBN section was stained for CGRP (red) by RNA-FISH. (F) Schematic illustrating viral injection strategy enabling GFP expression in LHPBN neurons. (G) Representative coronal section showing GFP expressed in LHPBN neurons. (H) Representative coronal section showing LHPBN GFP projections in LH but not in CeA. (I) Viral injection strategy enabling GFP or GCaMP6s expression in LHPBN neurons. An optic fiber was positioned above the PBN to allow real-time photometric measurements of the fluorescence signal change. (J) LHPBN calcium activity in one representative mouse subjected to defined electric shock intensity and duration, revealed by GCaMP6s fluorescence signal change. Graphs were aligned to the start of electric shock. Shock duration is indicated in pink (means ± SEM averaged from triplicate trials). (K) Area under the curve (AUC) quantification of fluorescence signal change at defined electric shock intensity and duration. (n = 4 and 3 mice for GCaMP and GFP, respectively). BLA, basal lateral amygdala; CeA, central amygdala; cl, central lateral subnucleus; dvl, dorsoventral lateral subnucleus; el, external lateral subnucleus; fx, columns of the fornix; int, internal capsule; LA, lateral amygdala; LH, lateral hypothalamus; PBN, parabrachial nucleus; scp, superior cerebellar peduncle; and F, optical fiber. n.s., P ≥ 0.05; *P < 0.05. Scale bars, 100 μm. See also table S1 for statistical details.
Fig. 2
Fig. 2. Optogenetic and chemogenetic activation of LHPBN neurons suppress feeding and transmit negative valence.
(A) Viral injection strategy enabling GFP or Chr2 expression in LHPBN neurons. An optic fiber was positioned in LH to allow optogenetic stimulation of PBN terminals. (B) Representative coronal section showing ChR2-mCherry expressed in LHPBN neurons. (C) Amount of food consumed in a 3-hour postfasting refeeding experiment with optogenetic stimulation of PBN terminals in LH at indicated frequencies (n = 4 and 10 for GFP and ChR2, respectively). (D) Viral injection strategy enabling GFP or hM3d-mCherry expression in LHPBN neurons. (E) Representative coronal section showing hM3D-mCherry expressed in LHPBN neurons. (F) Amount of food consumed in a 3-hour chemogenetic postfasting refeeding experiment with hM3D off (Veh) or on (CNO). GFP served as CNO control [n = 6 and 9 for GFP and hM3D respectively; also applies to (G) to (I)]. (G) Number of feeding bouts in experiment as in (F). (H) The averaged duration of feeding bouts in experiment as in (F). (I) The averaged interval duration between feeding bouts in experiment as in (F). (J) Top: Schematic illustrating the closed-loop optogenetic conditioned place preference test. Blue light was turned on whenever mice entered the paired zone. Bottom: Schematic illustrating chemogenetic conditioned place preference test. Saline was paired with the less preferred zone; CNO was paired with the basal place preference. (K) Percentage change in the basal place preference (BPP) over five conditioning days and test day (n = 5 for both GFP and ChR2 groups). (L) Percentage change in the BPP after five conditioning days. (n = 10 and 8 for GFP and hM3D, respectively). Thick lines or bars represent means ± SEM, and thin lines or dots represent individual mouse. n.s., P ≥ 0.05; *P < 0.05; **P < 0.01; and ***P < 0.001. Scale bars, 200 μm. See also table S1 for statistics details.
Fig. 3
Fig. 3. LHPBN neuron activation represses performance in food reward operant task.
(A) Schematic illustrating the timeline for operant task training and testing. (B) Schematic illustrating the setup for operant task; the nose poke port and liquid dipper port were located at diagonal corners of the experiment chamber. (C) Graph shows the sum of nose pokes required for gaining successive rewards on a progressive ratio 4 (PR4) task. (D) The number of rewards earned in a 1-hour PR4 task with hM3D off (Veh) or on (CNO). GFP served as CNO control. [n = 8 for both GFP and hM3D groups; also applies to (E) to (G)]. (E) Number of nose pokes accumulated in the experiment as in (D). (F) Number of searches for reward in the experiment as in (D). A reward search is defined as a single trip from nose poke port to liquid dipper port. (G) Time needed to gain maximum number of rewards (60) on FR1 task, with Veh or CNO for respective groups. (H) Quantification of sucrose preference in indicated time periods with Veh or CNO for respective groups (n = 4 for both 3- and 14-hour trials). Thick lines represent means ± SEM, and thin lines represent individual mouse. n.s., P ≥ 0.05; *P < 0.05; and ***P < 0.001. See also table S1 for statistical details.
Fig. 4
Fig. 4. Suppressing LHPBN but not CeAPBN drives food consumption in the presence of pain caused by mild electric shocks.
(A) Viral injection strategy to enable the KORD-mCitrine expression in LHPBN neurons. (B) Representative coronal sections showing the KORD-mCitrine expression in LHPBN neurons. (C) Viral injection strategy to enable the KORD-mCitrine expression in CeAPBN neurons. (D) Representative coronal sections showing the KORD-mCitrine expression in CeAPBN neurons. (E) The order of trials in pain-reward (liquid food) conflict paradigm, shock-off (0 mA) and shock-on (0.12 mA). SalB was injected 30 min before each experiment. (F) Time latency to first lick at lickometer during shock-on trials. Latency was set as 900 s for mice that did not lick during the 15-min trial [n = 7, 7, and 6 mice for GFP, LHPBN KORD, and CeAPBN KORD, respectively; also applies to (G), (H), and (J)]. (G) Number of licks at the lickometer port accumulated within 15 min during shock-on trials. (H) The amount of time spent vacillating in the decision zone during shock-on trials. (I) Heatmap visualization of location frequencies across “rest (R),” “decision (D),” and “feed (F)” zones of one representative mouse at indicated trials. (J) Average time occupancy in rest, decision, and feed zones at indicated trials, expressed as a percentage. (K to M) Histogram depicts the distribution of advance and retreat events at the decision zone according to event duration by mice expressing (K) GFP or (L) KORD in LHPBN or (M) KORD in CeAPBN in respective shock-on trials. Inset shows the box plot of advance and retreat events in 15-min trials [n = 5 for both Veh and SalB trials for (K) and (L); n = 6 for both Veh and SalB trials for (M)]. Thick lines or bars represent means ± SEM, and thin lines or dots represent individual mouse. n.s., P ≥ 0.05; *P < 0.05; and ***P < 0.001. Scale bars, 200 μm. See also table S1 for statistical details.
Fig. 5
Fig. 5. LHPBN neurons send monosynaptic glutamatergic input to LHVGlut2 neurons.
(A) Schematic illustrating the pseudotyped rabies virus injection strategy that retrogradely labels input neurons to glutamatergic (VGluT2) or GABAergic (VGAT) neurons in LH using VGluT2-Cre mice (B) or VGAT-Cre mice (C). (B) Left: Representative LH coronal section showing starter cells (yellow) for the RV-mCh retrograde labeling of LHVGluT2 neuron inputs. Right: Representative PBN coronal section showing the RV-mCh–labeled neurons in PBN that projected to LHVGluT2 neurons. (C) Left: Representative LH coronal section showing starter cells (yellow) for RV-mCh retrograde labeling of LHVGat neuron inputs. Right: Representative PBN coronal section showing the RV-mCh–labeled neurons in PBN that projected to LHVGat neurons. (D) Schematic illustrating the virus injection strategy to express ChR2-mCh in PBN neurons and GFP in LHVGluT2 neurons for electrophysiology examination of the synaptic connection between PBN and LH glutamatergic neurons. (E) Diagram of electrophysiology experiment in acute hypothalamic slices for examining the connection between PBN and LH glutamatergic neurons. In 26 recordings performed on four animals, 20 glutamatergic neurons in LH showed time-locked response to blue light illumination. (F) Representative electrophysiology traces confirming that the connection between PBN and LH glutamatergic neurons is monosynaptic and glutamatergic. (TTX, tetrodotoxin; 4-AP, 4-aminopyridine; PTX, picrotoxin; CNQX, 6-cyano-7-nitroquinoxaline-2,3-dione; and APV, d-2-amino-5-phosphonopentanoic acid).
Fig. 6
Fig. 6. The effect of LHVGlut2 neurons on feeding depends on downstream LHPBN neurons.
(A) Schematic illustrating the virus injection strategy to enable ChR2 expression in LHPBN glutamatergic neurons and hM4D in LH glutamatergic neurons. A fiber optic cannula was positioned in LH to allow blue light optogenetic stimulation of PBN terminals. (B) Representative coronal section showing the ChR2-YFP expression in LHPBN based on the virus injection strategy in (A). (C) Representative coronal section showing the ChR2-YFP–expressing PBN terminals in LH and hM4D-mCh expression in LHVGluT2 neurons based on the virus injection strategy in (A). F denotes fiber optic cannula position. (D) Representative trace of a whole cell–patched LH glutamatergic neuron expressing hM4D-mCherry with CNO application (red line) into bath of recording chamber. (E) Amount of food consumed in 3-hour feeding experiment postovernight fasting. Each mouse was subjected with three consecutive experiment trials on different days: (i) 460 nm–off hM4D-off (Veh), (ii) 460 nm–on hM4D-off (Veh), (iii) 460 nm–on hM4D-on (CNO) (n = 6). (F) Number of feeding bouts in experiment as in (E) (n = 5). (G) The mean time duration of all feeding bouts in experiment as in (E) (n = 5). Thick lines represent means ± SEM, and thin lines represent individual mouse. n.s., P ≥ 0.05; *P < 0.05; **P < 0.01. Scale bars, 200 μm. See also table S1 for statistical details.

References

    1. Burnett C. J., Li C., Webber E., Tsaousidou E., Xue S. Y., Brüning J. C., Krashes M. J., Hunger-driven motivational state competition. Neuron 92, 187–201 (2016). - PMC - PubMed
    1. Rossi M. A., Stuber G. D., Overlapping brain circuits for homeostatic and hedonic feeding. Cell Metab. 27, 42–56 (2018). - PMC - PubMed
    1. Sternson S. M., Eiselt A. K., Three pillars for the neural control of appetite. Annu. Rev. Physiol. 79, 401–423 (2017). - PubMed
    1. Morton G. J., Meek T. H., Schwartz M. W., Neurobiology of food intake in health and disease. Nat. Rev. Neurosci. 15, 367–378 (2014). - PMC - PubMed
    1. Weingarten H. P., Conditioned cues elicit feeding in sated rats: A role for learning in meal initiation. Science 220, 431–433 (1983). - PubMed

Publication types

LinkOut - more resources