. 2021 May 8;10(1):97.
doi: 10.1038/s41377-021-00536-3.

Excitation spectral microscopy for highly multiplexed fluorescence imaging and quantitative biosensing

Affiliations

Excitation spectral microscopy for highly multiplexed fluorescence imaging and quantitative biosensing

Kun Chen et al. Light Sci Appl. .

Abstract

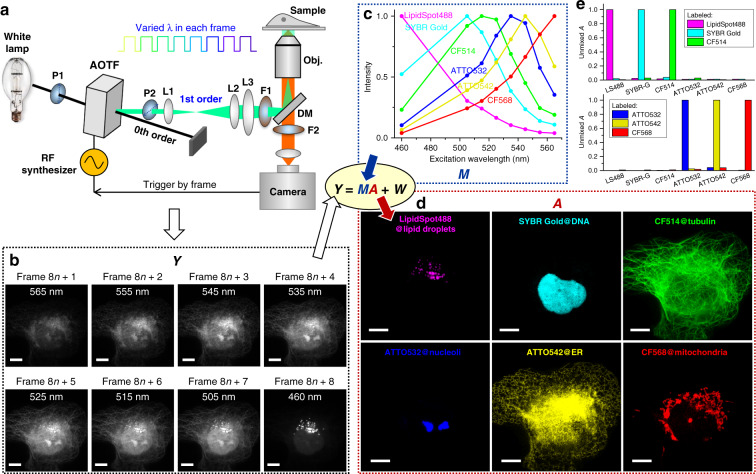
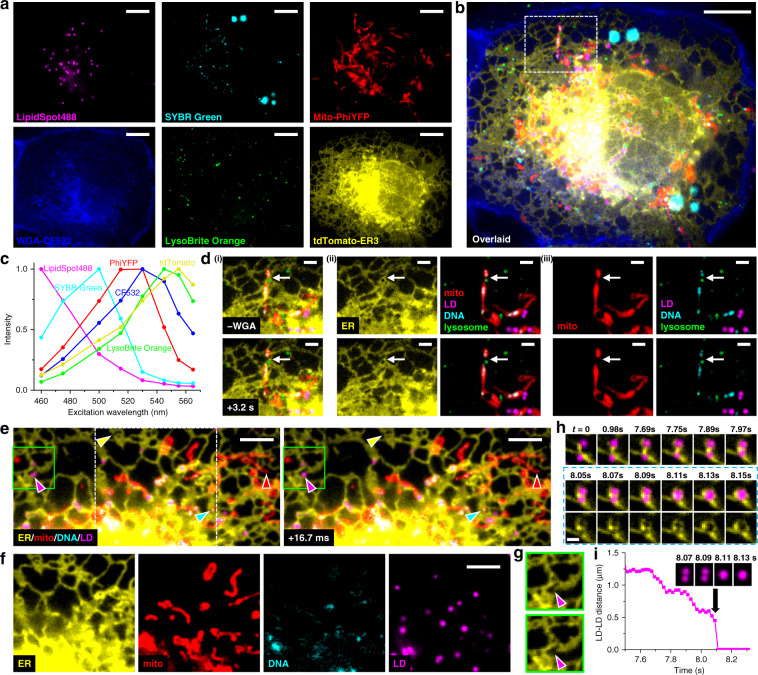
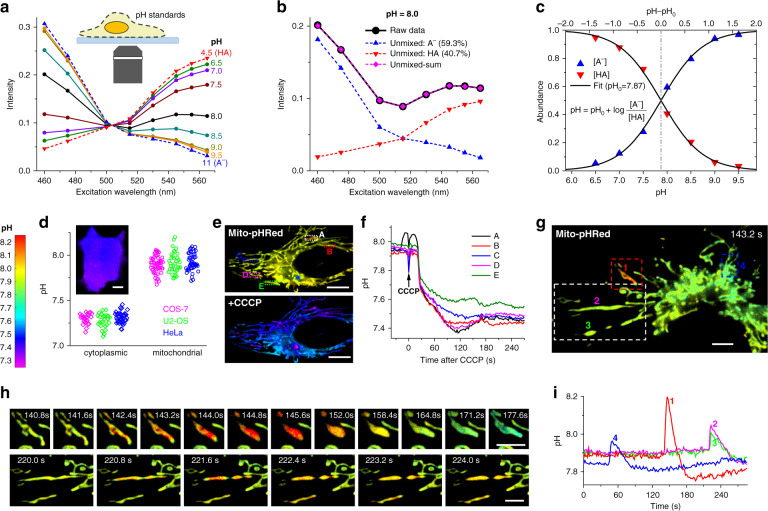
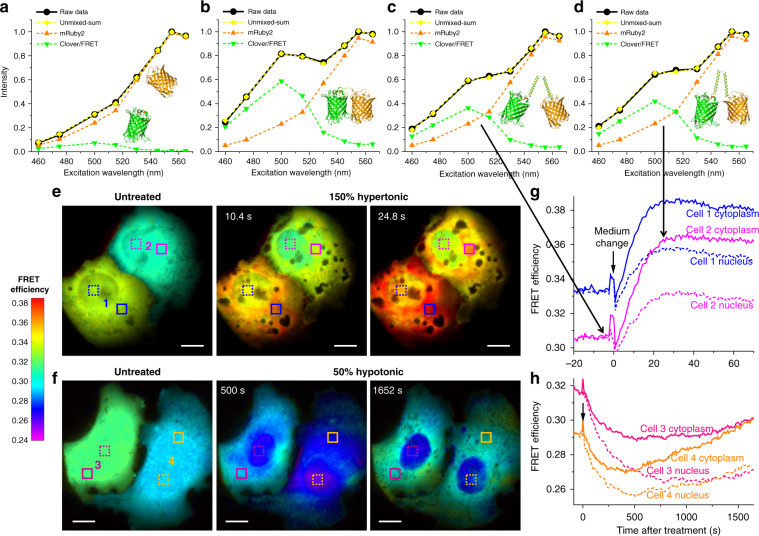
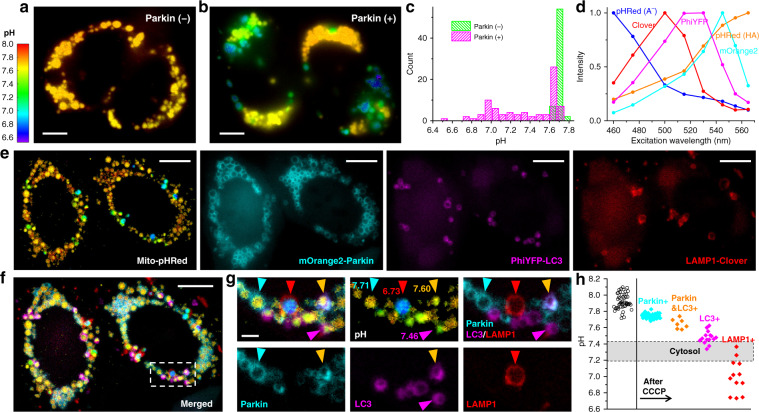
The multiplexing capability of fluorescence microscopy is severely limited by the broad fluorescence spectral width. Spectral imaging offers potential solutions, yet typical approaches to disperse the local emission spectra notably impede the attainable throughput. Here we show that using a single, fixed fluorescence emission detection band, through frame-synchronized fast scanning of the excitation wavelength from a white lamp via an acousto-optic tunable filter, up to six subcellular targets, labeled by common fluorophores of substantial spectral overlap, can be simultaneously imaged in live cells with low (~1%) crosstalks and high temporal resolutions (down to ~10 ms). The demonstrated capability to quantify the abundances of different fluorophores in the same sample through unmixing the excitation spectra next enables us to devise novel, quantitative imaging schemes for both bi-state and Förster resonance energy transfer fluorescent biosensors in live cells. We thus achieve high sensitivities and spatiotemporal resolutions in quantifying the mitochondrial matrix pH and intracellular macromolecular crowding, and further demonstrate, for the first time, the multiplexing of absolute pH imaging with three additional target organelles/proteins to elucidate the complex, Parkin-mediated mitophagy pathway. Together, excitation spectral microscopy provides exceptional opportunities for highly multiplexed fluorescence imaging. The prospect of acquiring fast spectral images without the need for fluorescence dispersion or care for the spectral response of the detector offers tremendous potential.


Conflict of interest statement

The authors declare no competing interests.

Figures

Fig. 1
Fig. 1. Excitation spectral microscopy.
a Schematic of the setup. Full-frame spectral micrographs are obtained by the synchronized fast modulation of the excitation wavelength λ in consecutive frames. P polarizer, L lens, F bandpass filter, DM dichroic mirror. The resultant excitation spectrum collected at every pixel (Y) is linearly unmixed into the abundances (A) of different fluorophores based on their pre-calibrated excitation spectrum (M) to minimize the residual (W). b Example images recorded at eight preset excitation wavelengths in eight consecutive frames at 10 fps (thus 0.8 s total data acquisition time), for a fixed COS-7 cell labeled by six fluorescent dyes for six distinct subcellular structures: LipidSpot 488 for lipid droplets, SYBR Gold for nuclear DNA, and CF514, ATTO 532, ATTO 542, and CF568 for immunofluorescence of tubulin, nucleoli, the endoplasmic reticulum (ER), and mitochondria, respectively. c Eight-wavelength excitation spectra of the six fluorophores, separately measured on our setup using singly labeled samples. d Decomposed images of the six fluorophores, obtained via linearly unmixing the excitation-dependent intensity at each pixel in b using the reference spectra in c. e Unmixed abundancy values in different fluorophore channels for samples singly labeled by each of the six fluorophores. Scale bars: 10 µm (b, d)
Fig. 2
Fig. 2. Fast multitarget imaging of live cells.
a Unmixed images of six subcellular targets in a live COS-7 cell via 8-excitation-wavelength recording at 10 fps (0.8 s total data acquisition time). LipidSpot 488: lipid droplets (LDs), SYBR Green: mitochondrial DNA, Mito-PhiYFP: mitochondrial matrix, WGA-CF532: cell membrane, LysoBrite Orange: lysosomes, tdTomato-ER3: ER. b Overlay of the above six images. c Reference excitation spectra of the six fluorophores, separately measured on the setup using singly labeled samples. d The box region in b for two time points 3.2 s apart (top vs. bottom rows), after i) removing the WGA channel, ii) separation of the ER channel, and iii) further separation of the mitochondria channel. e Two consecutive 4-fluorophore images at 16.7 ms time spacing for another live COS-7 cell labeled by tdTomato-ER3, Mito-PhiYFP, SYBR Green, and LipidSpot 488, achieved by synchronizing 4-wavelength excitation with 240 fps recording. Yellow, red, cyan, and magenta arrowheads point to noticeable structural changes in each fluorophore channel. f The separated fluorophore channels for the white box in e. g The ER channel for the green boxes in e, at 16.7 ms separation. h ER-mediated LD fusion observed in another 4-wavelength experiment at 19.8 ms time spacing (202 fps recording). Bottom row: consecutive ER-LD and ER images during merging. i Distance between the two LDs as a function of time. Inset: four consecutive images of the LD channel. Scale bars: 10 µm (a, b); 2 µm (d); 5 µm (e, f); 1 µm (h). See also Supplementary Videos 1–4
Fig. 3
Fig. 3. Absolute pH imaging in live cells via unmixing and quantifying two fluorescent species.
a Excitation spectra measured by our spectral microscope, for pHRed in proton-permeabilized COS-7 cells in buffer standards of pH = 4.5 and 11 (dash lines; taken as pure forms of HA and A, respectively), and of pH = 6.5–9.5 (solid lines). b Linear unmixing of the excitation spectrum at pH = 8.0 (black solid line) into HA and A components (dash lines). c Fitting the resultant HA and A abundances unmixed at different pH values to the Henderson–Hasselbalch equation with a single parameter pH0. d Statistics of the average pH values of the cytoplasm and mitochondrial matrix of live COS-7, U2-OS, and HeLa cells, measured with our approach using cytoplasmic pHRed and Mito-pHRed, respectively. Inset: Color-coded absolute pH map of the cytoplasm of a live COS-7 cell. e Mito-pHRed absolute pH maps (same color scale as d) of the mitochondrial matrix in a live HeLa cell, before (top) and after (bottom) 120 s treatment with 20 µM CCCP. f pH value time traces for the five regions marked in e. g Color-coded Mito-pHRed absolute pH map of the mitochondrial matrix in a live COS-7 cell, at the time point of 143.2 s. h Time sequences for the red and white boxed regions in g, for two different time windows. i pH value time traces for the four mitochondria marked in g. Experiments were performed with 8-wavelength excitation cycles at 10 fps, corresponding to 0.8 s acquisition time for each spectral image. Scale bars: 10 µm (d, e); 5 µm (g, h). See also Supplementary Videos 5–7
Fig. 4
Fig. 4. FRET imaging in live cells via resolving the excitation spectrum.
a Excitation spectrum measured by our spectral microscope (black solid line) and its unmixing (dash lines) for non-interacting mRuby2 and Clover co-expressed in the cytoplasm of a live COS-7 cell. b Measured excitation spectrum and its unmixing for a directly linked Clover-mRuby2 construct expressed in a live COS-7 cell. c, d Measured excitation spectrum and its unmixing for the Clover-mRuby2 FRET crowding sensor in the cytoplasm of a live COS-7 cell, before (c) and ~25 s after (d) 150% hypertonic treatment by adding into the cell medium an equal volume of medium that was supplemented with 300 mM sorbitol. e Color-coded FRET maps for the crowding sensor, for two live COS-7 cells before (left), ~10 s after (center), and ~25 s after (right) the 150% hypertonic treatment. f Color-coded FRET maps for the crowding sensor, for two live COS-7 cells before (left), 500 s after (center), and 1650 s after (right) 50% hypotonic treatment by adding into the medium an equal volume of water. g, h FRET value time traces for the boxed regions of cytoplasm (solid lines) and nuclei (dash lines) of the four cells (e, f). Experiments were performed with 8-wavelength excitation cycles at 10 fps (0.8 s acquisition time for each spectral image). Scale bars: 10 µm (e, f). See also Supplementary Videos 8–9
Fig. 5
Fig. 5. Concurrent absolute pH imaging of the mitochondrial matrix with three additional FP-tagged markers in the Parkin-mediated mitophagy pathway.
a, b Color-coded Mito-pHRed absolute pH maps of live HeLa cells after the application of 20 µM CCCP for 6 h, for cells without (a) and with (b) the co-expression of fluorescently untagged Parkin. c Distribution of the measured pH values in each mitochondrion for a, b. d Excitation spectra on our setup for the five fluorescent species unmixed to enable absolute pH imaging with three additional FP markers. e Unmixed images of color-coded Mito-pHRed absolute pH map, mOrange2-Parkin, PhiYFP-LC3, and LAMP1-Clover for two Parkin-expressing live HeLa cells after the application of 20 µM CCCP for 4 h. f Overlay of the images in e. g Zoom-in of the white box in f, as well as its separation into different channels. Cyan, magenta, and red arrowheads point to individual mitochondria only marked by Parkin, LC3, and LAMP1, with respective matrix pH values quantified from the enclosed Mito-pHRed signals indicated. Orange arrowhead points to a mitochondrion marked by both Parkin and LC3. h Distribution of the Mito-pHRed-quantified matrix pH of individual mitochondria in the sample labeled by the different markers (color diamonds), compared to that in untreated HeLa cells (black circles). Shaded band: typical range of cytoplasmic pH. Experiments were performed with 8-wavelength excitation at 10 fps (0.8 s acquisition time for each spectral image). Scale bars: 5 µm (a, b); 10 µm (e, f); 2 µm (g)

Similar articles

Cited by

References

    1. Lichtman JW, Conchello JA. Fluorescence microscopy. Nat. Methods. 2005;2:910–919. doi: 10.1038/nmeth817. - DOI - PubMed
    1. Peng XH, et al. High spatiotemporal resolution and low photo-toxicity fluorescence imaging in live cells and in vivo. Biochem. Soc. Trans. 2019;47:1635–1650. doi: 10.1042/BST20190020. - DOI - PubMed
    1. Tamura T, Hamachi I. Recent progress in design of protein-based fluorescent biosensors and their cellular applications. ACS Chem. Biol. 2014;9:2708–2717. doi: 10.1021/cb500661v. - DOI - PubMed
    1. Pietraszewska-Bogiel A, Gadella TWJ. FRET microscopy: from principle to routine technology in cell biology. J. Microsc. 2011;241:111–118. doi: 10.1111/j.1365-2818.2010.03437.x. - DOI - PubMed
    1. Greenwald EC, Mehta S, Zhang J. Genetically encoded fluorescent biosensors illuminate the spatiotemporal regulation of signaling networks. Chem. Rev. 2018;118:11707–11794. doi: 10.1021/acs.chemrev.8b00333. - DOI - PMC - PubMed