

A multilevel carbon and water footprint dataset of food commodities
- PMID: 33963181
- PMCID: PMC8105407
- DOI: 10.1038/s41597-021-00909-8
A multilevel carbon and water footprint dataset of food commodities
Abstract
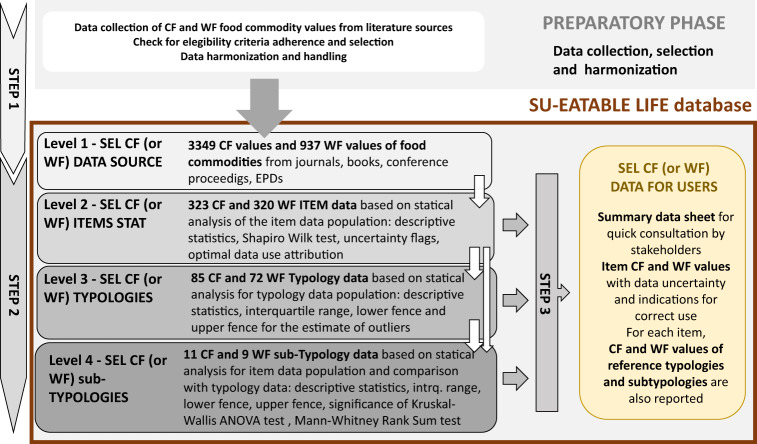
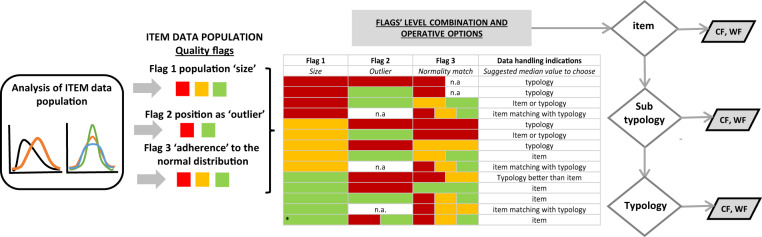
Informing and engaging citizens to adopt sustainable diets is a key strategy for reducing global environmental impacts of the agricultural and food sectors. In this respect, the first requisite to support citizens and actors of the food sector is to provide them a publicly available, reliable and ready to use synthesis of environmental pressures associated to food commodities. Here we introduce the SU-EATABLE LIFE database, a multilevel database of carbon (CF) and water (WF) footprint values of food commodities, based on a standardized methodology to extract information and assign optimal footprint values and uncertainties to food items, starting from peer-reviewed articles and grey literature. The database and its innovative methodological framework for uncertainty treatment and data quality assurance provides a solid basis for evaluating the impact of dietary shifts on global environmental policies, including climate mitigation through greenhouse gas emission reductions. The database ensures repeatability and further expansion, providing a reliable science-based tool for managers and researcher in the food sector.
Conflict of interest statement
The authors declare no competing interests.
Figures
References
-
- IPCC, 2019: Climate Change and Land: an IPCC special report on climate change, desertification, land degradation, sustainable land management, food security, and greenhouse gas fluxes in terrestrial ecosystems (eds Shukla, P. R. et al.). https://www.ipcc.ch/srccl/download (2019).
-
- WWAP (United Nations World Water Assessment Programme). The United Nations World Water Development Report 2014: Water and Energy. Paris, UNESCO (2014).
-
- FAO. The State of the World’s Biodiversity for Food and Agriculture (eds Bélanger, J. & Pilling, D.) FAO Commission on Genetic Resources for Food and Agriculture Assessments. Rome. pp 572 (2019).
-
- ISO 14044:2006 Environmental management — Life cycle assessment — Requirements and guidelines (2006).
Publication types
MeSH terms
Substances
Grants and funding
- LIFE16 GIC/IT/000038/EC | Executive Agency for Small and Medium-sized Enterprises (European Commission - Executive Agency for SMEs)
- LIFE16 GIC/IT/000038/EC | Executive Agency for Small and Medium-sized Enterprises (European Commission - Executive Agency for SMEs)
- LIFE16 GIC/IT/000038/EC | Executive Agency for Small and Medium-sized Enterprises (European Commission - Executive Agency for SMEs)
- LIFE16 GIC/IT/000038/EC | Executive Agency for Small and Medium-sized Enterprises (European Commission - Executive Agency for SMEs)
- LIFE16 GIC/IT/000038/EC | Executive Agency for Small and Medium-sized Enterprises (European Commission - Executive Agency for SMEs)
LinkOut - more resources
Full Text Sources
Other Literature Sources
Medical
