. 2021 May 7;12(1):2559.
doi: 10.1038/s41467-021-22804-x.

Co-evolution of tumor and immune cells during progression of multiple myeloma

Affiliations

Co-evolution of tumor and immune cells during progression of multiple myeloma

Ruiyang Liu et al. Nat Commun. .

Abstract

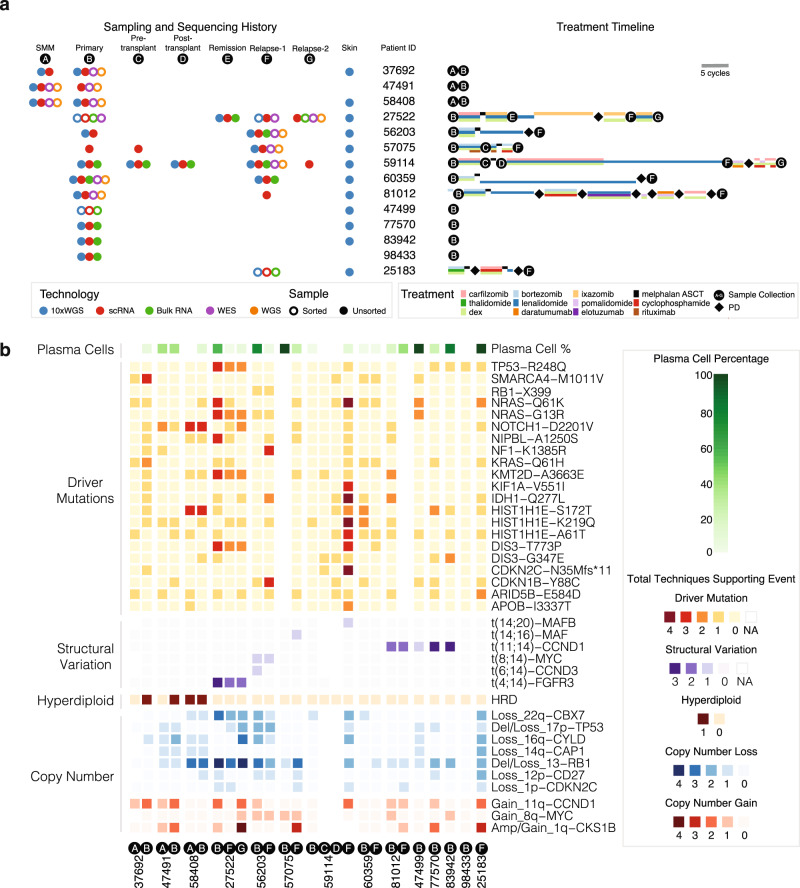
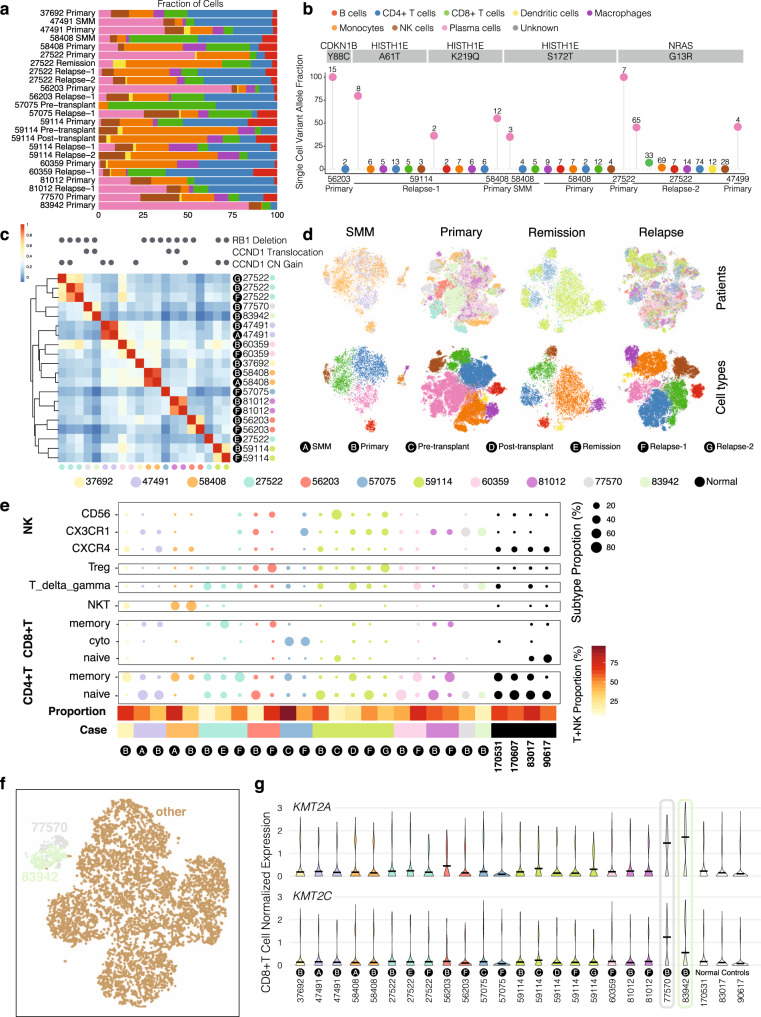
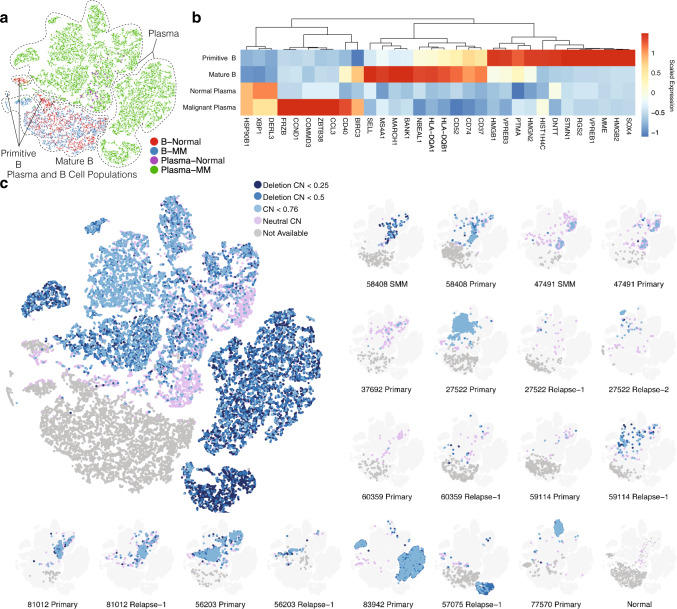
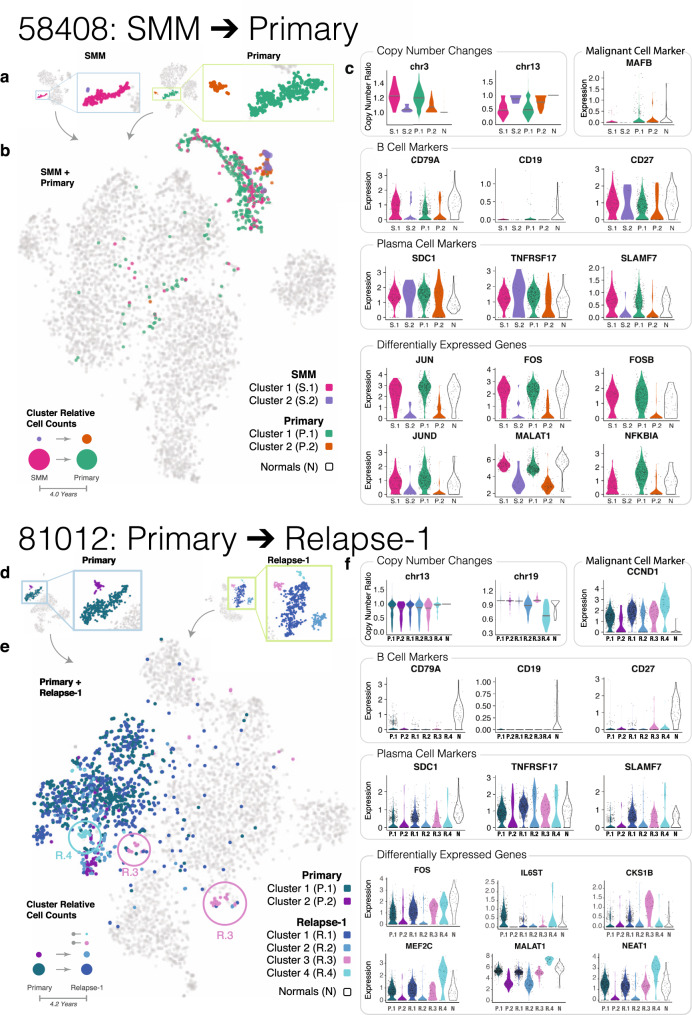
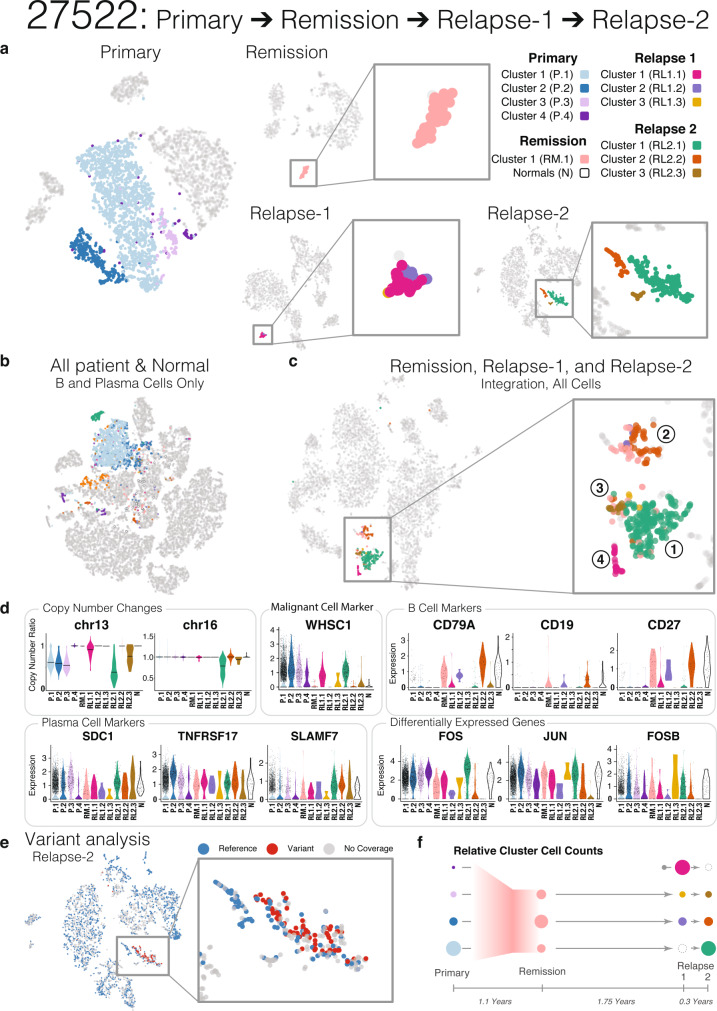
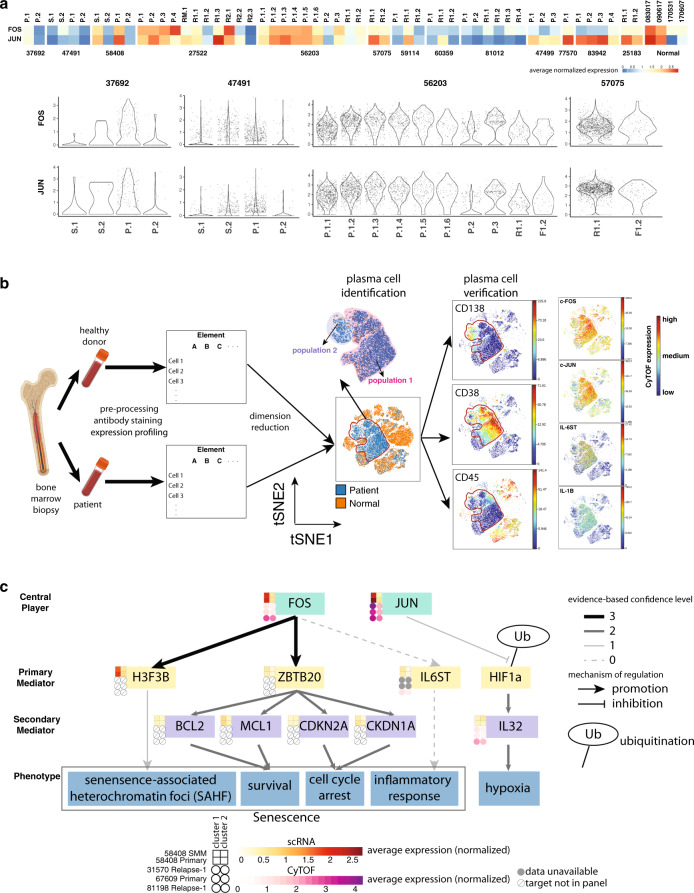
Multiple myeloma (MM) is characterized by the uncontrolled proliferation of plasma cells. Despite recent treatment advances, it is still incurable as disease progression is not fully understood. To investigate MM and its immune environment, we apply single cell RNA and linked-read whole genome sequencing to profile 29 longitudinal samples at different disease stages from 14 patients. Here, we collect 17,267 plasma cells and 57,719 immune cells, discovering patient-specific plasma cell profiles and immune cell expression changes. Patients with the same genetic alterations tend to have both plasma cells and immune cells clustered together. By integrating bulk genomics and single cell mapping, we track plasma cell subpopulations across disease stages and find three patterns: stability (from precancer to diagnosis), and gain or loss (from diagnosis to relapse). In multiple patients, we detect "B cell-featured" plasma cell subpopulations that cluster closely with B cells, implicating their cell of origin. We validate AP-1 complex differential expression (JUN and FOS) in plasma cell subpopulations using CyTOF-based protein assays, and integrated analysis of single-cell RNA and CyTOF data reveals AP-1 downstream targets (IL6 and IL1B) potentially leading to inflammation regulation. Our work represents a longitudinal investigation for tumor and microenvironment during MM progression and paves the way for expanding treatment options.


Conflict of interest statement

The authors declare no competing interests.

Figures

Fig. 1
Fig. 1. Samples, next-generation dataset, and genomics landscape.
a Sample type, technology, and treatment timeline broken down by patient. Left portion shows sample technology (10xWGS, scRNA, Bulk RNA, WES, WGS) and sample type (CD138+ sorted vs. unsorted). Right portion shows each patient’s treatment timeline. Treatment length corresponds to the number of cycles. SMM smoldering multiple myeloma. b Heatmap shows the landscape of copy number variations (CNV), structural variants (SV), and driver mutations across 14 patients. Copy number amplification/gain, copy number deletion/loss, SV, and driver mutations are shown in red, blue, purple, and orange, respectively, with colors indicating the number of techniques supporting the event. Techniques for copy number events are FISH, 10xWGS, regular WGS, WES, and scRNA-seq. Techniques for SV are FISH, 10xWGS, Bulk RNA-seq, and scRNA-seq. Techniques for driver mutations are 10xWGS, WES, WGS, and Bulk RNA-seq. Number of techniques supporting an event is 0 if the only technique supporting the event is from scRNA-seq. Plasma cells percentage inferred from scRNA-seq is shown on the top of the heatmap.
Fig. 2
Fig. 2. Integration analysis across 14 multiple myeloma patients revealing distinct cancer populations and immune microenvironments during disease progression.
a Bar plots showing cell type fractions for each sample. Colors indicate cell type. b Single-cell variant allele fractions (VAF) for driver mutations. Each bubble is colored by the cell type with the associated VAF, and total cells supporting the variant are labeled atop each bubble. c Heatmap showing pairwise correlation of average expression for malignant cells in each sample. Genomic alterations with either FISH evidence or at least another two levels of evidence shown above. d t-SNE plots showing the integration of samples from multiple patients for a given time point. Clustering of cells from different time points are colored by patient (top) or by cell type (bottom). The remission group includes one remission sample, one pre-transplant, and one post-transplant. e Proportion of T/NK cells within the total T/NK cell cohort for each sample. The proportion of T and NK cells within each sample is shown at the bottom as a color bar. f t-SNE plot showing CD8+ T cells from all the patients where CD8+ T cells are available. Cells from the primary sample of Patients 77570 and 83942 and Relapse-2 sample of Patient 27522 are colored specifically. g Expression pattern of KMT2A and KMT2C in CD8+ T cells for each sample.
Fig. 3
Fig. 3. Analysis of B cell lineage markers and landscape for copy number events.
a t-SNE plot showing the distribution of B cells and plasma cells from all patients and four healthy “normal” donors. Dots are colored by samples of origin (patients/healthy donors) and cell type. b Heatmap showing genes specifically expressed at certain stages of B cell development. c Landscape of chromosome 13 deletion status showing all samples (left), with sample-specific maps for samples with at least one cell with chromosome 13 copy number (CN) < 0.76 (right). Within each t-SNE plot, dots are colored by chromosome 13 deletion status predicted from inferCNV. Dots colored in grey are B cells with CNV scores unavailable.
Fig. 4
Fig. 4. Patterns of plasma cell subpopulation shift from SMM to Primary (58408) and from Primary to Relapse (81012).
a Plasma cell t-SNE subclusters for Patient 58408 at SMM and Primary time points. b Plasma cell subclusters identified in a mapped to the integrated t-SNE of all cells from Patient 58048 SMM and Primary time points. Bottom left: possible explanation for plasma cell subpopulation shift from SMM to Primary. c Copy number and expression patterns for plasma cells from different time point subclusters and plasma cells from healthy donors. The first row shows copy number changes and expression of genes associated with genetic alterations detected in Patient 58408. The second and third rows show the expression of B cell markers and plasma cell markers. The last two rows show differentially expressed genes found between the clusters. df Similar illustrations as ac except for Patient 81012, who progressed from Primary to Relapse-1.
Fig. 5
Fig. 5. Detailed analysis of plasma cell subpopulation shift for Patient 27522.
a t-SNE mapping of plasma cell subclusters for Patient 27522 at Primary, Remission, Relapse-1, and Relapse-2 disease stages. Colors indicate different subclusters within each time point. b Plasma cell subclusters identified in a mapped to the integrated t-SNE of b and plasma cells from all samples plus healthy donors (as in Fig. 3a). c Plasma cell subclusters identified in a mapped to the integrated t-SNE of all cells from Patient 27522 Remission, Relapse-1, and Relapse-2 disease stages. d Subcluster level copy number changes and expression of malignant cell markers, B cell markers, plasma cell markers, and differentially expressed genes. e Somatic mutations mapped onto Relapse-2 t-SNE (blue, reference allele only; red, variant allele detected; grey, no coverage). f Possible explanation for plasma cell subpopulation shift from Primary to Relapse-2.
Fig. 6
Fig. 6. Linked-read DNA sequencing maps somatic mutations to germline haplotypes and clonal evolution maps.
a Variant allele frequency clustering of subclonal populations from Patient 58408 SMM and Primary samples. b Somatic mutation VAF-based clonality models for Patient 58408. c Variant allele frequency clustering of subclonal populations from Patient 27522 Primary, Relapse-1, and Relapse-2 samples. d Somatic mutation VAF and haplotype-based clonality model for Patient 27522. e Barcode analysis of two NRAS somatic mutations showing both mutations occurred on Haplotype 2 did not co-occur, suggesting an independent subclonal relationship. Each set of linked reads represents a particular pattern of support for the two somatic NRAS mutations. The number of observed barcodes refers to total barcodes demonstrating the same pattern of NRAS somatic mutations.
Fig. 7
Fig. 7. AP-1 expression population in plasma cells confirmed by independent cohort.
a AP-1 components expression across plasma cell subpopulations across samples. Upper: average expression for FOS and JUN for each subpopulation. Lower: violin plot showing the expression patterns of FOS and JUN for some cases of interest. S SMM, P Primary, RM Remission, R1 Relapse-1, R2 Relapse-2. b CyTOF experiment workflow and data analysis. Bone marrow samples from patient and healthy donors are preprocessed, stained for target antibodies of interest, and expression is profiled in parallel. Samples from patients and healthy donors are merged together and visualized with t-SNE. Regions where only patient samples occupy are further checked for CD138, CD38, and CD45 for verification of their plasma cell identity. Expression profile for FOS, JUN, IL-1B and IL-6 within plasma cells are shown. c. Proposed mechanism of how AP-1 complex influences the phenotype of myeloma cells. Heatmap beside each gene indicates normalized expression for different populations of plasma cells in Patients 58408 (SMM and Primary), 31570, 67609, and 81198. scRNA-seq expression data, yellow scale; CyTOF expression data, purple scale. Solid arrows indicate the presence of evidence from literature or database. Dashed arrows indicate indirect evidence. Color of solid arrows indicates the confidence level of the evidence of origin. 3, evidence from ChIP-seq database; 2, evidence from myeloma associated literature; 1, evidence from non-myeloma associated literature. Clusters 1 and 2 for each case are manually defined.

References

    1. Greipp PR, et al. International staging system for multiple myeloma. J. Clin. Oncol. 2005;23:3412–3420. doi: 10.1200/JCO.2005.04.242. - DOI - PubMed
    1. Richardson, P. et al. The treatment of relapsed and refractory multiple myeloma. Hematology Am. Soc. Hematol. Educ. Program2007, 317–323 (2007). - PubMed
    1. Stewart AK, et al. Carfilzomib, lenalidomide, and dexamethasone for relapsed multiple myeloma. N. Engl. J. Med. 2015;372:142–152. doi: 10.1056/NEJMoa1411321. - DOI - PubMed
    1. Dimopoulos MA, et al. Carfilzomib or bortezomib in relapsed or refractory multiple myeloma (ENDEAVOR): an interim overall survival analysis of an open-label, randomised, phase 3 trial. Lancet Oncol. 2017;18:1327–1337. doi: 10.1016/S1470-2045(17)30578-8. - DOI - PubMed
    1. Lokhorst HM, et al. Targeting CD38 with daratumumab monotherapy in multiple myeloma. N. Engl. J. Med. 2015;373:1207–1219. doi: 10.1056/NEJMoa1506348. - DOI - PubMed

Publication types

MeSH terms