. 2021 May 7;12(1):2558.
doi: 10.1038/s41467-021-22627-w.

Loss of function mutations in GEMIN5 cause a neurodevelopmental disorder

Sukhleen Kour #  1 Deepa S Rajan #  1 Tyler R Fortuna  1 Eric N Anderson  1 Caroline Ward  1 Youngha Lee  2 Sangmoon Lee  2 Yong Beom Shin  3 Jong-Hee Chae  4 Murim Choi  2   4 Karine Siquier  5 Vincent Cantagrel  5 Jeanne Amiel  6 Elliot S Stolerman  7 Sarah S Barnett  8 Margot A Cousin  9 Diana Castro  10 Kimberly McDonald  11 Brian Kirmse  12 Andrea H Nemeth  13   14 Dhivyaa Rajasundaram  15 A Micheil Innes  16 Danielle Lynch  16 Patrick Frosk  17 Abigail Collins  18 Melissa Gibbons  18 Michele Yang  18 Isabelle Desguerre  19 Nathalie Boddaert  20 Cyril Gitiaux  21 Siri Lynne Rydning  22 Kaja K Selmer  23 Roser Urreizti  24 Alberto Garcia-Oguiza  25 Andrés Nascimento Osorio  26 Edgard Verdura  27 Aurora Pujol  27   28 Hannah R McCurry  29 John E Landers  30 Sameer Agnihotri  31 E Corina Andriescu  32 Shade B Moody  32 Chanika Phornphutkul  33 Maria J Guillen Sacoto  34 Amber Begtrup  34 Henry Houlden  35 Janbernd Kirschner  36 David Schorling  36 Sabine Rudnik-Schöneborn  37 Tim M Strom  38 Steffen Leiz  39 Kali Juliette  40 Randal Richardson  40 Ying Yang  41 Yuehua Zhang  41 Minghui Wang  42 Jia Wang  43 Xiaodong Wang  43 Konrad Platzer  44 Sandra Donkervoort  45 Carsten G Bönnemann  45 Matias Wagner  46 Mahmoud Y Issa  47 Hasnaa M Elbendary  47 Valentina Stanley  48 Reza Maroofian  35 Joseph G Gleeson  48 Maha S Zaki  47 Jan Senderek  49 Udai Bhan Pandey  50   51   52
Affiliations

Loss of function mutations in GEMIN5 cause a neurodevelopmental disorder

Sukhleen Kour et al. Nat Commun. .

Abstract

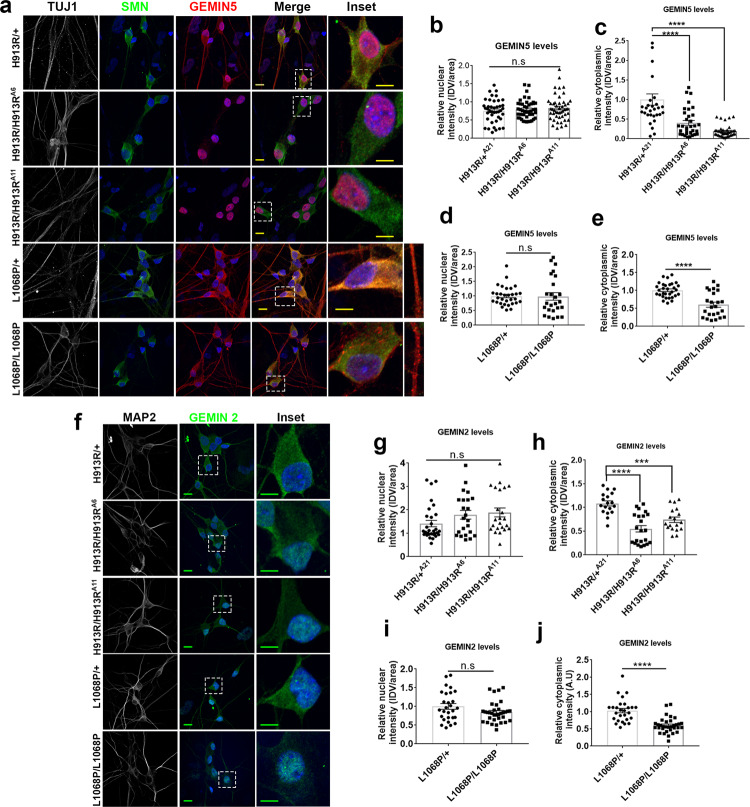
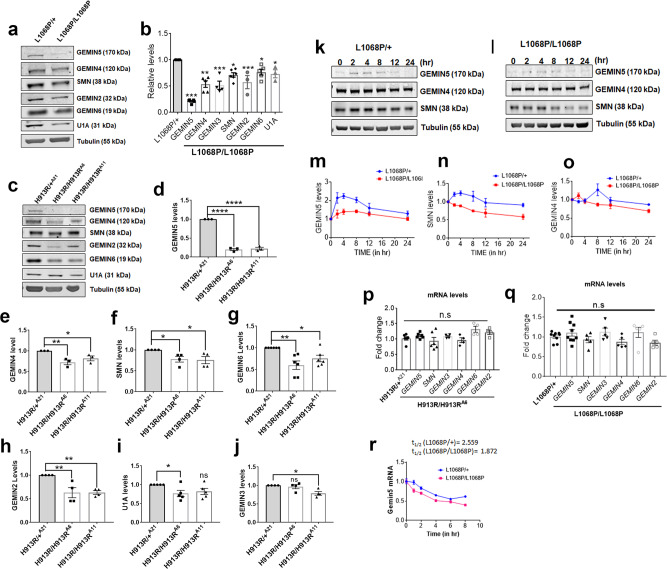
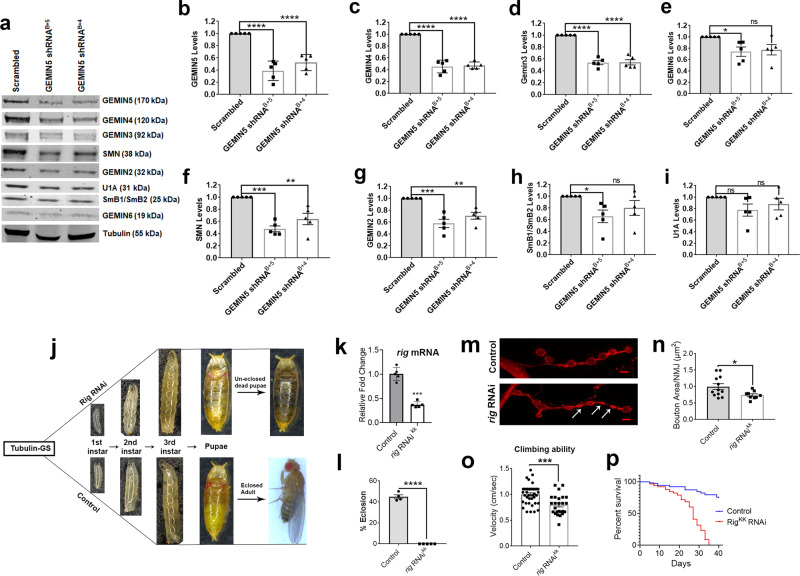
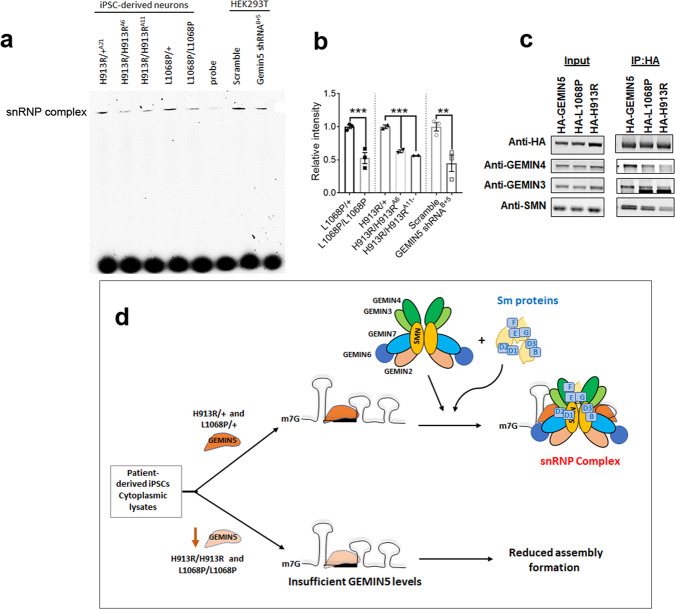
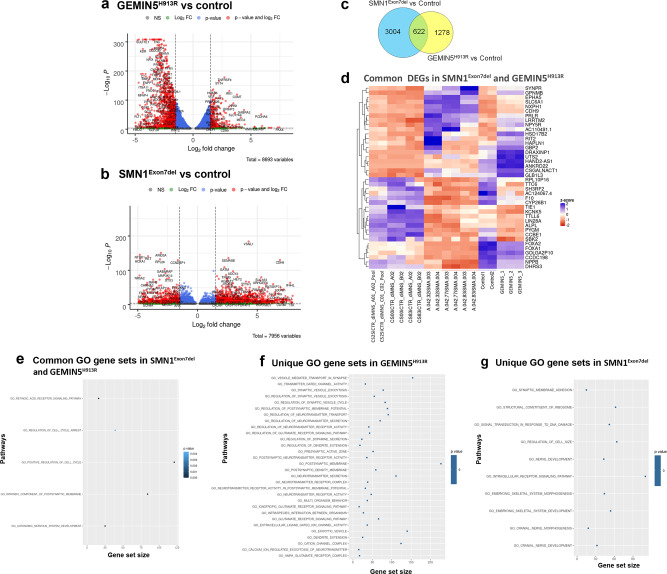
GEMIN5, an RNA-binding protein is essential for assembly of the survival motor neuron (SMN) protein complex and facilitates the formation of small nuclear ribonucleoproteins (snRNPs), the building blocks of spliceosomes. Here, we have identified 30 affected individuals from 22 unrelated families presenting with developmental delay, hypotonia, and cerebellar ataxia harboring biallelic variants in the GEMIN5 gene. Mutations in GEMIN5 perturb the subcellular distribution, stability, and expression of GEMIN5 protein and its interacting partners in patient iPSC-derived neurons, suggesting a potential loss-of-function mechanism. GEMIN5 mutations result in disruption of snRNP complex assembly formation in patient iPSC neurons. Furthermore, knock down of rigor mortis, the fly homolog of human GEMIN5, leads to developmental defects, motor dysfunction, and a reduced lifespan. Interestingly, we observed that GEMIN5 variants disrupt a distinct set of transcripts and pathways as compared to SMA patient neurons, suggesting different molecular pathomechanisms. These findings collectively provide evidence that pathogenic variants in GEMIN5 perturb physiological functions and result in a neurodevelopmental delay and ataxia syndrome.


Conflict of interest statement

J.E.L. is a member of the scientific advisory board for Cerevel Therapeutics. J.E.L. is a consultant and may provide expert testimony for Perkins Coie LLP. All other authors declare no competing interests.

Figures

Fig. 1
Fig. 1. Variants in GEMIN5 cause developmental delay, hypotonia, motor dysfunction, and cerebellar atrophy.
a Pedigree of the patients with homozygous variants in GEMIN5. Affected individuals who underwent clinical examinations are represented by arrowhead. b Multiple sequence alignment showing conservation of amino acid residues in GEMIN5 (red rectangle) across species. Polyphen-2 analysis predicted probably damaging effect of variants on GEMIN5 structure and function. c Schematic showing functional domains and position of homozygous variants in GEMIN5 protein. dj MRI scans showing characteristic cerebellar atrophy (white arrow) in patients carrying different bi-allelic variants in GEMIN5 (+ represents wild type allele of GEMIN5).
Fig. 2
Fig. 2. Differential subcellular expression of SMN assembly proteins in iPSC-derived neuronal cells carrying His913Arg and Leu1068Pro GEMIN5 variants.
a Representative Immunofluorescence (IF) images showing the sub-cellular mislocalization of GEMIN5 in IPSCs derived neuronal cells carrying p. His913Arg and p. Leu1068Pro hetero- and homozygous variants. H913R/H913RA6 and H913R/H913RA11 were the two isogenic iPSC clones for H913R homozygous variant used in the study (scale bar = 10 µm). b, c Quantitative analysis displaying the changes in nuclear (b) cytoplasmic (c) distribution pattern of GEMIN5 as in (a), measured as integrated density values (IDV) in H913R hetero and homozygous neuronal cells (one-way ANOVA- Bonferroni test, n = 30–40). d, e Quantitative analysis showing the nuclear (d) cytoplasmic (e) distribution of GEMIN5 as in (a) in L1068P hetero and homozygous neuronal cells (two tailed Mann–Whitney U test, n = 25–30). f Representative IF images showing the differential subcellular pattern of GEMIN2 in IPSCs-derived H913R and L1068P neuronal cells (scale bar = 10 µm). gj Quantitative bar plot representing the integrated density values of GEMIN2 in the nucleus (g, i) and cytoplasm (h, j) of H913R (g, h) and L1068P (i, j) GEMIN5 neuronal cell soma (two tailed Mann–Whitney U test, n ≥ 25). The data are represented as mean ± SEM. P values (****<0.0001, ***<0.001, **<0.01) are of unpaired Student’s t test. Source data are provided as a Source Data file.
Fig. 3
Fig. 3. GEMIN5 variants reduce the levels of GEMIN5 and SMN assembly proteins.
a Western blot (WB) analysis of total protein extract from IPSC-derived neuronal cells carrying mono-allelic and bi-allelic L1068P GEMIN5 variants depicting the levels of GEMIN5, GEMIN4, GEMIN6, and GEMIN2, SMN, and U1A, respectively. b Quantitative bar plots showing the reduced levels of GEMIN5 and SMN assembly proteins in L1068P homozygous neurons compared to heterozygous controls (two-tailed unpaired t test, n = 4). c Representative WB depicting the expression levels of GEMIN5 and SMN complex proteins in heterozygous and homozygous H913R neurons dj, Quantitative comparison of expression levels of GEMIN5 (d), GEMIN4 (e), SMN (f), GEMIN6 (g), GEMIN2 (h), U1A (i), and GEMIN3 (j) between H913R−/− and H913R+/− neuronal cells as in (d) (one-way ANOVA-Bonferroni test, n = 4). k, l Representative WB showing the protein levels of GEMIN5, GEMIN4, and SMN in L1068P heterozygous (k) and homozygous (l) neurons after 0, 2, 4, 8, 12, and 24 h of cycloheximide (CHX) treatment. Tubulin was used as normalization control. mo Quantitative analysis of the rate of degradation of GEMIN5 (m), SMN (n), and GEMIN4 (o) after CHX treatment showed the increased rate of depletion of GEMIN5 and SMN in homozygous L1068P neurons as compared to heterozygous controls (nonlinear regression-one phase decay, n = 4). p, q Expression analysis of GEMIN5, SMN, and other GEM-proteins by qPCR in L1068P (p) and H913R (q) neurons. The transcript levels of GEMIN5, GEMIN4, GEMIN3, GEMIN6, GEMIN2, and SMN showed no significant changes among heterozygous and homozygous GEMIN5, L1068P, and H193R variants (two tailed Mann–Whitney U test, n = 6). r Quantitative PCR showing the relative stability of GEMIN5 mRNA between hetero and homozygous L1068P neurons by using total RNA isolated at 0, 1, 2, 4, 6, and 8 h after actinomycin D treatment (nonlinear regression-one phase decay, n = 4). The data represent mean ± SEM. P values (****<0.0001, ***<0.001, **<0.01). Source data are provided as a Source Data file.
Fig. 4
Fig. 4. Loss of GEMIN5 leads to decrease levels of snRNP complex proteins and, developmental defects and motor dysfunction in Drosophila.
a Representative WB showing the effect of shRNA-mediated knockdown of GEMIN5 on the levels of GEMIN4, GEMIN3, GEMIN2, GEMIN6, SMN, SmB1/B2, and U1A as compared to scrambled control. GEMIN5 shRNA B was used in combination with GEMIN5 shRNA 5 and 4 to obtain the maximum knockdown efficiency. α tubulin was used as internal control (n = 5). bI Quantitative analysis showed a significant decrease in the levels of GEMIN4 (c), GEMIN3 (d), GEMIN6 (e), SMN (f), GEMIN2 (g), and SmB1/B2 (h) upon ~65% knockdown of GEMIN5 (b). No significant change was found in U1A protein levels (i) (one-way ANOVA-Bonferroni test, n = 5). j Flow diagram comparing different developmental stages of flies between rigor mortis RNAi and W1118 control flies. RNAi-mediated knockdown of rigor mortis, as determined by qPCR in (k), resulted in pupal lethality (j) and eclosion defects (l) as measured by percentage eclosed adult homozygous flies (two tailed unpaired t test, n = 5). The RNAi transgene under inducible tubulin-UAS gal4 system was expressed by growing the larvae on 1 mM RU486 drug food. m Representative IF images of neuromuscular junction (NMJ) marked with HRP (pre-synaptic marker) in the larval segment expressing rig mortis RNAi compared to control (scale bar = 10 µm). n Quantitative comparison of the bouton size measured as area per NMJ between the rig mortis RNAi expressing larvae and control (two-tailed Mann–Whitney U test, n = 12). o Bar graph representing rapid iterative negative geotaxis (RING) assay, calculated as climbing speed of a fly per second, showed significant defects in the climbing velocities of flies with RNAi-mediated GEMIN5 KD as compared to controls. The effect was apparent when the transgene was expressed for 20 days on 20 mM RU486 drug food under the control of tubulin-GS driver (two-tailed Mann–Whitney U test, n = 25–39). p Kaplan–Meier survival plot showing the effect of the loss of endogenous rig mortis on the life span of flies. The flies were grown on 20 mM RU486 drug food to express the rig mortis RNAi transgene and monitored every day for the span of 45 days (log-rank (Mantel–Cox) test, n = 80). The data represent mean ± SEM. P values (****<0.0001, ***<0.001, **<0.01). Source data are provided as a Source Data file.
Fig. 5
Fig. 5. Biallelic variants in GEMIN5 disrupts SMN assembly formation in vitro.
a Representative gel image showing the in vitro snRNP assembly formation by using 3′ Cy3-biotin-labeled U1 snRNA and the cytoplasmic extract from heterozygous and homozygous L1068P and H913R neurons as well as from the HEK293T cells transfected with GEMIN5 shRNA. b Quantitative analysis of the in vitro SMN complex formation as given in (a) (one-way ANOVA-Bonferroni test, n = 3). c Immunoprecipitation blot showing the reduced interaction of HA-tagged Leu1068Pro and His913Arg variants with GEMIN4, GEMIN3, and SMN as compared to HA-GEMIN5 WT protein in HEK cells. d Diagrammatic representation showing the possible mode of disruption in snRNP complex formation due to loss of GEMIN5 in L1068P and H913R variants. P-values ***<0.01, **<0.05. Source data are provided as a Source Data file.
Fig. 6
Fig. 6. RNA-seq analysis of GEMIN5 patient iPSC neurons reveals a distinct and unique transcriptomic profile compared to SMA patient iPSC neurons.
a, b Volcano plot showing up and down-regulated genes in SMNExon7del vs. control (a) and, GEMIN5H913R vs. control (b) selected by p-value < 0.01 & log2(fold change) ≥ 1.5. The x-axes show log2 values of the fold changes in gene expression between the samples and y-axis shows −log10-transformed p-values. Significant genes were selected after Benjamini–Hochberg (BH) correction. c Venn diagram showing the number of genes that are shared between SMA and GEMIN5 and the genes which are exclusively to both. Only the DEGs with ≥1.5 log-fold DEGs were used for the comparison. d Heat map depicting the expression pattern of top 20 up and downregulated DEGs common to both SMNExon7del and GEMIN5H913R. Significant genes were selected by Wald test in DESeq2 and multiple test correction by BH. eg Functional characterization of the genes with the MSigDB ‘c5 Gene Ontology (GO), biological process ontology (BP) v6.0’ gene sets in SMNExon7del and GEMIN5H913R (e), unique to GEMIN5H913R (f) and SMNExon7del (g). The size of the dot corresponds to the number of genes per term, and the color of the dot indicates the enrichment significance. Source data are provided as a Source Data file.

References

    1. Nussbacher JK, Tabet R, Yeo GW, Lagier-Tourenne C. Disruption of RNA metabolism in neurological diseases and emerging therapeutic interventions. Neuron. 2019;102:294–320. doi: 10.1016/j.neuron.2019.03.014. - DOI - PMC - PubMed
    1. Castello A, Fischer B, Hentze MW, Preiss T. RNA-binding proteins in Mendelian disease. Trends Genet. 2013;29:318–327. doi: 10.1016/j.tig.2013.01.004. - DOI - PubMed
    1. Dreyfuss G, Kim VN, Kataoka N. Messenger-RNA-binding proteins and the messages they carry. Nat. Rev. Mol. Cell Biol. 2002;3:195–205. doi: 10.1038/nrm760. - DOI - PubMed
    1. Gerstberger S, Hafner M, Tuschl T. A census of human RNA-binding proteins. Nat. Rev. Genet. 2014;15:829–845. doi: 10.1038/nrg3813. - DOI - PMC - PubMed
    1. Glisovic T, Bachorik JL, Yong J, Dreyfuss G. RNA-binding proteins and post-transcriptional gene regulation. FEBS Lett. 2008;582:1977–1986. doi: 10.1016/j.febslet.2008.03.004. - DOI - PMC - PubMed

Publication types

MeSH terms

Substances