Half-life modeling of basic fibroblast growth factor released from growth factor-eluting polyelectrolyte multilayers
- PMID: 33963247
- PMCID: PMC8105364
- DOI: 10.1038/s41598-021-89229-w
Half-life modeling of basic fibroblast growth factor released from growth factor-eluting polyelectrolyte multilayers
Abstract
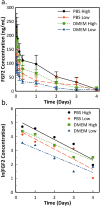
Growth factor-eluting polymer systems have been widely reported to improve cell and tissue outcomes; however, measurements of actual growth factor concentration in cell culture conditions are limited. The problem is compounded by a lack of knowledge of growth factor half-lives, which impedes efforts to determine real-time growth factor concentrations. In this work, the half-life of basic fibroblast growth factor (FGF2) was determined using enzyme linked immunosorbent assay (ELISA). FGF2 release from polyelectrolyte multilayers (PEMs) was measured and the data was fit to a simple degradation model, allowing for the determination of FGF2 concentrations between 2 and 4 days of culture time. After the first hour, the FGF2 concentration for PEMs assembled at pH = 4 ranged from 2.67 ng/mL to 5.76 ng/mL, while for PEMs assembled at pH = 5, the concentration ranged from 0.62 ng/mL to 2.12 ng/mL. CRL-2352 fibroblasts were cultured on PEMs assembled at pH = 4 and pH = 5. After 2 days, the FGF2-eluting PEM conditions showed improved cell count and spreading. After 4 days, only the pH = 4 assembly condition had higher cells counts, while the PEM assembled at pH = 5 and PEM with no FGF2 showed increased spreading. Overall, the half-life model and cell culture study provide optimal concentration ranges for fibroblast proliferation and a framework for understanding how temporal FGF2 concentration may affect other cell types.
Conflict of interest statement
The authors are inventors of a patent (US Patent 10731145) for coated cell culture apparatuses using polyelectrolyte multilayers that may be capable of controlled release.
Figures


Similar articles
-
Growth-Factor-Releasing Polyelectrolyte Multilayer Films to Control the Cell Culture Environment.Langmuir. 2018 Jan 23;34(3):1178-1189. doi: 10.1021/acs.langmuir.7b02846. Epub 2017 Oct 17. Langmuir. 2018. PMID: 28976765
-
Concentration- and time-dependent response of human gingival fibroblasts to fibroblast growth factor 2 immobilized on titanium dental implants.Int J Nanomedicine. 2012;7:1965-76. doi: 10.2147/IJN.S29538. Epub 2012 Apr 17. Int J Nanomedicine. 2012. PMID: 22619534 Free PMC article.
-
Molecular composition of GAG-collagen I multilayers affects remodeling of terminal layers and osteogenic differentiation of adipose-derived stem cells.Acta Biomater. 2016 Sep 1;41:86-99. doi: 10.1016/j.actbio.2016.05.023. Epub 2016 May 14. Acta Biomater. 2016. PMID: 27188244
-
The Potential of Polyelectrolyte Multilayer Films as Drug Delivery Materials.Int J Mol Sci. 2022 Mar 23;23(7):3496. doi: 10.3390/ijms23073496. Int J Mol Sci. 2022. PMID: 35408857 Free PMC article. Review.
-
Layer-By-Layer Assemblies of Biopolymers: Build-Up, Mechanical Stability and Molecular Dynamics.Polymers (Basel). 2020 Aug 28;12(9):1949. doi: 10.3390/polym12091949. Polymers (Basel). 2020. PMID: 32872246 Free PMC article. Review.
Cited by
-
Facile and rapid fabrication of a novel 3D-printable, visible light-crosslinkable and bioactive polythiourethane for large-to-massive rotator cuff tendon repair.Bioact Mater. 2024 Apr 25;37:439-458. doi: 10.1016/j.bioactmat.2024.03.036. eCollection 2024 Jul. Bioact Mater. 2024. PMID: 38698918 Free PMC article.
-
Fabricating Microfluidic Co-Cultures of Immortalized Cell Lines Uncovers Robust Design Principles for the Simultaneous Formation of Patterned, Vascularized, and Stem Cell-Derived Adipose Tissue.Small. 2025 Aug;21(32):e2501834. doi: 10.1002/smll.202501834. Epub 2025 Jun 17. Small. 2025. PMID: 40525656 Free PMC article.
-
Optimization of Media Change Intervals through Hydrogels Using Mathematical Models.Biomacromolecules. 2023 Feb 13;24(2):604-612. doi: 10.1021/acs.biomac.2c00961. Epub 2023 Feb 1. Biomacromolecules. 2023. PMID: 36724373 Free PMC article.
-
Scaling Cultured Meat: Challenges and Solutions for Affordable Mass Production.Compr Rev Food Sci Food Saf. 2025 Jul;24(4):e70221. doi: 10.1111/1541-4337.70221. Compr Rev Food Sci Food Saf. 2025. PMID: 40635127 Free PMC article. Review.
-
Biocompatible Macroion/Growth Factor Assemblies for Medical Applications.Biomolecules. 2023 Mar 28;13(4):609. doi: 10.3390/biom13040609. Biomolecules. 2023. PMID: 37189357 Free PMC article. Review.
References
Publication types
MeSH terms
Substances
LinkOut - more resources
Full Text Sources
Other Literature Sources
Research Materials

