. 2021 Jul;22(7):829-838.
doi: 10.1038/s41590-021-00937-x. Epub 2021 May 7.

TLR2 senses the SARS-CoV-2 envelope protein to produce inflammatory cytokines

Affiliations

TLR2 senses the SARS-CoV-2 envelope protein to produce inflammatory cytokines

Min Zheng et al. Nat Immunol. 2021 Jul.

Abstract

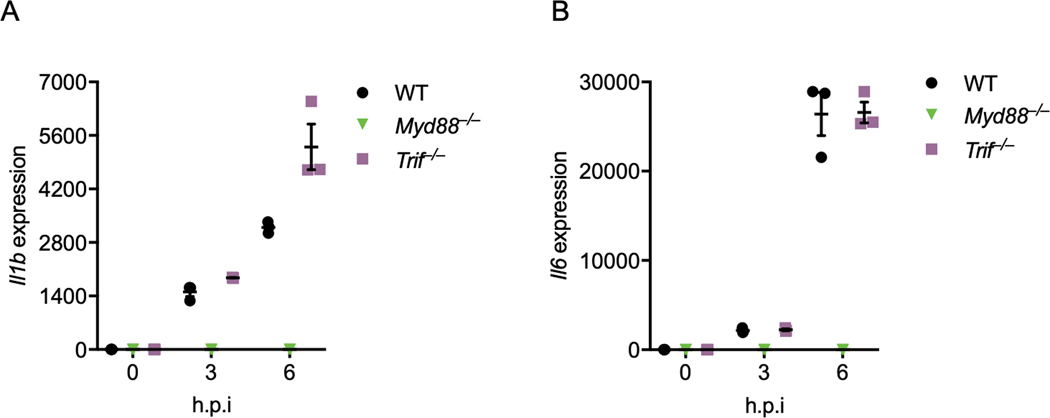
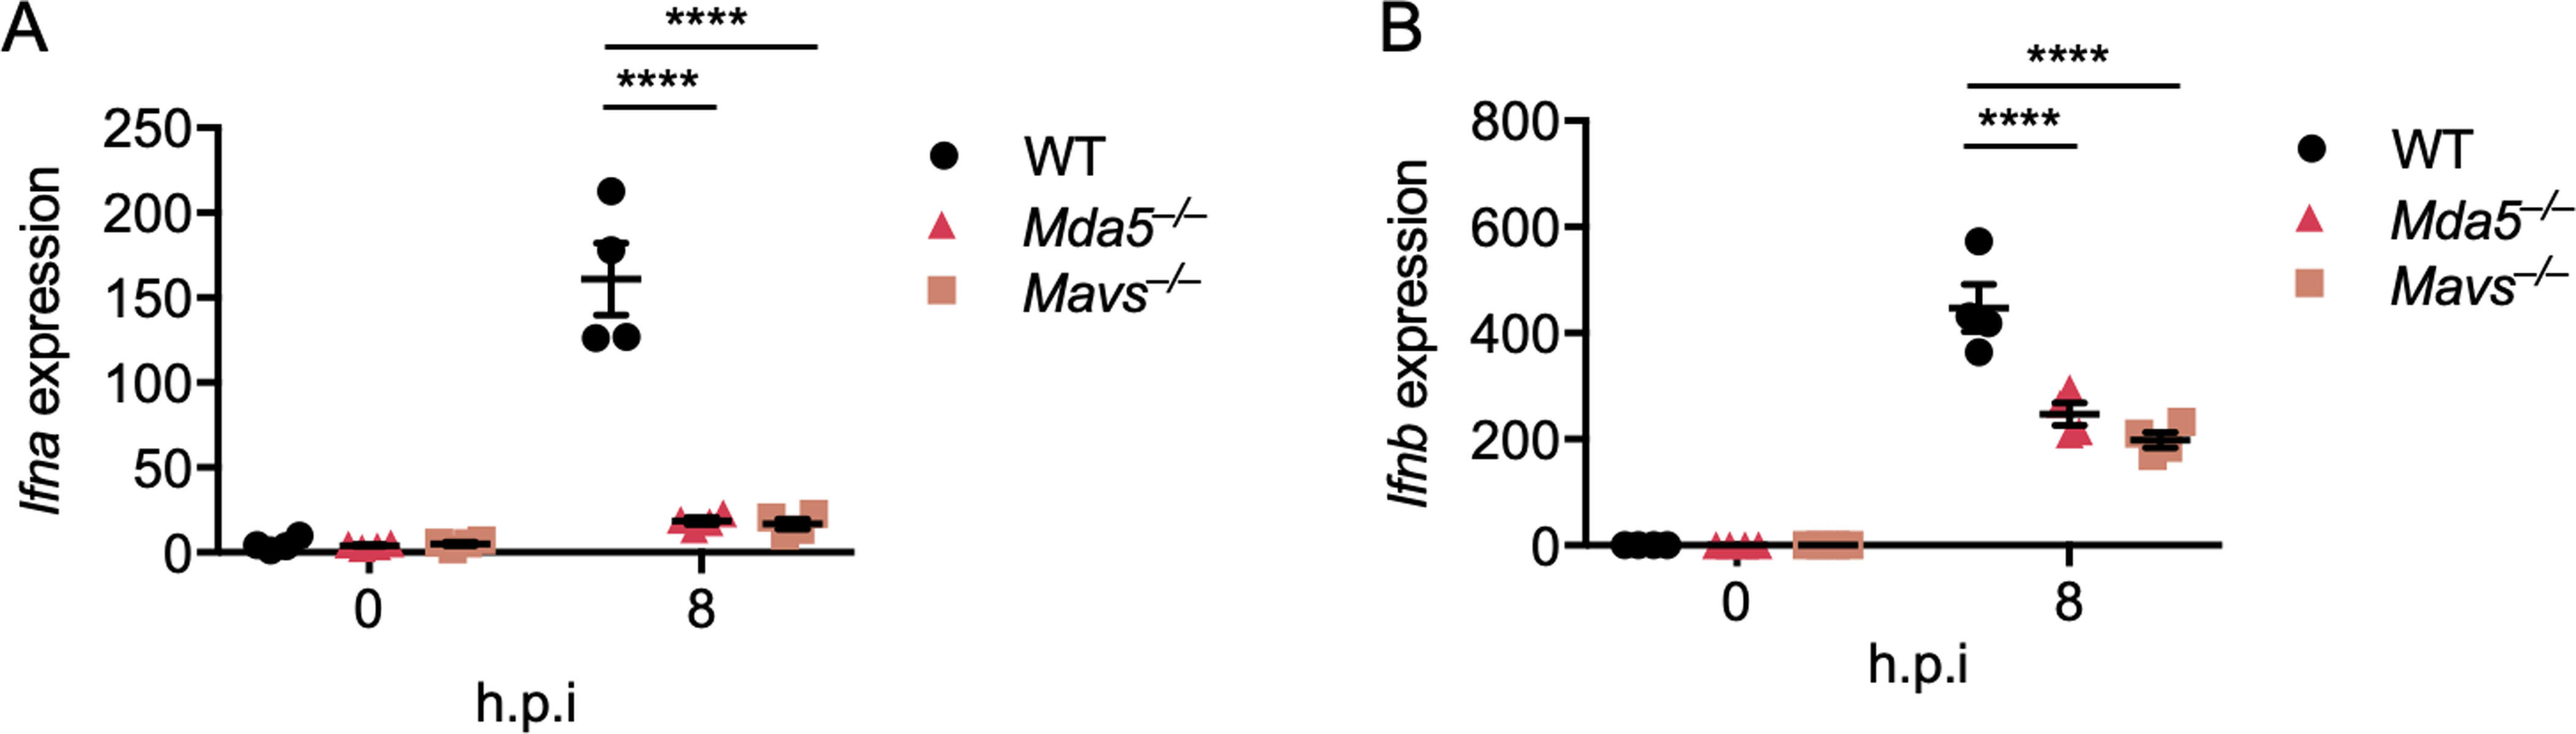
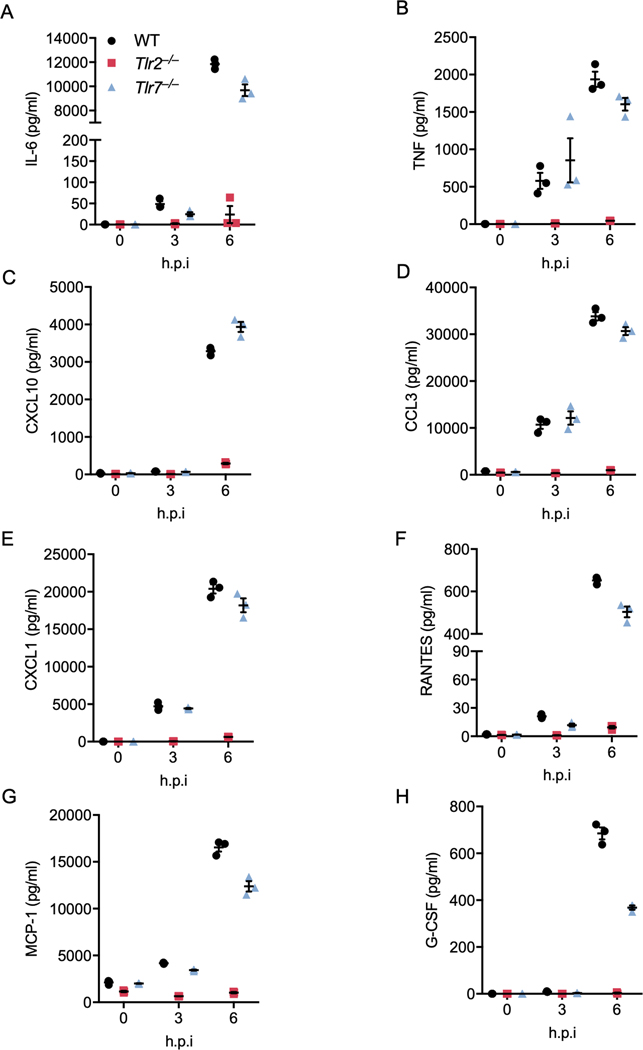
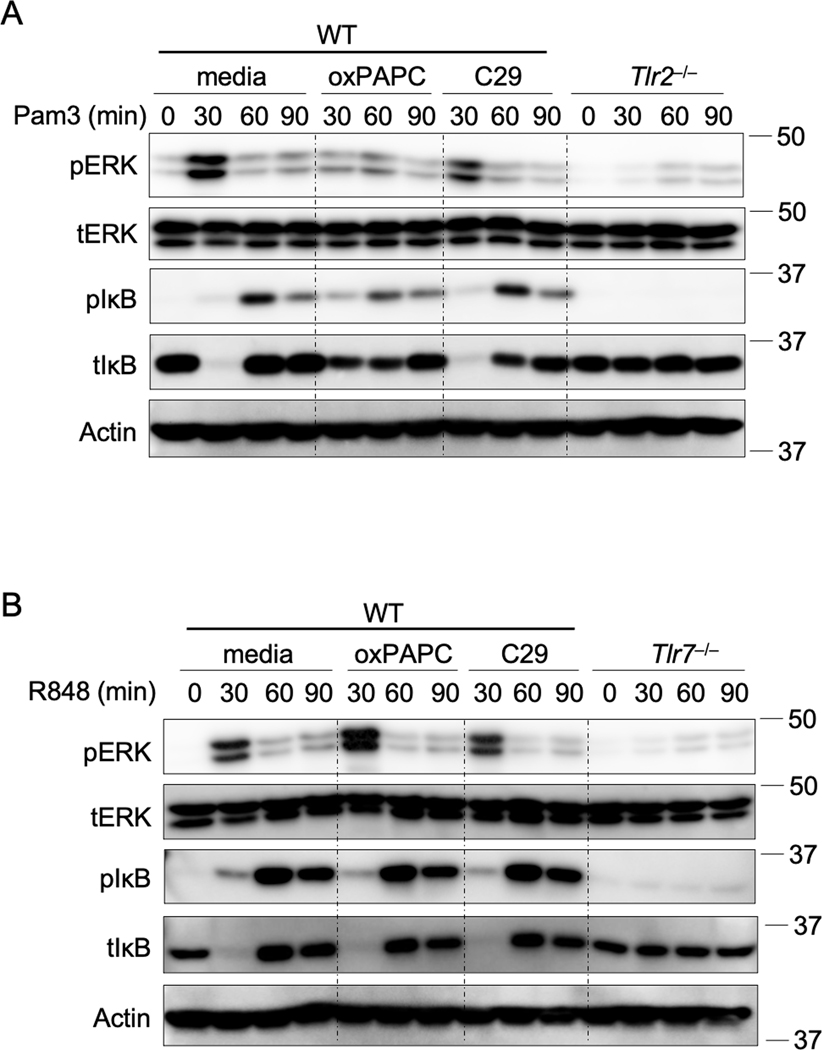
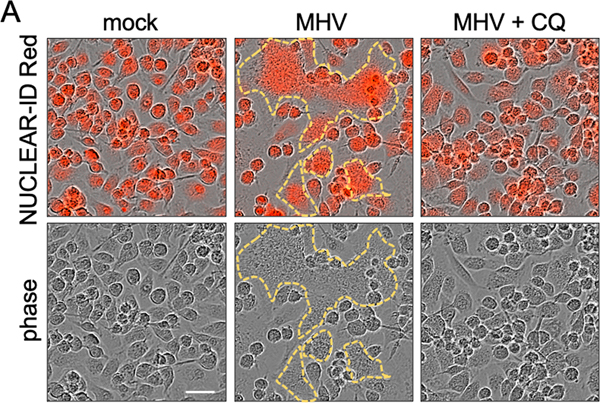
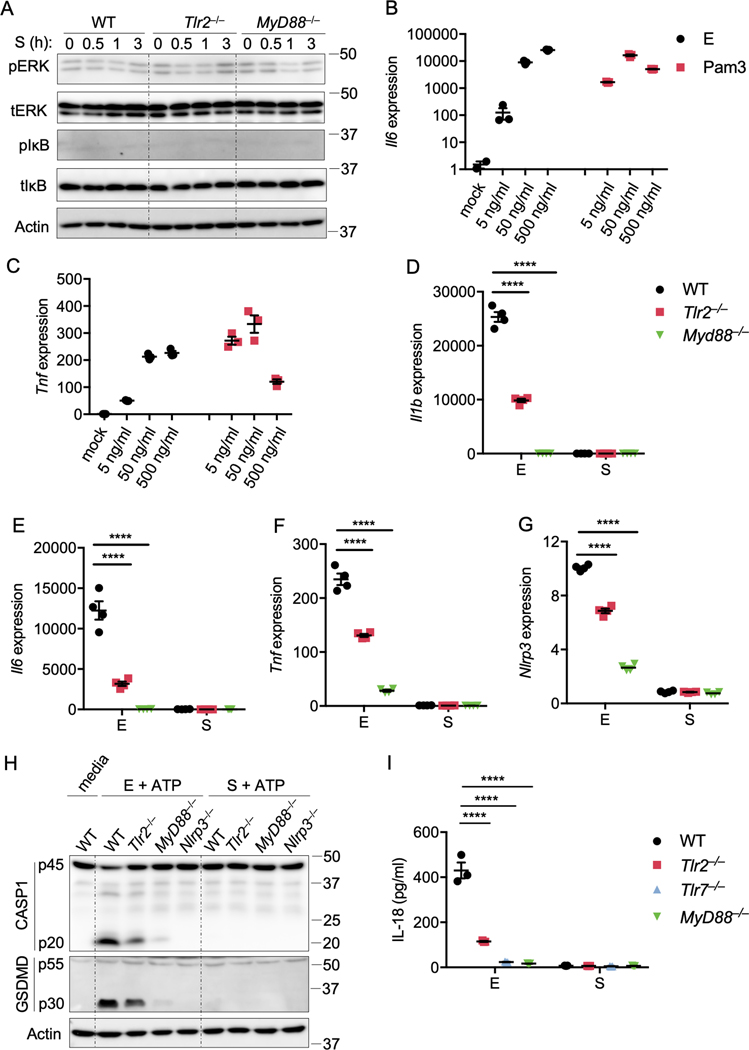
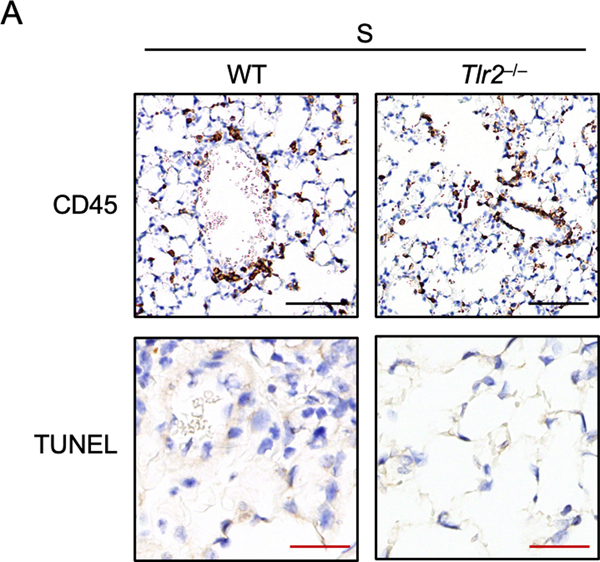
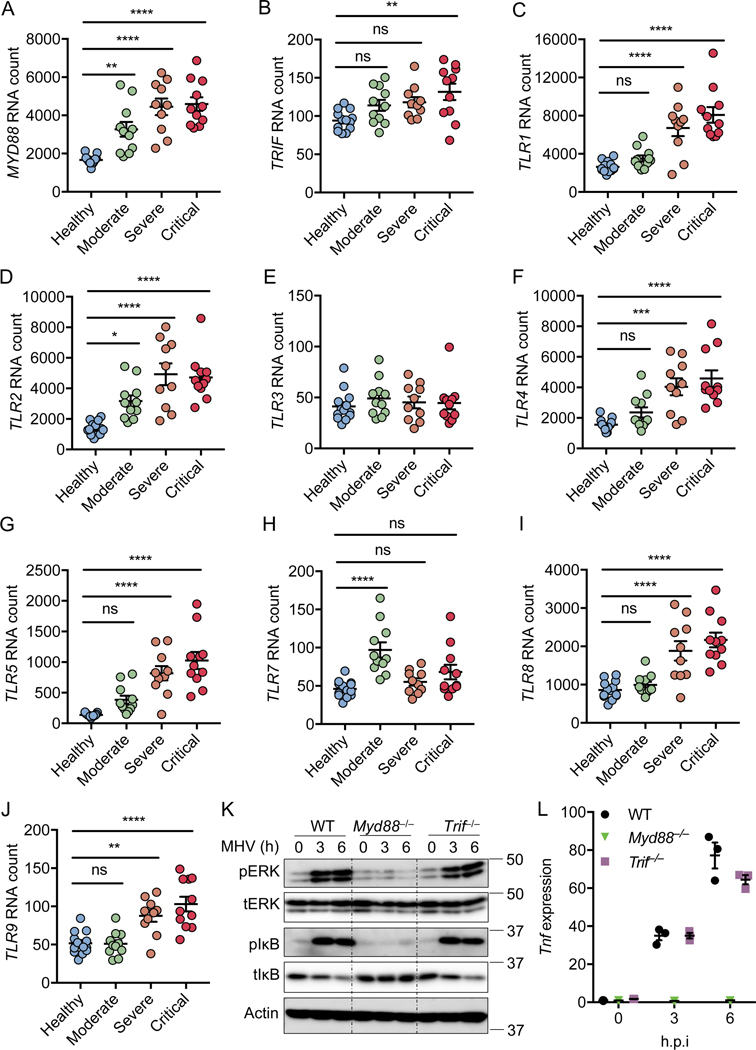
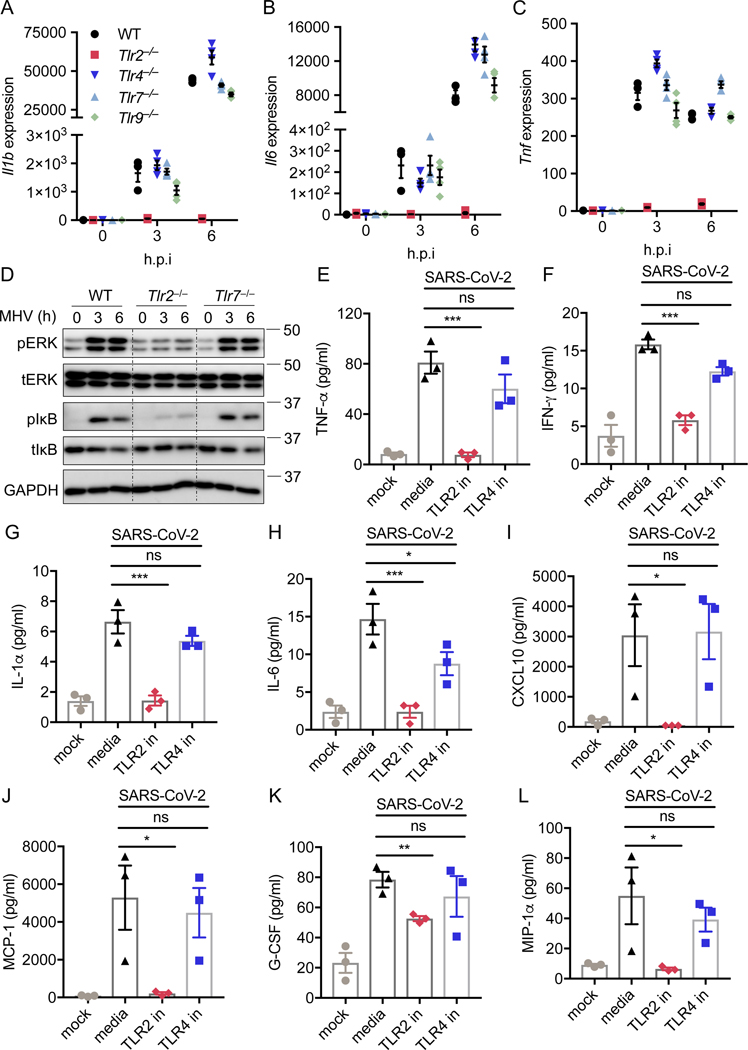
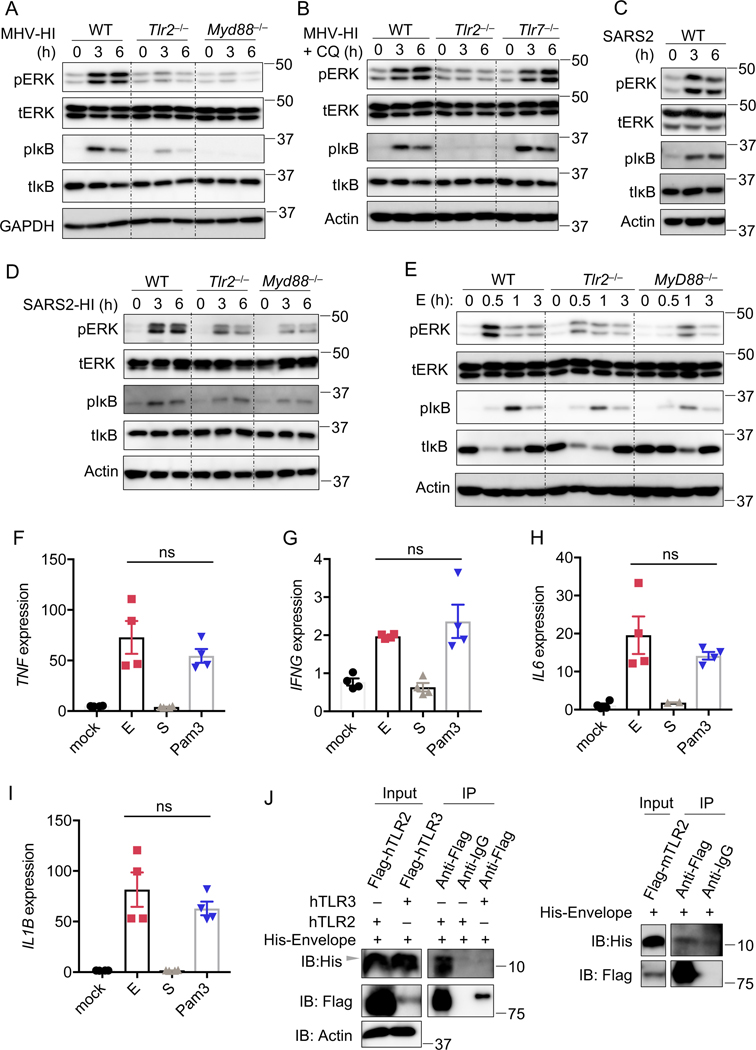
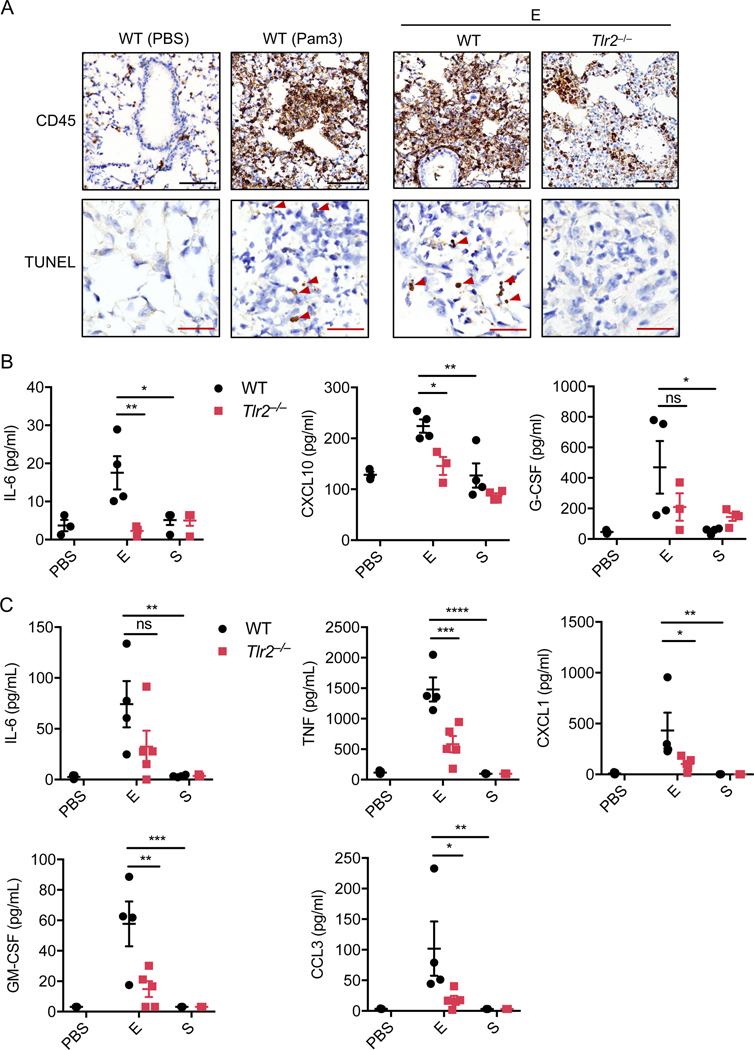
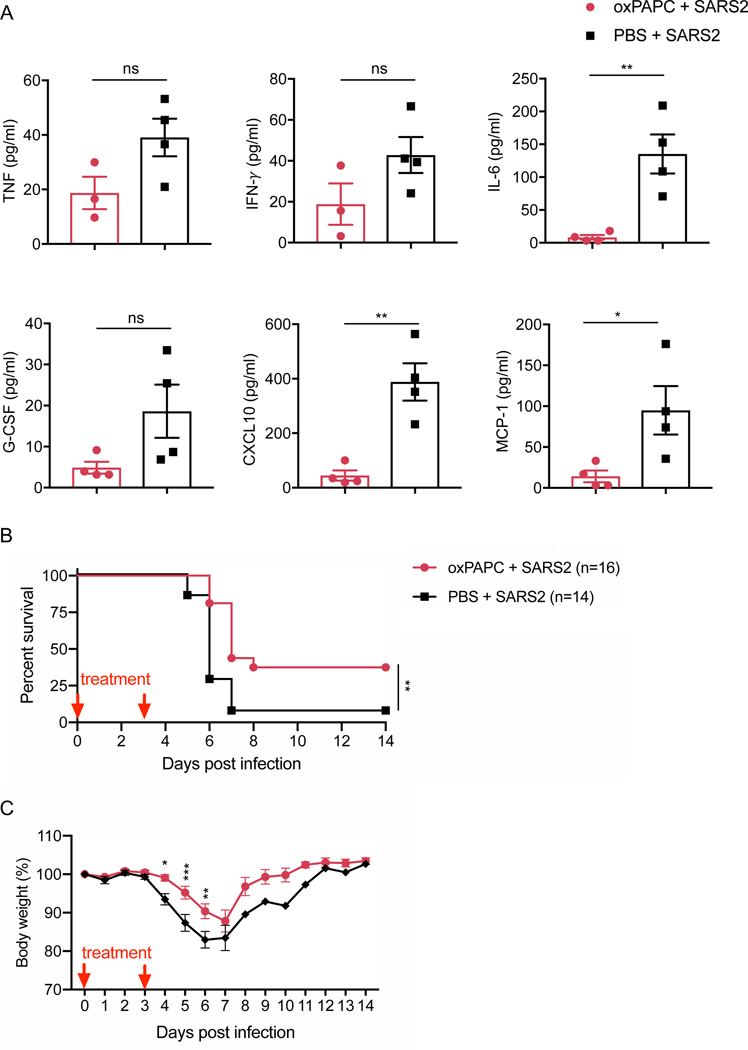
The innate immune response is critical for recognizing and controlling infections through the release of cytokines and chemokines. However, severe pathology during some infections, including SARS-CoV-2, is driven by hyperactive cytokine release, or a cytokine storm. The innate sensors that activate production of proinflammatory cytokines and chemokines during COVID-19 remain poorly characterized. In the present study, we show that both TLR2 and MYD88 expression were associated with COVID-19 disease severity. Mechanistically, TLR2 and Myd88 were required for β-coronavirus-induced inflammatory responses, and TLR2-dependent signaling induced the production of proinflammatory cytokines during coronavirus infection independent of viral entry. TLR2 sensed the SARS-CoV-2 envelope protein as its ligand. In addition, blocking TLR2 signaling in vivo provided protection against the pathogenesis of SARS-CoV-2 infection. Overall, our study provides a critical understanding of the molecular mechanism of β-coronavirus sensing and inflammatory cytokine production, which opens new avenues for therapeutic strategies to counteract the ongoing COVID-19 pandemic.


Conflict of interest statement

COMPETING INTERESTS STATEMENT

The authors declare no competing interest.

Figures

Extended Data Fig. 1
Extended Data Fig. 1. Myd88 is required for MHV-induced inflammatory responses
(A and B) Real-time PCR analysis of the expression of Il1b (A) and Il6 (B) in WT, Myd88–/–, and Trif–/– bone marrowderived macrophages (BMDMs) after infection with MHV at a MOI of 0.1 for the indicated time, presented relative to levels of the host gene Gapdh. Data are representative of three independent experiments. Data are shown as mean ± SEM (n = 3) (A and B).
Extended Data Fig. 2
Extended Data Fig. 2. MDA5 is required for MHV-induced type I interferon expression
(A and B) Real-time PCR analysis of the expression of Ifna (A) and Ifnb (B) in WT, Mda5–/–, and Mavs–/– bone marrowderived macrophages (BMDMs) after infection with MHV at a MOI of 0.1 for the indicated time, presented relative to levels of the host gene Gapdh. Significant differences compared to the WT group infected with MHV are denoted as ****P < 0.0001 (two-way ANOVA) (A and B). Data are representative of three independent experiments. Data are shown as mean ± SEM (n = 3) (A–B).
Extended Data Fig. 3
Extended Data Fig. 3. TLR2 is essential to Inflammatory cytokine expression during MHV infection
(A–H) Release of IL-6 (A), TNF-α (B), CXCL10 (C), CCL3 (D), CXCL1 (E), RANTES (F), MCP-1 (G), and G-CSF (H) from bone marrow-derived macrophages (BMDMs) infected with MHV at a MOI of 0.1 for the indicated time. Data are representative of three independent experiments. Data are shown as mean ± SEM (n = 3) (A–H).
Extended Data Fig. 4
Extended Data Fig. 4. oxPAPC is a potent TLR2 inhibitor
(A) Immunoblot analysis of phospho-ERK (pERK), total ERK (tERK), pIκB, and tIκB in WT and Tlr2–/– bone marrow-derived macrophages (BMDMs) after stimulation with 1 μg/ml of Pam3CSK4 (Pam3) for the indicated time with or without the TLR2 inhibitor oxPAPC or C29. (B) Immunoblot analysis of pERK, tERK, pIκB, and tIκB in WT and Tlr7–/– BMDMs after stimulation with 1 μg/ml of R848 for the indicated time with or without the TLR2 inhibitor oxPAPC or C29. Data are representative of two independent experiments.
Extended Data Fig. 5
Extended Data Fig. 5. Chloroquine can inhibit MHV-induced cell fusion
(A) Cell fusion of wild type (WT) bone marrow-derived macrophages (BMDMs) after infection with MHV at a MOI of 0.1 for 8 h in the absence or presence of 10 μM chloroquine (CQ). The upper panel was obtained via IncuCyte after staining with NUCLEAR-ID Red, and the lower panel is the corresponding phase channel. The yellow outline indicates the fused cells. Scale bar, 30 μm. Data are representative of three independent experiments.
Extended Data Fig. 6
Extended Data Fig. 6. TLR2 can sense the envelope protein but not spike protein of SARS-CoV-2
(A) Immunoblot analysis of phospho-ERK (pERK), total ERK (tERK), pIκB, and tIκB in WT, Tlr2–/–, and Myd88–/– BMDMs after stimulation with 1 μg/ml of the spike (S) protein from SARS-CoV-2 for the indicated time. Actin was used as the internal control. (B and C) Real-time PCR analysis of the expression of Il6 (B) and Tnf (C) in WT BMDMs after stimulating with the envelope (E) protein of SARS-CoV-2 or Pam3CSK4 (Pam3) for 2 h, presented relative to levels of the host gene Gapdh. (D–G) Real-time PCR analysis of the expression of Il1b (D), Il6 (E), Tnf (F), and Nlrp3 (G) in WT, Tlr2–/–, and Myd88–/– BMDMs after stimulation with 1 μg/ml of the E or S protein from SARSCoV-2 for 4 h, presented relative to levels of the host gene Gapdh. (H) Immunoblot analysis of pro- (p45) and cleaved caspase-1 (p20; CASP1) and pro (p55) and cleaved gasdermin D (p30; GSDMD) in BMDMs primed with 1 μg/ml of the E or S protein from SARS-CoV-2 for 4 h and then stimulated with ATP for 45 min. Actin was used as the internal control. (I) Release of IL-18 from BMDMs after the treatment in (H). Significant differences compared to the WT group stimulated with E protein are denoted as ****P < 0.0001 (one-way ANOVA) (D–G, I). Data are representative of two (B and C) or three (A, D–I) independent experiments. Data are shown as mean ± SEM (n = 3) (B–G and I).
Extended Data Fig. 7
Extended Data Fig. 7. The spike protein of SARS-CoV-2 cannot induce inflammation and damage in mouse lungs
(A) CD45 immuno-staining and TUNEL staining of lung samples obtained from mice 24 h after being intratracheally instilled with the spike (S) protein from SARS-CoV-2. Data are representative of two independent experiments. Scale bar, 100 μm (black) or 25 μm (red).
Figure 1.
Figure 1.. MYD88 and TLRs are associated with the severity of COVID-19
(A–J) Absolute RNA counts of MYD88 (A), TRIF (B), TLR1 (C), TLR2 (D), TLR3 (E), TLR4 (F), TLR5 (G), TLR7 (H), TLR8 (I), and TLR9 (J) in patients with mild-to-moderate (n = 11), severe (n = 10), and critical (n = 11) COVID-19, and 13 healthy controls. (K) Immunoblot analysis of phospho-ERK (pERK), total ERK (tERK), pIκB, and tIκB in WT, Myd88–/–, and Trif–/– bone marrow-derived macrophages (BMDMs) after infection with MHV at a MOI of 0.1 for the indicated time. Actin was used as the internal control. (L) Real-time PCR analysis of Tnf expression in WT, Myd88–/–, and Trif–/– BMDMs after infection with MHV at a MOI of 0.1 for the indicated time, presented relative to levels of the host gene Gapdh. Significant differences compared to the healthy group are denoted as *P < 0.05, **P < 0.01, ***P < 0.001, and ****P < 0.0001; ns: not significant (one-way ANOVA). Exact P values are presented in Supplementary Table 1. Data are shown as mean ± SEM (A–J, L). Data are representative of three independent experiments (K and L).
Figure 2.
Figure 2.. TLR2 is required for the inflammatory response during β-coronavirus infection
(A–C) Real-time PCR analysis of the expression of Il1b (A), Il6 (B), and Tnf (C) in WT, Tlr2–/–, Tlr4–/–, Tlr7–/–, and Tlr9–/– bone marrow-derived macrophages (BMDMs) after infection with MHV at a MOI of 0.1 for the indicated time, presented relative to levels of the host gene Gapdh. (D) Immunoblot analysis of phospho-ERK (pERK), total ERK (tERK), pIκB, and tIκB in WT, Tlr2–/–, and Tlr7–/– BMDMs after infection with MHV at a MOI of 0.1 for the indicated time. GAPDH was used as the internal control. (E–L) TNF-α (E), IFN-γ (F), IL-1α (G), IL-6 (H), CXCL10 (I), MCP-1 (J), G-CSF (K), and CCL3 (L) release from human peripheral blood mononuclear cells (PBMCs) infected with SARS-CoV-2 at a MOI of 0.5 for 20 h with or without the TLR2 inhibitor (oxPAPC; TLR2 in) or TLR4 inhibitor (CLI-095; TLR4 in). Significant differences compared to the media control infection group are denoted as *P < 0.05 and ***P < 0.001; ns: not significant (one-way ANOVA) (E–L). Exact P values are presented in Supplementary Table 1. Data are representative of three independent experiments (A–D) or two independent experiments (E–L). Data are shown as mean ± SEM (n = 3 biological replicates) (A–C and E–L).
Figure 3.
Figure 3.. TLR2 can sense the envelope protein of β-coronaviruses
(A) Immunoblot analysis of phospho-ERK (pERK), total ERK (tERK), pIκB, and tIκB in WT, Tlr2–/–, and Myd88–/– bone marrow-derived macrophages (BMDMs) after stimulation with heat-inactivated MHV (MHV-HI) at a MOI of 0.1 for the indicated time. GAPDH was used as the internal control. (B) Immunoblot analysis of pERK, tERK, pIκB, and tIκB in WT, Tlr2–/–, and Tlr7–/– BMDMs after stimulation with MHV-HI for the indicated time. Chloroquine (CQ) at a final concentration of 10 μM was added 30 min before the stimulation. Actin was used as the internal control. (C) Immunoblot analysis of pERK, tERK, pIκB, and tIκB in WT BMDMs after stimulation with SARS-CoV-2 for the indicated time. Actin was used as the internal control. (D) Immunoblot analysis of pERK, tERK, pIκB, and tIκB in WT, Tlr2–/–, and Myd88–/– BMDMs after stimulation with heat-inactivated SARS-CoV-2 (SARS2-HI) for the indicated time. Actin was used as the internal control. (E) Immunoblot analysis of pERK, tERK, pIκB, and tIκB in WT, Tlr2–/–, and Myd88–/– BMDMs after stimulation with 1 μg/ml of the envelope (E) protein of SARS-CoV-2 for the indicated time. Actin was used as the internal control. (F–I) Real-time PCR analysis of the expression of TNF (F), IFNG (G), IL6 (H), and IL1B (I) in human peripheral blood mononuclear cells (PBMCs) after stimulation with 1 μg/ml of the E or spike (S) protein from SARS-CoV-2 or Pam3CSK4 (Pam3) for 4 h, presented relative to levels of the host gene GAPDH. (J) Immunoprecipitates and total lysates from 293T cells after incubation of purified E protein from SARS-CoV-2 with overexpressed human TLR2, TLR3 or mouse TLR2. Student’s t test was used for statistical analysis between E and Pam3 treated groups; ns: not significant. Data are representative of three independent experiments (A–J). ns, not significant (two-sided student’s t test) (F–I). Data are shown as mean ± SEM (n = 2 biological replicates plus 2 technical replicates) (F–I).
Figure 4.
Figure 4.. The envelope protein of SARS-CoV-2 can induce TLR2-dependent inflammation and damage in the lungs
(A) CD45 immuno-staining and TUNEL staining of lung samples obtained from mice 24 h after being intratracheally instilled with PBS (n= 3 biological replicates), the envelope (E) from SARS-CoV-2 (n = 4 biological replicates), or Pam3CSK4 (Pam3) (n = 4 biological replicates). Red arrows indicate TUNEL-positive cells. Scale bar, 100 μm (black) or 25 μm (red). (B) Levels of IL-6, CXCL10, and G-CSF in the serum of mice 24 h after being intratracheally instilled with PBS or the E or S protein from SARS-CoV-2. (C) Levels of IL-6, TNF-α, CXCL1, GM-CSF, and CCL3 in the bronchoalveolar lavage fluid (BALF) of mice 6 h after being intratracheally instilled with PBS or the E or S protein from SARS-CoV-2. Significant differences compared to WT group treated with E protein are denoted as *P < 0.05, **P < 0.01, *** P < 0.001 and ****P < 0.0001 (one-way ANOVA) (B and C). Exact P values are presented in Supplementary Table 1. Data are representative of two independent experiments (A–C). Data are shown as mean ± SEM (n = 3–5 biological replicates) (B and C).
Figure 5.
Figure 5.. Blocking TLR2 signaling protects against SARS-CoV-2 infection in vivo
(A) Levels of TNF-α, IFN-γ, IL-6, G-CSF, CXCL10, and MCP-1 in the bronchoalveolar lavage fluid (BALF) of mice 2 days after SARS-CoV-2 infection. (B) Pooled survival of 8- to 10-week-old K18-hACE2 transgenic mice after infection with SARS-CoV-2 (2 × 10⁴ pfu/mouse). (C) Pooled body weight change of infected mice in (B). Significant differences compared to the group treated with oxPAPC are denoted as *P < 0.05, **P < 0.01, and ***P < 0.001 (two-sided student’s t test (A), log-rank test (B), or two-way ANOVA (C)). Exact P values are presented in Supplementary Table 1. Data are shown as mean ± SEM (n = 3–4 biological replicates) (A) or (n = 14–16 biological replicates) (B and C).

References

    1. MacLachlan NJ & Dubovi EJ Chapter 24 Coronaviridae. in Fenner’s Veterinary Virology 435–461 (Academic Press, 2017). doi: 10.1016/B978-0-12-800946-8.00024-6. - DOI
    1. Hu B, Guo H, Zhou P. & Shi Z-L Characteristics of SARS-CoV-2 and COVID-19. Nature Reviews Microbiology 1–14 (2020) doi: 10.1038/s41579-020-00459-7. - DOI - PMC - PubMed
    1. Channappanavar R. & Perlman S. Pathogenic human coronavirus infections: causes and consequences of cytokine storm and immunopathology. Semin Immunopathol 39, 529–539 (2017). - PMC - PubMed
    1. Lucas C. et al. Longitudinal analyses reveal immunological misfiring in severe COVID-19. Nature 584, 463–469 (2020). - PMC - PubMed
    1. Zheng M. et al. Impaired NLRP3 inflammasome activation/pyroptosis leads to robust inflammatory cell death via caspase-8/RIPK3 during coronavirus infection. J. Biol. Chem (2020) doi: 10.1074/jbc.RA120.015036. - DOI - PMC - PubMed

Publication types

MeSH terms