

Prediction of 90-day mortality after surgery for colorectal cancer using standardized nationwide quality-assurance data
- PMID: 33963368
- PMCID: PMC8105588
- DOI: 10.1093/bjsopen/zrab023
Prediction of 90-day mortality after surgery for colorectal cancer using standardized nationwide quality-assurance data
Abstract
Background: Personalized risk assessment provides opportunities for tailoring treatment, optimizing healthcare resources and improving outcome. The aim of this study was to develop a 90-day mortality-risk prediction model for identification of high- and low-risk patients undergoing surgery for colorectal cancer.
Methods: This was a nationwide cohort study using records from the Danish Colorectal Cancer Group database that included all patients undergoing surgery for colorectal cancer between 1 January 2004 and 31 December 2015. A least absolute shrinkage and selection operator logistic regression prediction model was developed using 121 pre- and intraoperative variables and internally validated in a hold-out test data set. The accuracy of the model was assessed in terms of discrimination and calibration.
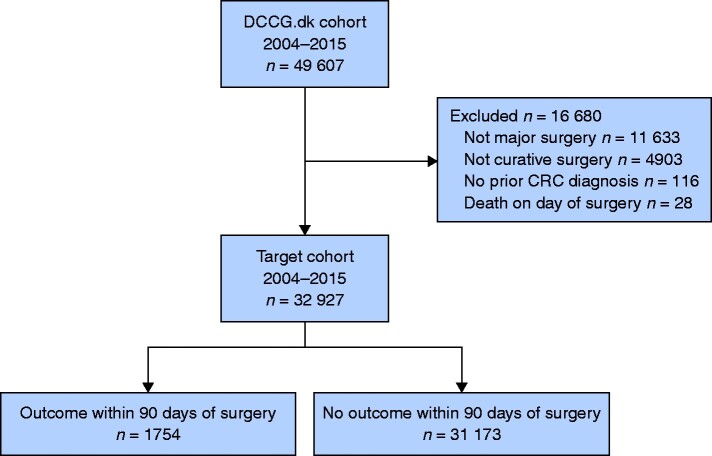
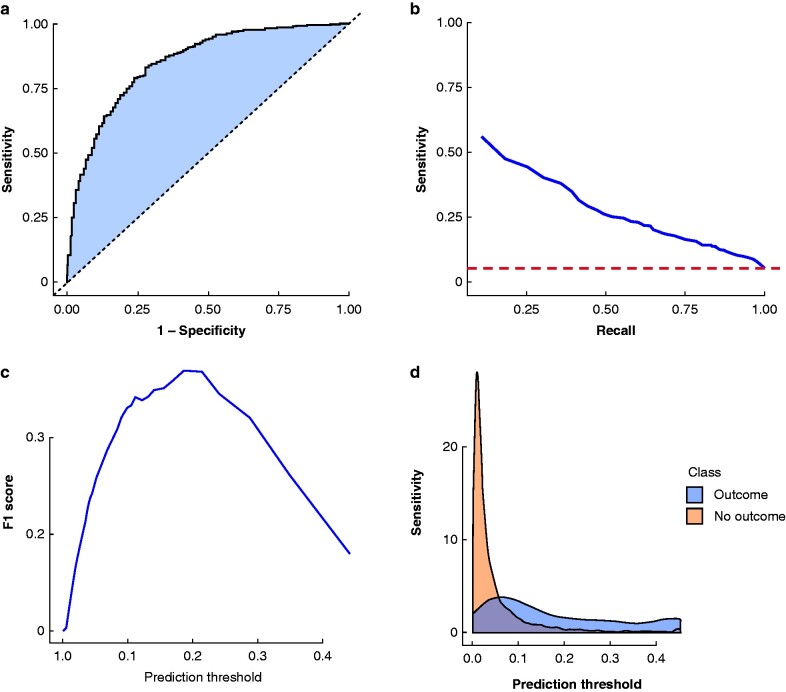
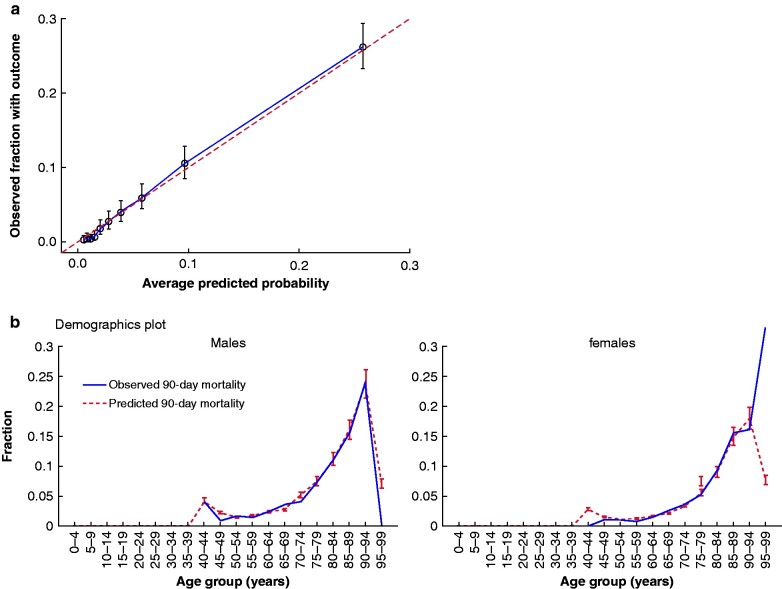
Results: In total, 49 607 patients were registered in the database. After exclusion of 16 680 individuals, 32 927 patients were included in the analysis. Overall, 1754 (5.3 per cent) deaths were recorded. Targeting high-risk individuals, the model identified 5.5 per cent of all patients facing a risk of 90-day mortality exceeding 35 per cent, corresponding to a 6.7 times greater risk than the average population. Targeting low-risk individuals, the model identified 20.9 per cent of patients facing a risk less than 0.3 per cent, corresponding to a 17.7 times lower risk compared with the average population. The model exhibited discriminatory power with an area under the receiver operating characteristics curve of 85.3 per cent (95 per cent c.i. 83.6 to 87.0) and excellent calibration with a Brier score of 0.04 and 32 per cent average precision.
Conclusion: Pre- and intraoperative data, as captured in national health registries, can be used to predict 90-day mortality accurately after colorectal cancer surgery.
© The Author(s) 2021. Published by Oxford University Press on behalf of BJS Society Ltd.
Figures
References
-
- Degett TH, Dalton SO, Christensen J, Søgaard J, Iversen LH, Gögenur I et al. Mortality after emergency treatment of colorectal cancer and associated risk factors – a nationwide cohort study. Int J Colorectal Dis 2019;34:85–95 - PubMed
-
- Sjo OH, Larsen S, Lunde OC, Nesbakken A. Short term outcome after emergency and elective surgery for colon cancer. Colorectal Dis 2009;11:733–739 - PubMed
-
- Iversen LH, Ingeholm P, Gögenur I, Laurberg S. Major reduction in 30-day mortality after elective colorectal cancer surgery: a nationwide population-based study in Denmark 2001–2011. Ann Surg Oncol 2014;21:2267–2273 - PubMed
-
- Iversen LH, Green A, Ingeholm P, Østerlind K, Gögenur I. Improved survival of colorectal cancer in Denmark during 2001–2012 – the efforts of several national initiatives. Acta Oncol 2016;55:10–23 - PubMed
-
- Adam MA, Turner MC, Sun Z, Kim J, Ezekian B, Migaly J et al. The appropriateness of 30-day mortality as a quality metric in colorectal cancer surgery. Am J Surg 2018;215:66–70 - PubMed
Publication types
MeSH terms
LinkOut - more resources
Full Text Sources
Other Literature Sources
Medical
