. 2021 Jun 22;72(13):4949-4964.
doi: 10.1093/jxb/erab193.

Overexpression of thioredoxin m in chloroplasts alters carbon and nitrogen partitioning in tobacco

Affiliations

Overexpression of thioredoxin m in chloroplasts alters carbon and nitrogen partitioning in tobacco

María Ancín et al. J Exp Bot. .

Abstract

In plants, there is a complex interaction between carbon (C) and nitrogen (N) metabolism, and its coordination is fundamental for plant growth and development. Here, we studied the influence of thioredoxin (Trx) m on C and N partitioning using tobacco plants overexpressing Trx m from the chloroplast genome. The transgenic plants showed altered metabolism of C (lower leaf starch and soluble sugar accumulation) and N (with higher amounts of amino acids and soluble protein), which pointed to an activation of N metabolism at the expense of carbohydrates. To further delineate the effect of Trx m overexpression, metabolomic and enzymatic analyses were performed on these plants. These results showed an up-regulation of the glutamine synthetase-glutamate synthase pathway; specifically tobacco plants overexpressing Trx m displayed increased activity and stability of glutamine synthetase. Moreover, higher photorespiration and nitrate accumulation were observed in these plants relative to untransformed control plants, indicating that overexpression of Trx m favors the photorespiratory N cycle rather than primary nitrate assimilation. Taken together, our results reveal the importance of Trx m as a molecular mediator of N metabolism in plant chloroplasts.

Keywords: Carbon metabolism; GS-GOGAT pathway; chloroplast; glutamine synthetase; nitrogen metabolism; photorespiration; thioredoxin.


Figures

Fig. 1.
Fig. 1.
Trx m overexpression and redox state in tobacco plants. (A) Phenotype of transplastomic o/exTrxm and Wt plants. (B) Trx m accumulation in transplastomic tobacco plants. Quantitation of Trx m protein was done by densitometric analysis of a dilution series of recombinant Trx m from E. coli and leaf extracts from o/exTrxm and Wt plants. Representative western blot analyses of Trx m expression are shown. The amount of plant extract loaded, indicated over the blots, was adjusted to be comparable to the signal of the recombinant Trx m used as a standard TP, total protein. Results are presented as the fold increase of Trx m content in o/exTrxm genotype relative to the Wt (=1). Results are the mean ±SE of three independent plants per genotype. Statistical significance compared with the Wt is indicated by an asterisk (*P<0.05, Student’s t-test). (C) Redox status of overexpressed Trx m in tobacco chloroplasts. AMS alkylation and western blot analysis after non-reducing SDS-PAGE of Trx m (specific antibody was used). Protein leaf extracts incubated with DTT, H2O2, or diamide (Diam) before treatment with AMS were used as reduced and oxidized controls. Protein extracts not incubated with AMS were used as non-alkylated controls. The mobility of the alkylated (reduced; red) and non-alkylated (oxidized; ox) forms is indicated.
Fig. 2.
Fig. 2.
Starch and sugar concentrations in Wt and o/exTrxm tobacco leaves. (A) Starch, (B) sucrose, (C) glucose, and (D) fructose accumulation in young fully expanded leaves of phytotron-grown plants harvested after 4 h light, 16 h light, and 8 h dark periods. Results are the mean ±SE of six individual plants. Statistical significance compared with Wt plants is indicated by asterisks (*P<0.05, Student’s t-test).
Fig. 3.
Fig. 3.
Log2 fold change (FC) of soluble protein and amino acid contents in o/exTrxm plants compared with the Wt. Leaf samples were taken after 4 h illumination. Significant differences between Wt and o/exTrxm are indicated by asterisks (*P<0.05, Student’s t-test).
Fig. 4.
Fig. 4.
C and N metabolism enzyme activities in o/exTrxm tobacco leaves. Samples were harvested after 4 h illumination from the youngest fully expanded leaves of plants grown in a phytotron under a 16 h light photoperiod and assayed for phosphoglycerokinase (PGK), NADP-dependent glyceraldehyde-3-phosphate dehydrogenase (NADP-GAPDH), fructose-1,6-bisphosphatase (FBPase), triose-phosphate isomerase (TPI), glutamine synthetase (GS), ferredoxin-dependent glutamate synthase (Fd-GOGAT), NAD-dependent glutamate dehydrogenase (NAD-GDH), and phosphoenolpyruvate carboxylase (PEPC). Results are the mean ±SE of five individual plants. Statistical significance compared with Wt plants is indicated by asterisks (*P<0.05, Student’s t-test).
Fig. 5.
Fig. 5.
Determination of GS2 oligomerization, activity, and stability under oxidative conditions. (A) GS2 protein complexes. Proteins from Wt and o/exTrxm chloroplasts were extracted under non-reducing conditions, separated by BN-PAGE, and analyzed by Western blot with anti-GS2 antibody. Photosynthetic thylakoid complexes are shown on the right and the molecular weight marker on the left. (B) Redox-sensitive GS activity. Protein extracts from Wt plants were incubated with or without 5 mM DTT or 100 µM CuCl2 for 30 min on ice, and the activity was then measured. Recovery of GS activity by reduction was performed by incubating with 5 mM DTT on ice after sample oxidation treatment (100 µM CuCl2). The activity of protein extracts from o/exTrxm plants was also measured. Results are expressed as means ±SE (n=3). (C) Quantification of GS2 in the o/exTrxm genotype. Total protein extracts (2.5 µg) were separated by SDS-PAGE and analyzed by western blot. Three different plants per line are shown in the blot. Immunoblots were analyzed with Gene Tools Analyzer software (SynGene). Data are given as means ±SE with the Wt relativized to 1. Statistical significance relative to the Wt is indicated by an asterisk (*P<0.05, Student’s t-test). (D) Degradation of GS2 protein in Wt and o/exTrxm plants. Leaves were incubated at 30 °C for up to 24 h in the presence of FeCl3, and the content of GS2 protein was analyzed by immunodetection. Similar results were obtained in eight independent biological replicates, and a representative blot is shown (upper panel). Immunoblots were analyzed with Gene Tools Analyzer software. Protein levels in plants treated for 4, 8, and 24 h are shown relative to the levels in plants treated for 0 h. Data are given as means ±SE. Statistical significance relative to Wt plants is indicated by asterisks (*P<0.05, Student’s t-test).
Fig. 6.
Fig. 6.
Net photosynthesis, photorespiration, respiration, and N status in o/exTrxm tobacco plants. (A) Gas exchange measurements at different oxygen concentrations (2%, 21%, and 40% O2). AN, net CO2 uptake rate. (B) Percentage of reduction in the net photosynthetic rate by photorespiration. The asterisk indicates a statistically significant difference (*P<0.05, Student’s t-test). (C) Dark respiration rates in Wt and o/exTrxm tobacco plants grown under a 16 h light photoperiod. (D) Nitrate and ammonium concentrations in Wt and o/exTrxm plants harvested after 4 h illumination. Results are the mean ±SE of six individual plants. Asterisks indicate statistically significant differences (*P<0.05, Student’s t-test).
Fig. 7.
Fig. 7.
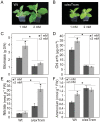
Response to nitrate supply. Plants were grown under a 16 h light photoperiod and watered daily with 1 mM or 2 mM KNO3. After 30 days, plants were photographed (A, B), harvested after 4 h illumination, and analyzed for (C) whole plant biomass, (D) total chlorophyll, (E) nitrate concentration, and (F) ammonium concentration. Results are the mean ±SE of four individual plants. Statistical significance between treatments is indicated by asterisks (*P<0.05, Student’s t-test).

References

    1. Alkhalfioui F, Renard M, Vensel WH, Wong J, Tanaka CK, Hurkman WJ, Buchanan BB, Montrichard F. 2007. Thioredoxin-linked proteins are reduced during germination of Medicago truncatula seeds. Plant Physiology 144, 1559–1579. - PMC - PubMed
    1. Ancín M, Fernández-San Millán A, Larraya L, Morales F, Veramendi J, Aranjuelo I, Farran I. 2019. Overexpression of thioredoxin m in tobacco chloroplasts inhibits the protein kinase STN7 and alters photosynthetic performance. Journal of Experimental Botany 70, 1005–1016. - PMC - PubMed
    1. Aranjuelo I, Tcherkez G, Jauregui I, Gilard F, Ancín M, Fernández-San Millán A, Larraya L, Veramendi J, Farran I. 2015. Alteration by thioredoxin f over-expression of primary carbon metabolism and its response to elevated CO2 in tobacco (Nicotiana tabacum L.). Environmental and Experimental Botany 118, 40–48.
    1. Balmer Y, Koller A, del Val G, Manieri W, Schürmann P, Buchanan BB. 2003. Proteomics gives insight into the regulatory function of chloroplast thioredoxins. Proceedings of the National Academy of Sciences 100, 370–375. - PMC - PubMed
    1. Bénard C, Gibon Y. 2016. Measurement of enzyme activities and optimization of continuous and discontinuous assays. Current Protocols in Plant Biology 1, 247–262. - PubMed

Publication types

MeSH terms