. 2021 Jun;26(4):479-494.
doi: 10.1007/s00775-021-01864-w. Epub 2021 May 8.

Low-molecular-mass labile metal pools in Escherichia coli: advances using chromatography and mass spectrometry

Affiliations

Low-molecular-mass labile metal pools in Escherichia coli: advances using chromatography and mass spectrometry

Hayley N Brawley et al. J Biol Inorg Chem. 2021 Jun.

Abstract

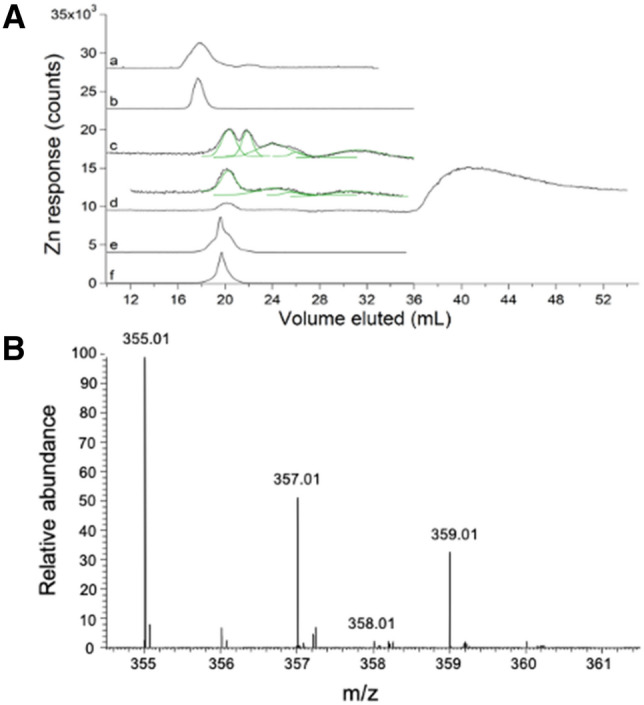
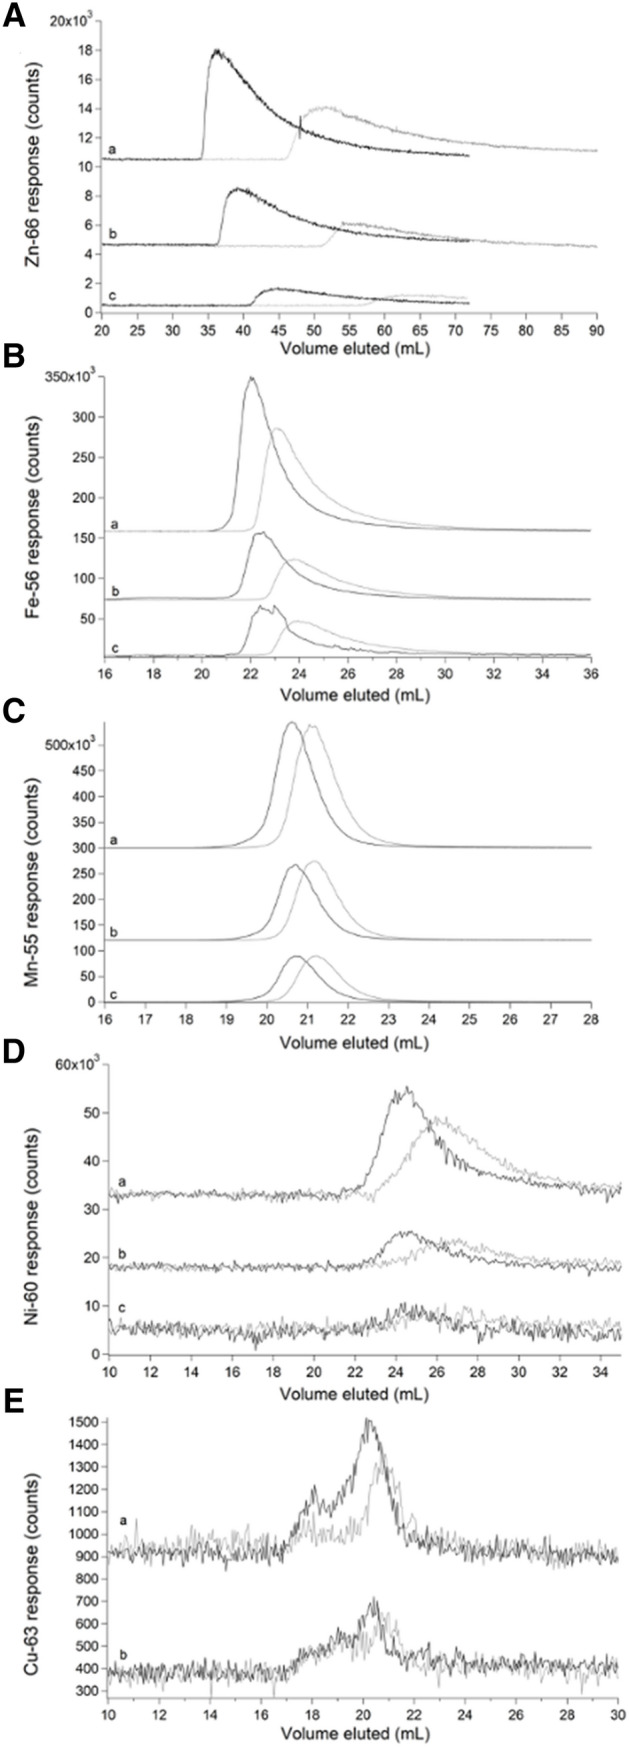
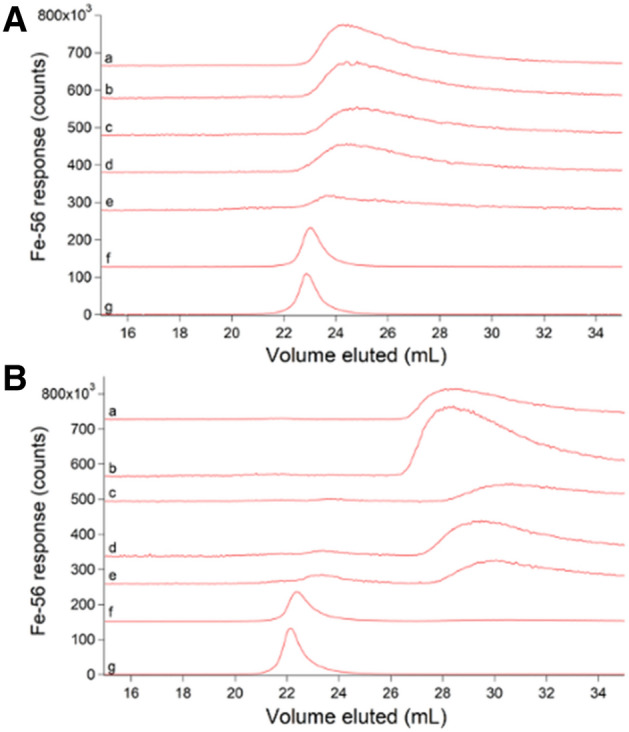
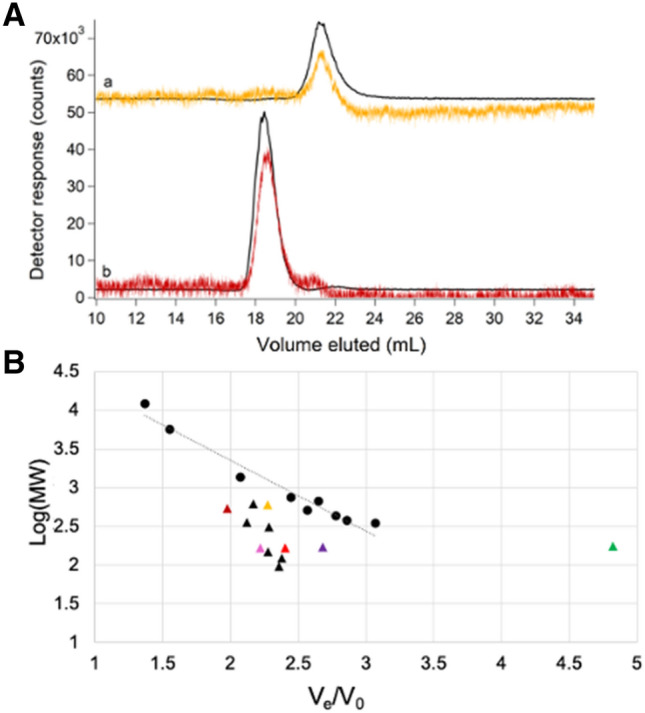
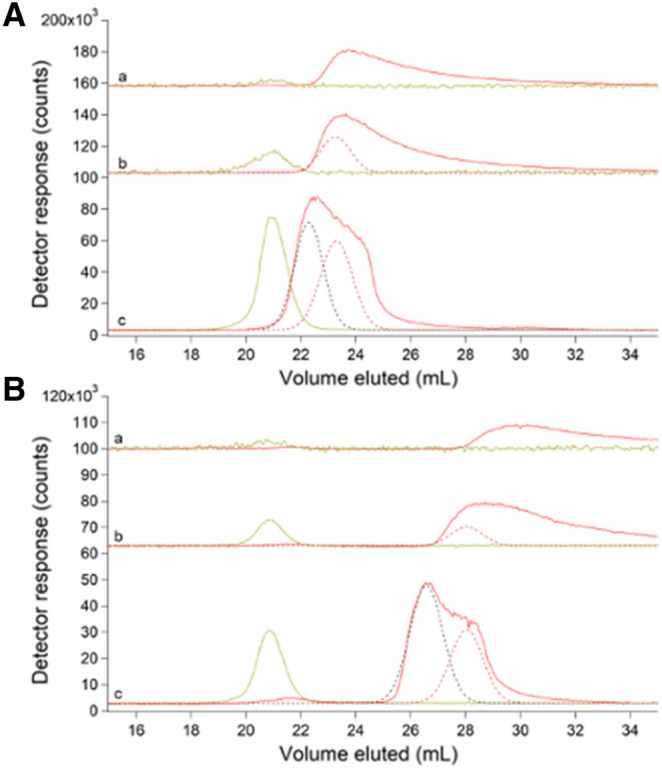
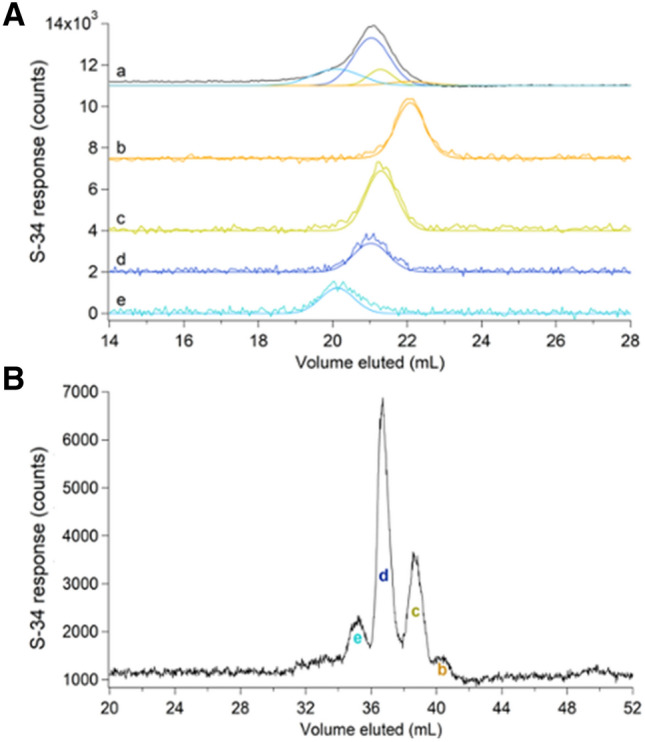
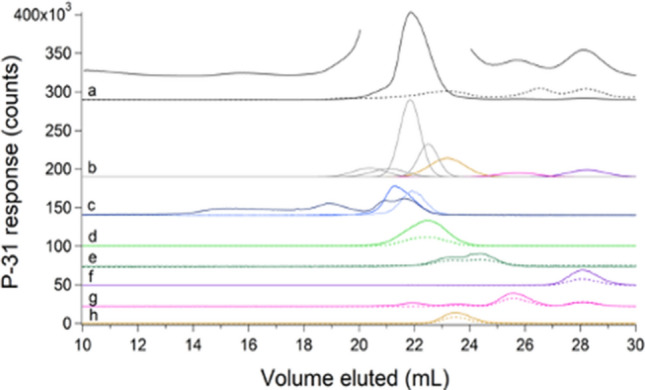
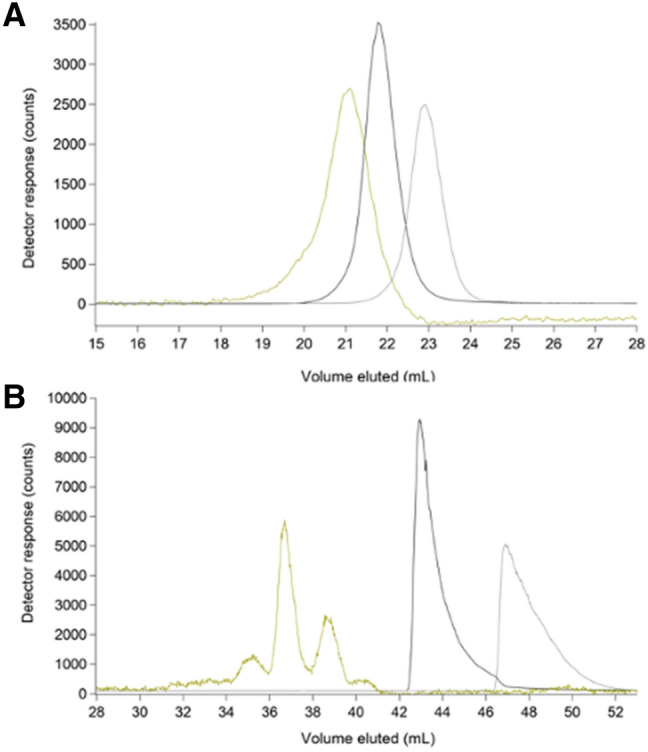
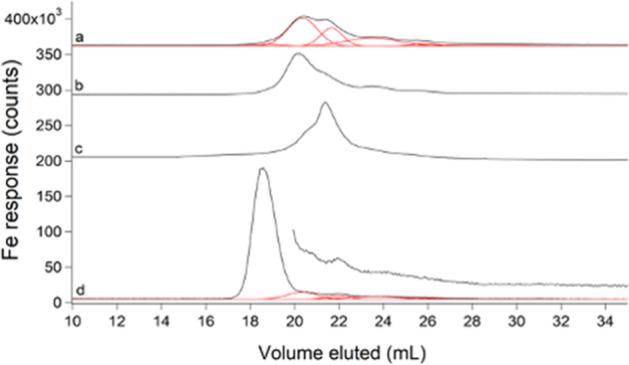
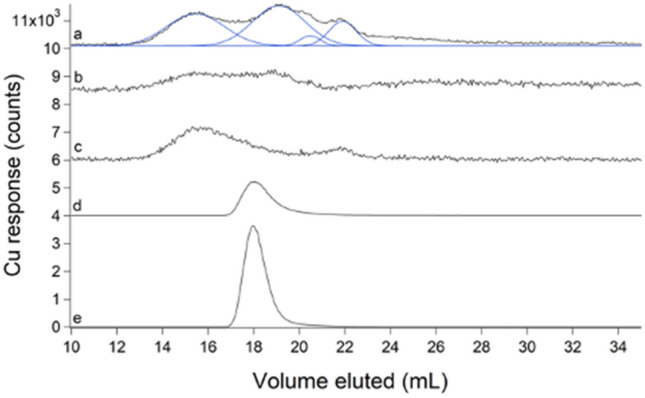
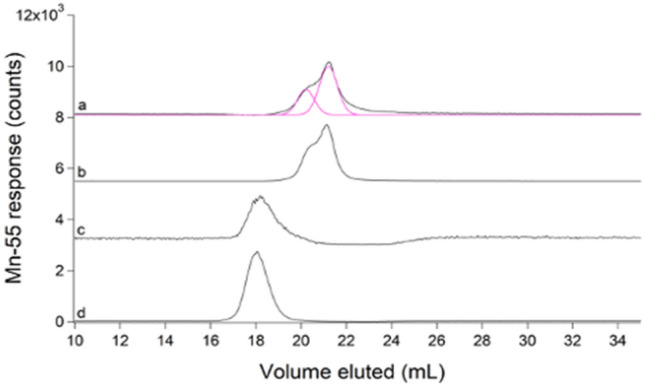
Labile low-molecular-mass (LMM) transition metal complexes play essential roles in metal ion trafficking, regulation, and signalling in biological systems, yet their chemical identities remain largely unknown due to their rapid ligand-exchange rates and weak M-L bonds. Here, an Escherichia coli cytosol isolation procedure was developed that was devoid of detergents, strongly coordinating buffers, and EDTA. The interaction of the metal ions from these complexes with a SEC column was minimized by pre-loading the column with 67ZnSO4 and then monitoring 66Zn and other metals by inductively coupled plasma mass spectrometry (ICP-MS) when investigating cytosolic ultrafiltration flow-through-solutions (FTSs). Endogenous cytosolic salts suppressed ESI-MS signals, making the detection of metal complexes difficult. FTSs contained ca. 80 µM Fe, 15 µM Ni, 13 µM Zn, 10 µM Cu, and 1.4 µM Mn (after correcting for dilution during cytosol isolation). FTSs exhibited 2-5 Fe, at least 2 Ni, 2-5 Zn, 2-4 Cu, and at least 2 Mn species with apparent masses between 300 and 5000 Da. Fe(ATP), Fe(GSH), and Zn(GSH) standards were passed through the column to assess their presence in FTS. Major LMM sulfur- and phosphorus-containing species were identified. These included reduced and oxidized glutathione, methionine, cysteine, orthophosphate, and common mono- and di-nucleotides such as ATP, ADP, AMP, and NADH. FTSs from cells grown in media supplemented with one of these metal salts exhibited increased peak intensity for the supplemented metal indicating that the size of the labile metal pools in E. coli is sensitive to the concentration of nutrient metals.

Keywords: Copper; Cytosol; Electrospray ionization mass spectrometry; Iron; Labile metal pools; Manganese; Size-exclusion chromatography; Zinc.


Conflict of interest statement

There are no conflicts or competing interests to declare.

Figures

Fig. 1
Fig. 1
Zn-detected LC–ICP-MS chromatograms (A) and ESI-MS spectrum (B) of E. coli FTS: A: (a) average of 3 traces of cytosolic FTS isolated from MG1655 E. coli cells using EDTA [21]. (b) 1 µM ZnCl2 + 1 µM EDTA ÷ 4. The mobile phase for (a) and (b) was 20 mM ammonium bicarbonate pH 8.5. (c) average of 8 independent traces of FTS from RYMG1655 + pZa31mycR E. coli cytosol (black) overlaid with simulations (green). Unless specified otherwise, no EDTA was used during isolation, the default mobile phase was 50 mM AA pH 6.5, and the cells were MG1655 + pZa31mycR. (d) Average of 2 traces from independent FTSs of cells grown in 100 µM Zn supplemented growth medium. Offset is (d) × 5. (e), FTS as in (c) but incubated with 500 µM EDTA ÷ 20. (f), 1 µM Zn acetate + 20 µM EDTA ÷ 10. B: Positive mode spectra of Zn-containing LC fractions from FTSs isolated as in (a), then lyophilized and resuspended in D2O. Lines with indicated masses reflect the 1 + charge state of Zn(EDTA) and showed the expected isotope pattern. × # and ÷ # refer to an #-fold multiplication/division of the detector response in the plotted trace
Fig. 2
Fig. 2
Chromatograms of aqueous zinc (A), iron (B), manganese (C), nickel (D), and copper (E) on an unloaded (grey) and 67ZnSO4-loaded single SEC column (black). A (a–c), 5, 2, and 1 µM Zn acetate, respectively. B (a–c), 5, 2, and 1 µM FeSO4. C (a–c), 5, 2, and 1 µM MnCl2. D (a–c), 5, 2, and 1 µM NiSO4. E (a–b), 5 and 1 µM CuSO4
Fig. 3
Fig. 3
Iron-detected chromatograms of Fe(ATP) using 50 mM (A) and 20 mM (B) ammonium acetate pH 6.5 mobile phases. All traces were from samples containing 1 µM FeSO4 + the following (final) µM concentrations of Na2ATP. A: (a) 0; (b) 5; (c) 10; (d) 25; (e) 50; (f) 500; (g) 1000. B: (a) 0; (b) 5; (c)10; (d) 25; (e) 50; (f) 500; (g) 1000
Fig. 4
Fig. 4
Chromatograms of [Fe(phen)3]2+ (orange) and [Fe(BPY)3]2+ (red) (a) and deviations from expected molecular mass trend line (B). A: (a) 2 µM FeSO4 + 20 µM phen detected by iron ICP-MS (black, ÷ 1.33) and at 510 nm (orange, × 104); (b) 2 µM FeSO4 + 20 µM BPY detected by iron ICP-MS (black, ÷ 2) and at 523 nm (red, × 104). B: Molecular mass calibration curve and trendline (log(MM) =  − 0.9204(Ve/V0) + 5.1971; R2 = 0.9575) using standards from Table S1 (circles) and a Zn-loaded single column. Deviant standards are shown as triangles. [Fe(phen)3]2+ and [Fe(BPY)3]2+ are color-coordinated to UV–Vis traces in A. Aqueous metal standards were Zn acetate (green), FeSO4 (bright red), MnCl2 (pink) and NiSO4 (purple)
Fig. 5
Fig. 5
Chromatograms of FeSO4 (red) and GSH (yellow) using 50 mM (A) and 20 mM (B) AA mobile phase buffers. A: (a) 1 µM FeSO4 + 100 µM GSH × 5; (b) same as (a) but with 1 mM GSH; (c) same as (a) but with 100 mM GSH ÷ 10. B: (a) 1 µM FeSO4 + 100 µM GSH × 5; (b) same as (a) but with 1 mM GSH ÷ 10; (c) same as (a) but with 50 mM GSH ÷ 10. Dashed lines are simulations
Fig. 6
Fig. 6
Sulfur-detected chromatograms of FTS and standards on the single (A) and double (B) column. A: (a), averaged FTS trace (black) and simulations (colored lines coded with standard simulations below). (b), 500 µM cysteine; (c), 500 µM methionine; (d), 250 µM GSH; (e), 250 µM GSSG. B: FTS replicate with peaks (b)–(e) correspond to standards in A that were identified by positive-mode ESI-MS
Fig. 7
Fig. 7
Phosphorus-detected chromatograms of FTS and standards. a Average traces of FTS detected by ICP-MS (solid black line ÷ 10) and at A260 (dashed black line × 20). The offset line is the ICP-MS data magnified × 2 excluding the dominating peak. b Simulations of the FTS color-coded to the standards listed below. c Polyphosphate after ultrafiltration (darker blue); 500 µM NaH3P2O7 ÷ 2 (dark blue), 500 µM Na2HPO4 × 5 (light blue); d 100 µM NADPH ÷ 2 (solid line) and A260 × 20 (dashed line); e 100 µM NADH × 5 (solid line) and A260 × 200 (dashed line); f 100 µM AMP × 3 (solid line) and A260 × 20 (dashed line); g 100 µM ADP and A260 × 20; h 100 µM ATP and A260 × 30
Fig. 8
Fig. 8
Chromatograms of FTS on a single (a) and double (b) SEC column, monitoring sulfur (yellow), sodium (black) ÷ 5 × 105, and potassium (grey) ÷ 104
Fig. 9
Fig. 9
Iron-detected chromatograms of FTSs. a Average of 8 FTSs (black) and simulations (red); b average of 4 FTSs harvested during mid-exponential growth; c average of 4 FTS from cells supplemented with 100 µM Fe(III) citrate and harvested during mid-exponential growth; d un-supplemented FTS replicate incubated with 500 µM BPY and simulations for remaining peaks from a in red. Offset in d is the same trace but × 3
Fig. 10
Fig. 10
Copper-detected chromatograms of FTSs (a–d) and standard (e). a Average of 8 FTSs (black) with simulations in blue; b average of 4 FTSs from mid-exponential growth harvest; c FTS from cells supplemented with 1 µM of CuSO4 and harvested in mid-exponential phase; d un-supplemented FTS replicate incubated with 50 µM TPEN ÷ 100; e 1 µM CuSO4 + 10 µM TPEN ÷ 200
Fig. 11
Fig. 11
Manganese-detected chromatograms of FTSs (ac) and standard (d). a Average of 8 FTSs (black) and simulations (pink); b FTS from cells supplemented with 100 µM of MnCl2 ÷ 100; c FTS incubated with 50 µM TPEN; d 1 µM MnCl2 + 10 µM TPEN ÷ 20

Similar articles

Cited by

References

    1. Finney LA, O’Halloran TV. Transition metal speciation in the cell; insights from the chemistry of metal ion receptors. Science. 2003;300:931–936. - PubMed
    1. Imlay JA. Pathways of oxidative damage. Ann Rev Microbiol. 2003;57:395–418. - PubMed
    1. Macomber L, Imlay JA. The iron-sulfur clusters of dehydratases are primary intracellular targets of copper toxicity. Proc Natl Acad Sci USA. 2009;106:8344–8349. - PMC - PubMed
    1. Imlay JA. The mismetallation of enzymes during oxidative stress. J Biol Chem. 2014;289:28121–28128. - PMC - PubMed
    1. Gu M, Imlay JA. Superoxide poisons mononuclear iron enzymes by causing mismetallation. Mol Microbiol. 2013;89:123–134. - PMC - PubMed

Publication types

LinkOut - more resources